Behind the Pretty Frames: Elden Ring
- Introduction
- Configs
- Behind the Frame
- D3D12
- Draw
- Compute
- Life of a Frame [Rendering Graph]
- Engine General Observations
- Epilogue
- Related Readings & Videos
Introduction
When Elden Ring got released, I knew that i wanna sneak peak behind the curtains and look what is lying in there. i won’t claim that i’m the die-hard fan of solus genre, but i’m a die-hard gamer for the 3rd person genere and i like to try them even if they’re not in the sub-genere i love. I’m probably more biased toward the sub-genre of action adventure, it’s on the top of that genre for me, and souls would be the bottom of that list. If fact, the thing i like about souls games is Miyazaki himself more than the actual games he made! His vision, his character and his story of breaking into game design! Oh man! a big inspiration.
When i watched the PC coverage for Elden Ring at Digital foundry, i did notice that the MSI-Afterburner/Rivatuner is reporting that the game is on D3D12, and that excited me. Because 1st, the last game i dug was an old game running on D3D9 (more about it in the future), and the one before was a 2022 release that runs on D3D11 and that was a big disappointment, so you can tell, it’s been near 1/2 a year and did not passionly dug into a “modern” game tech for a released PC game (usually steam for this type of personal endeavors). 2nd, it means there will be many fancy D3D12 features utilized in smart ways. What could be better than using the modern-modern graphics APIs for a PC game in 2022!
In fact, it turned out in the other way! I got kinda disappointed, not heavily; by some choices, and you will learn more about my reasons below. But in general, and it is very clear for any gamer, that such a game is much more about the core combat, lore and the gameplay, and the AAA-is graphics is complementary thing to deliver that deep lore. The early showcasing for the game “looked” visually amazing (well it’s the habit for E3s and all AAA anyways!), but the final delivery of visuals fidelity and level of detail, is not that great (imho), in fact, Bloodborne & Sekiro delivered better quality in terms of visual beauty. So yes, I’m kinda graphically disappoint from this D3D12 PC game as a graphics digger behind the frames. But I’m very satisfied as a gamer!
Configs
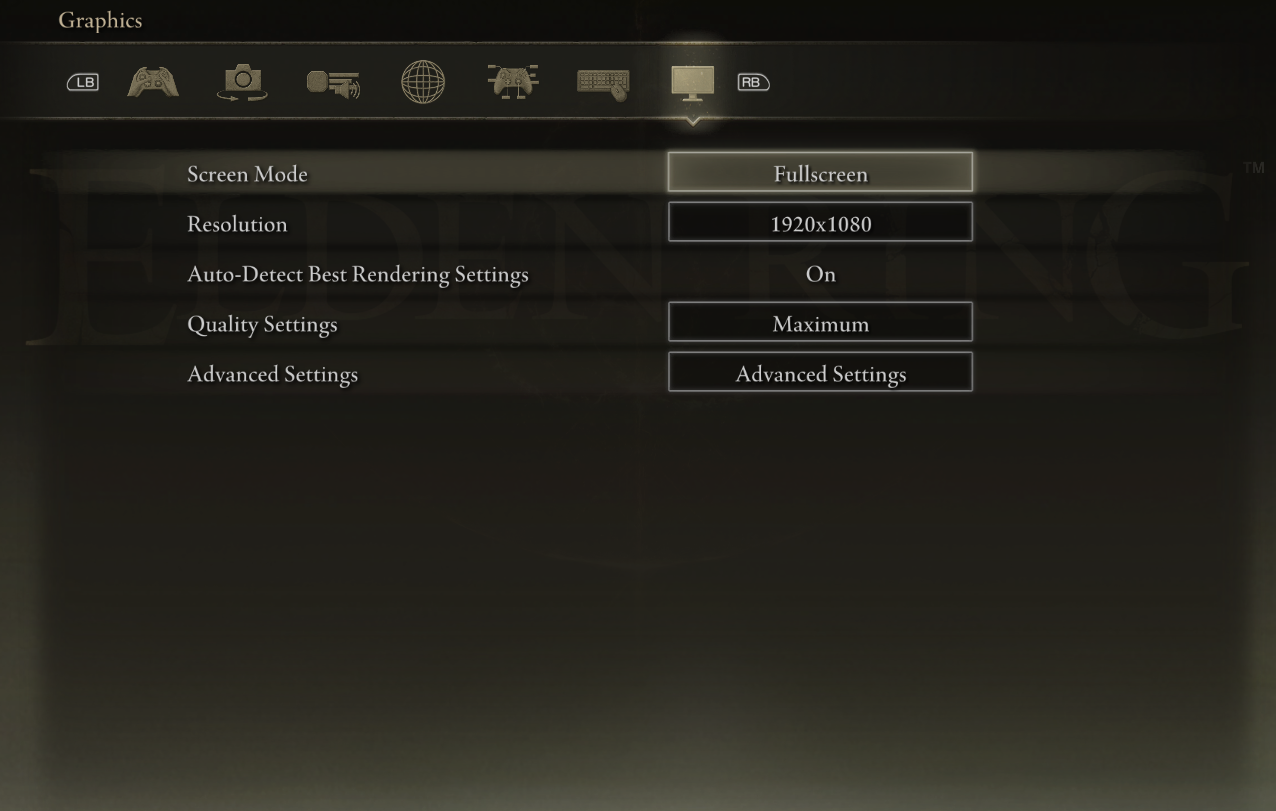
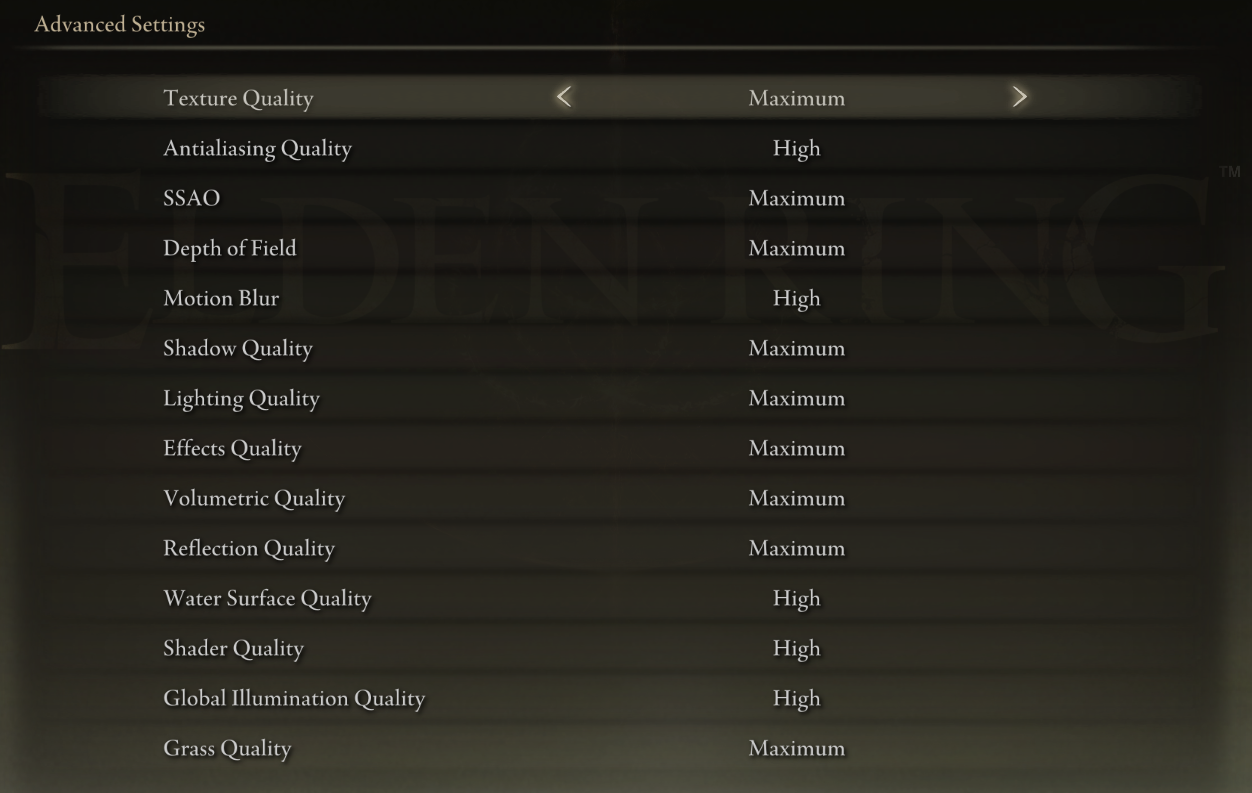
Captures this time were made only in one of my PCs, didn’t want spend more time as the previous game taking the same capture in two different configs, and keep copying over the save files across the network! The PC i settled on this time is the one with the RTX 3080, Ryzen 5950x and 32G RAM. At the other hand the game graphics Quality Settings is set to Maximum, under a Resolution of 1080p and the fancy Auto-Detect Best Rendering Settings is On (it works like dynamic resolution, except it’s for pretty much every other graphical aspect, not only the resolution aspect). But anyways, I’m kinda sure it won’t kick-in and adjust anything, as the testing PC is quite good for such a PC game.
With that said, I’m surprised by the “strange” choice for the graphics settings, where some settings such as Texture Quality have 4 configs, others such as Antialiasing Quality would have 3 configs only. Things might have been made in a better way!
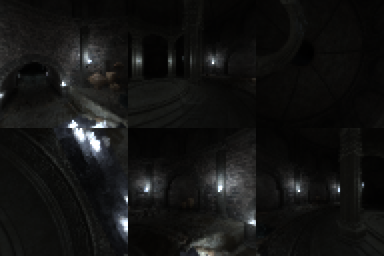
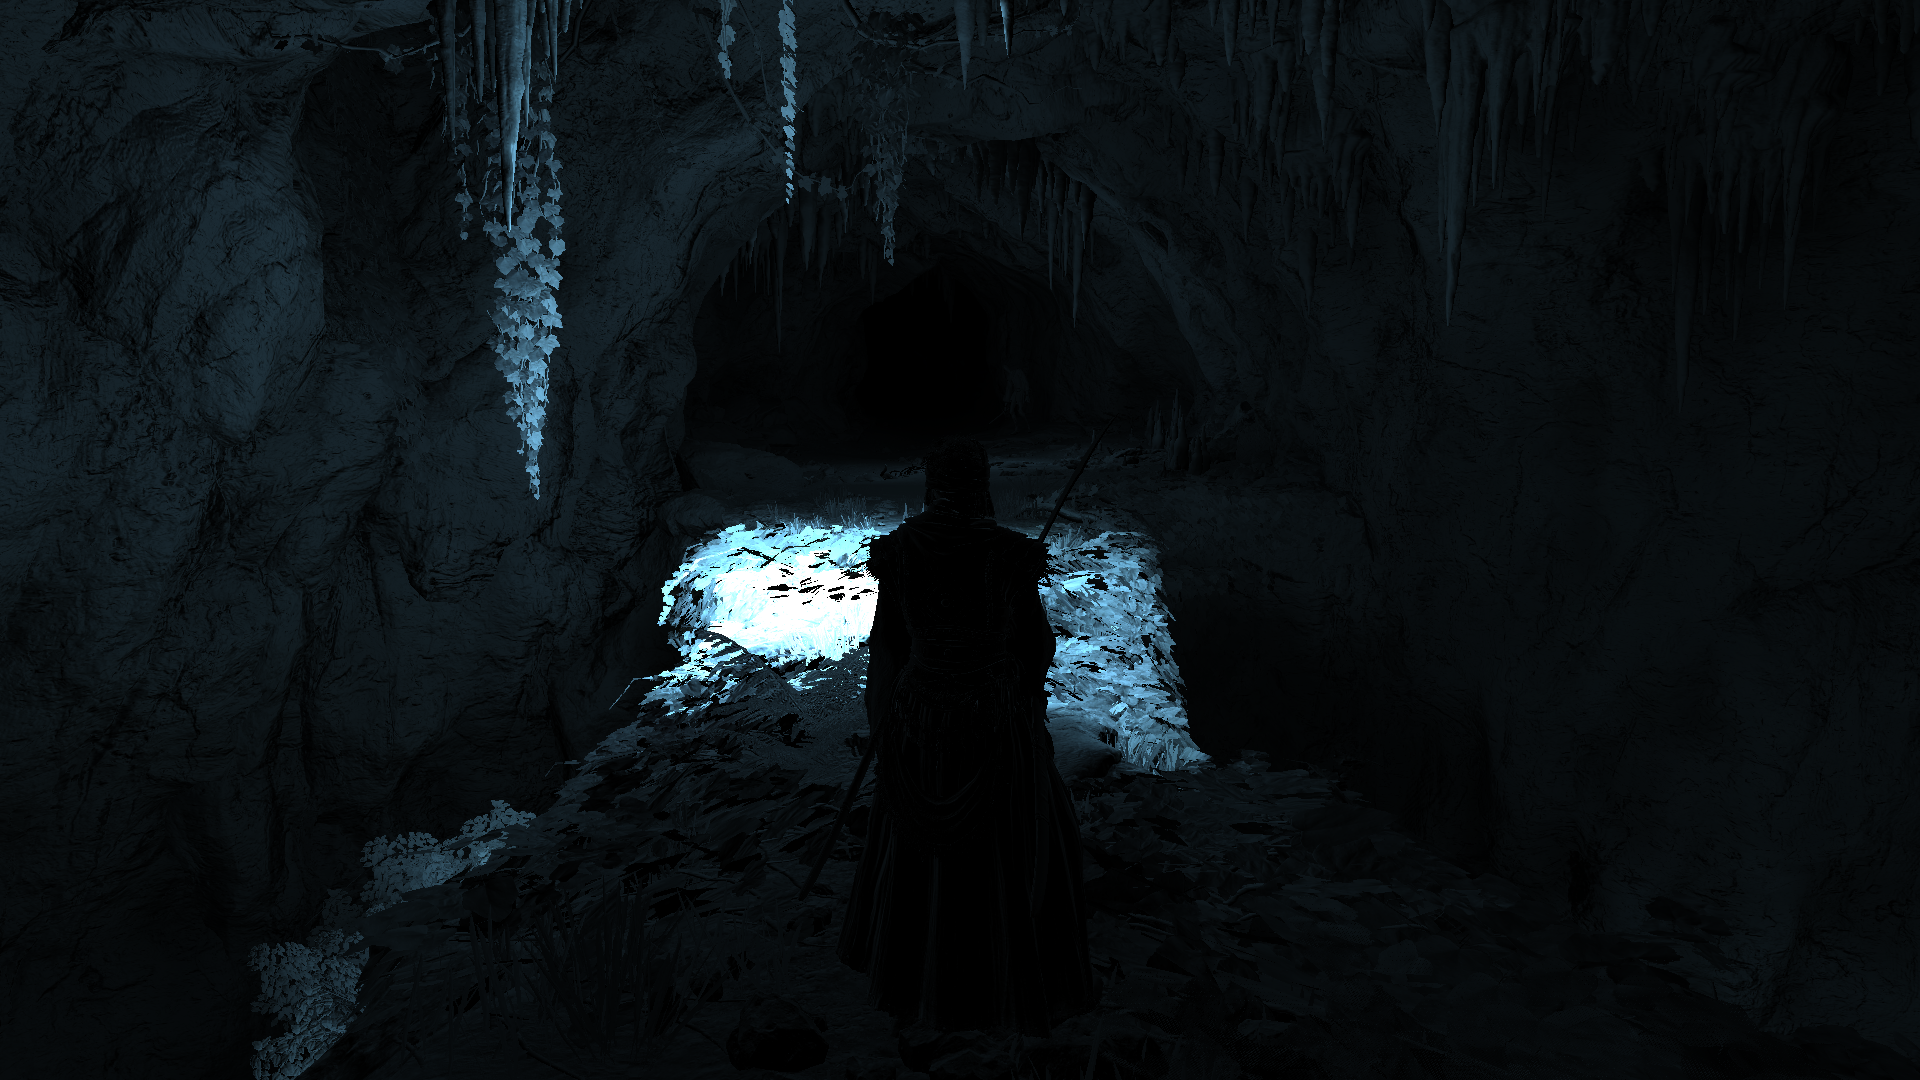
As the old habit goes, i do take multiple captures for multiple areas to cover figure out and understand topics better, as one capture could hold more clear insight about something than another capture. Also i do take multiple of captures for the same capture as the same area/view, just in case.
With that said, I’ll be more biased to refer to the captures from the cinematic sequences rather than captures from actual gameplay, don’t get me wrong, but both are runtime, both at the same engine, and both have pretty similar render queues, but I’ve noticed (well it’s common anyways) that in cinematic pretty much everything is pushed to maximum, and there are things that i love (such as DoF) which is totally absent during the gameplay. At the other hand, i did notice that the game fails to run solid 60fps at gameplay when are outside, but it is sharp at solid 60fps when either are inside an interior (cave, dungeon, castle,..etc.) or during cinematic. So capturers from cinematic will be for granted out of any downscaling/dynamic resolution and whatnot.
A side note, if you’re willing to capture from that game, it might be such a nightmare, due to the EasyAntiCheat software that run first in order to launch the game itself, which makes pretty much every common tool quite useless against that game. So you might would like to find a way around that. But in general, for me it was quite bumpy with that game! And even when succeed to capture, it would crash frequently afterwards. I won’t proceed further in details at that aspect, but all what i can hint is that the EasyAntiCheat probably was named “easy” because it is easy to cheat that anti-cheat!
Behind the Frame
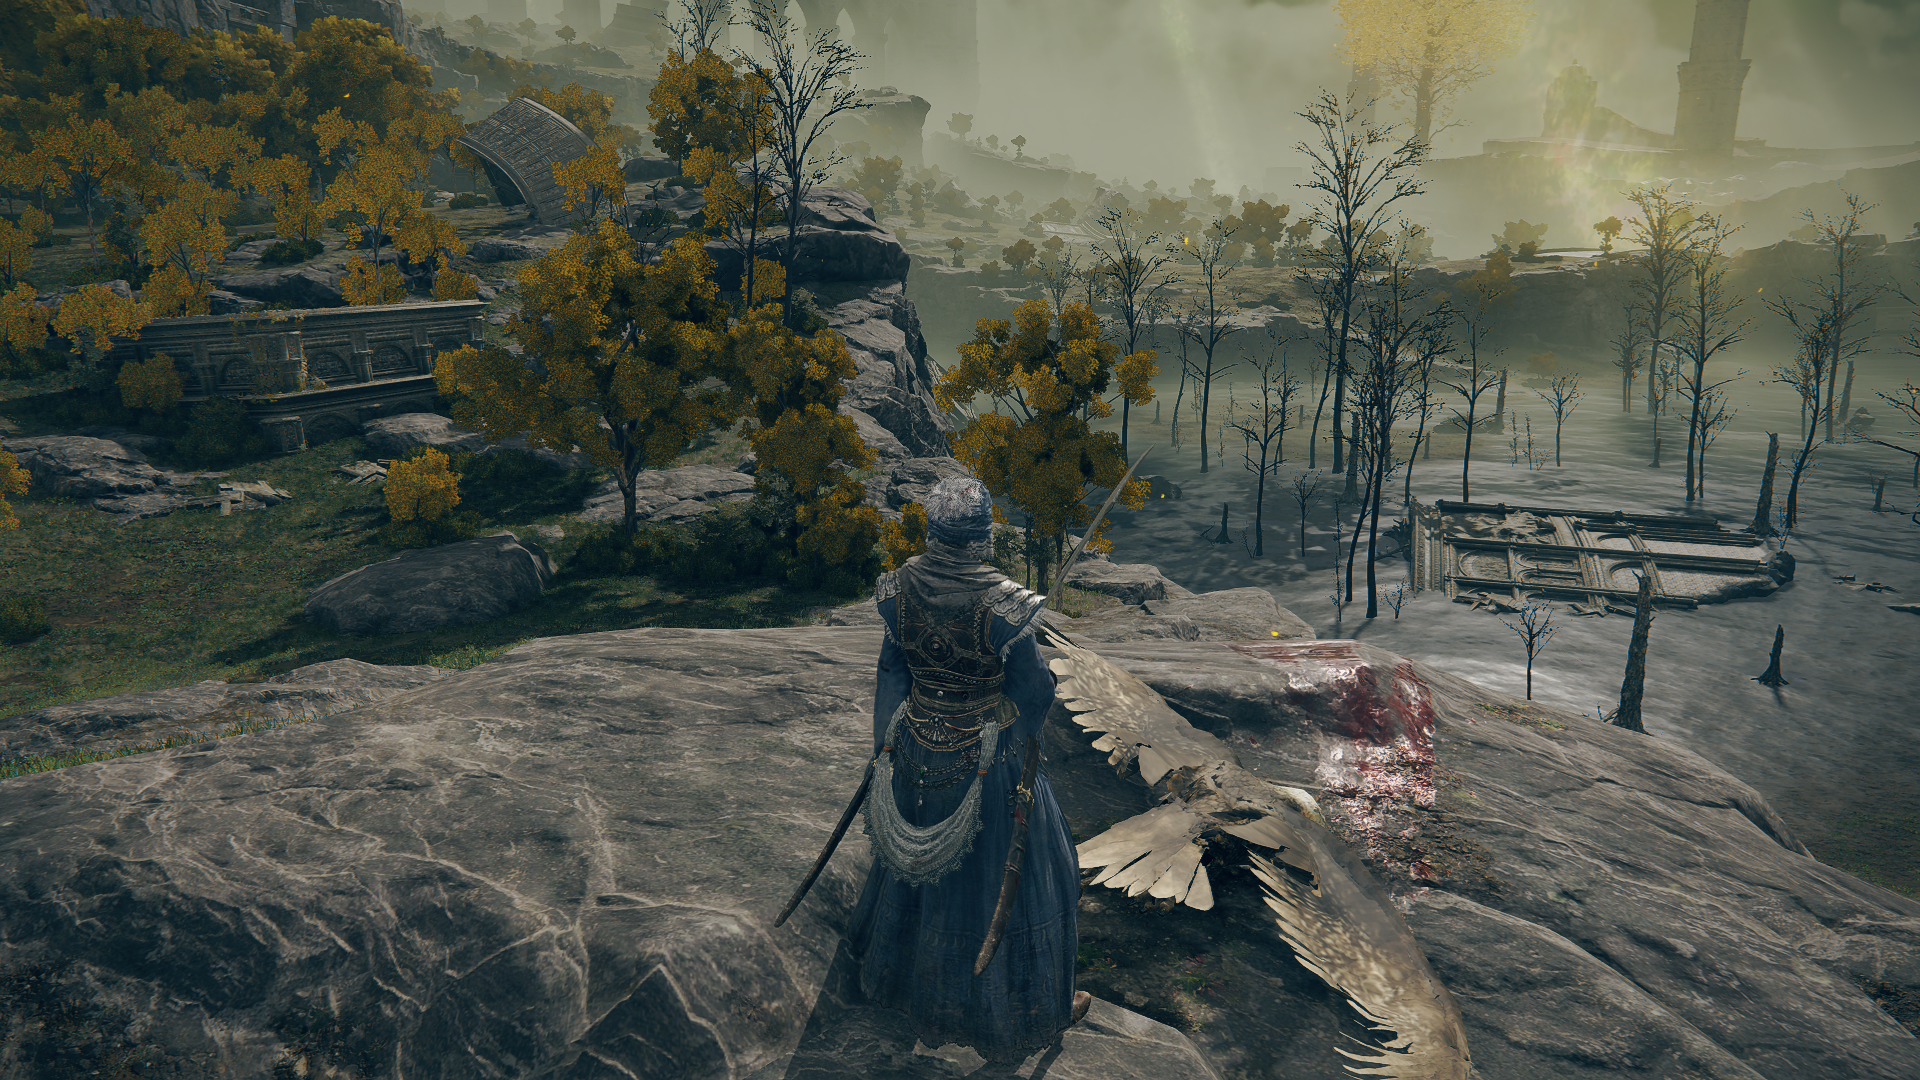
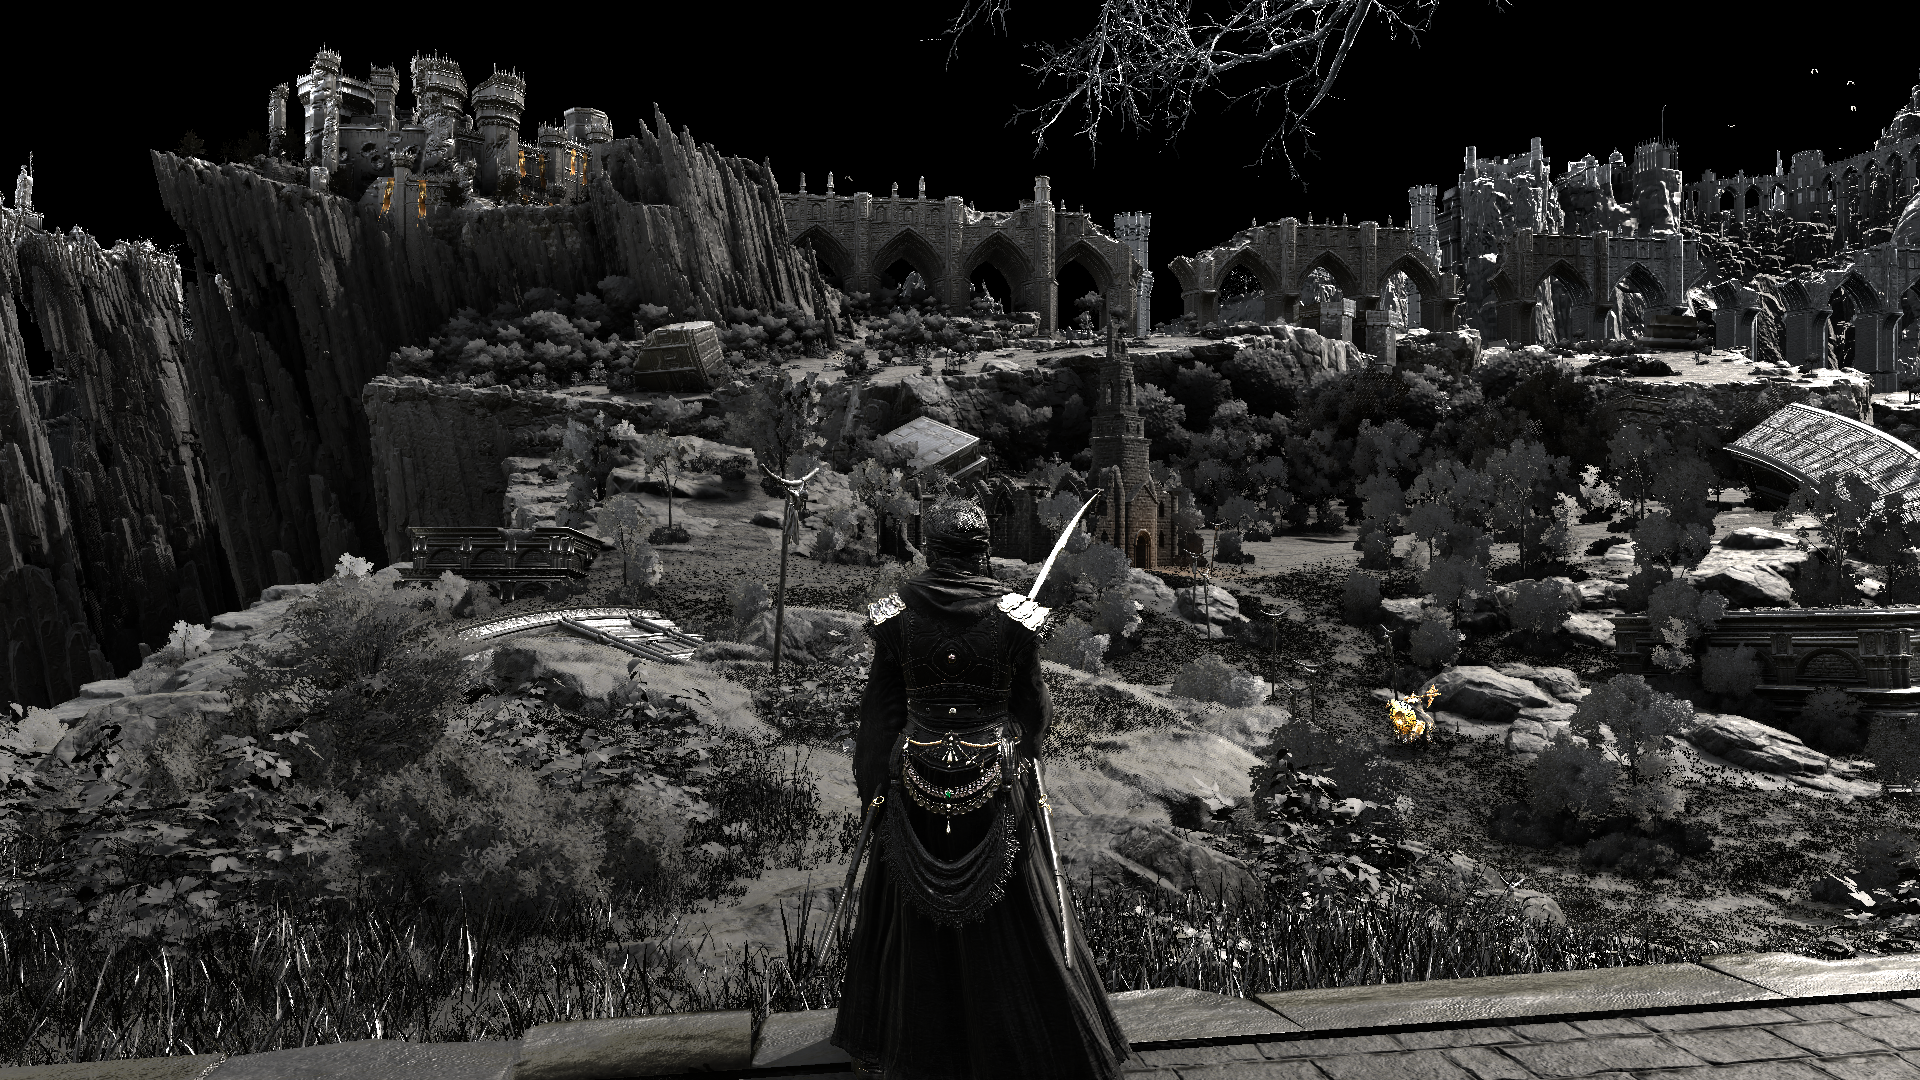
As it is always the case with me, I like to take more than a single capture, across multiple areas of the game. So if you see a capture at X area of the game, this is one capture of that place, but i might have taken 10 more at the exact same place across different seconds. Screenshots below will vary between ~5 different frames, from different areas/situations of the game. As i wanted to cover few things that are not necessarily preset at the same time. Not only that, but i personally LOVE the extreme cases, so for example, if I’m analyzing DOF, then let’s pick a scene with a very distinguished foreground & background, and perhaps a cinematic capture, because this is where DOF usually shines in AAA games! If we looking into Bloom, then why not try to get some fire and lights around us, so we get a very good capture,….etc. You got my point.
D3D12
Like I said, before i do any captures, i was aware that the game is utilizing D3D12 for the Windows port, and i was very excited about that. But it turned out what my grandma told me long time ago is for true, she once said “Not because a developer used to make solid games for PlayStation, they will do the same for their PC ports”. The reason i put that silly quote that i believe that game would have gone with D3D11 or even older versions! as the game is almost not utilizing much of what D3D12 brough to the table. At least it looks like not utilizing any VRS which is one of the most interesting features of D3D12 for me. Mesh Shaders, Raytracing, Sampler Feedback, Direct Storage, and whatnot, none of that been utilized in any degree in Elden Ring’s PC D3D12 port.
Draw
In all images below, you can just Middle Click to open in full resolution within a new tab.
Resources Copy/Create
Every frame in Elden Ring starts with a mixed plate of near ~25k commands of CopyDescriptorsSimple and CreateConstantBufferView. Those are self explanatory things to prepare resources data for accessing. If you spent most of your time in OpenGL and now in Vulkan (mean not very familiar with DX) you might have said: “Okay, so this is how you work with DX12”, but in fact nope! You can take captures from opensource D3D12 games/engine, you can take captures from Unreal D3D12 released games, you can make a new unreal project based on RHI D3D12 and package it and capture from it, even with BaseMark GPU Benchmark for D3D12…whatever you do you will notice two main things in all those D3D12 games/applications:
1. They barley call those functions (if not calling them at all)
2. They don’t prepare “all” the resources access views before doing any frame rendering actual work.
So to give you a more clear idea about the problem here (which could possibly be the reason behind the stutter debate for Elden Ring) you can look at the two frame capture timelines below, the first capture’s timeline, is from BaseMarkGPU, you can see, from the start of the frame to the end, it’s all frame work, and this is normal and expected. But at the other hand, the second capture’s timeline is a frame from Elden Ring, you can see that the actual frame work (drawing/computing) is taking place at the last 1/4 of the frame duration, and this is…bizarre!


This is interesting…this is confusing…and this leaves a lot of questions, the simplest question, is “why?” the next simplest question in my list is “Did not anybody notice that while working on the game?” !! This is quite long wait until we actually ExecuteCommandLists..This is absolutely CPU stall/stutter related! Not every “wasted time” have to be “Device Wait/Idle”, it could be many other things. And to support that theory of CPU, if looking at GPU duration vs CPU duration, you can easily spot that long wait.
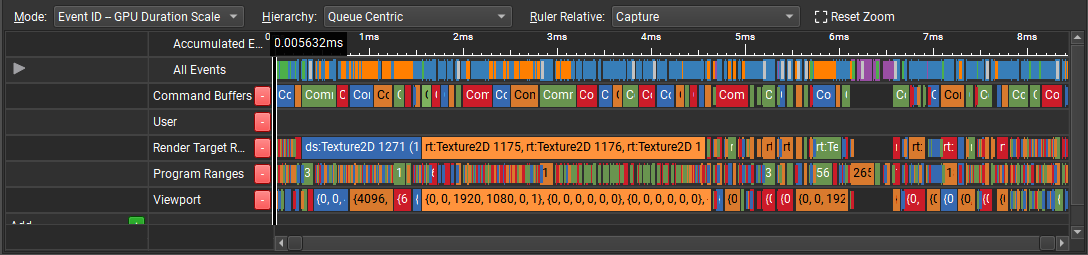
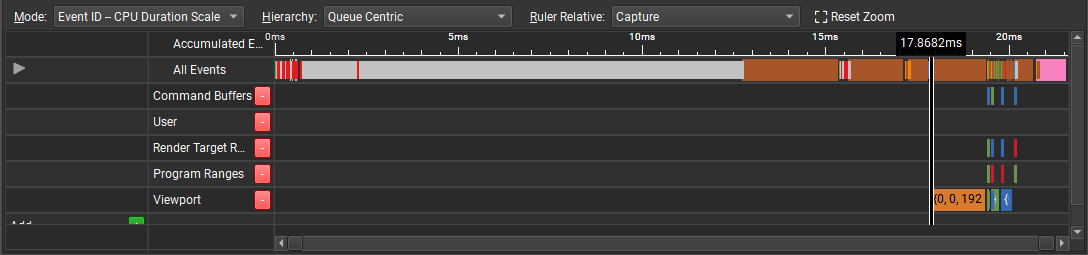
The marker above is at “fixed” location of the frame lifetime, but in two different “scales”. So you can see where the frame marker at the GPU Duration Scale is at 0.005632ms that location in matching at CPU Duration Scale actually 17.8682ms…This is where GPU work actually starts!
If you did not get the point, to give you closer idea of CPU-GPU timeline scales, you can look at the image below, this is basically if we “cut” that first image (GPU frame timeline), and “put” it where it belongs in the second image (CPU frame timeline), this is exactly where it fits.
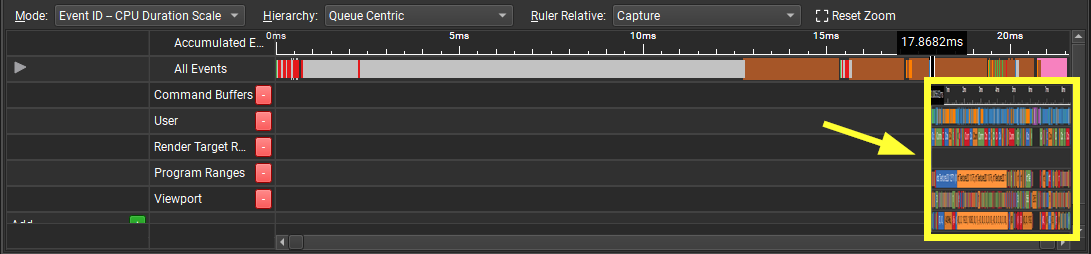
Under a different frame organization/architecture, Elden Ring could’ve ran way faster, with zero stutter i believe!
Copy & Clear
Nothing fancy, and nothing big to mention. It’s just 3 passes of copy/clear of previous frame data, a sequence of CopyBufferRegion and ClearDepthStencilView . This is mostly GBuffer related, for example, adding resource barriers, and then copying the content of the GBuffer render targets from previous frame (Color, Surface, Normals, AO, Depth, SSS,…etc.) as they might be needed for the current frame.
Temporal Ring
If i would pick a nerdy graphics related name to that game, it will be “Temporal Ring” not “Elden Ring”, as you started to notice that there is a lot been carried over from the previous frame (copied) you will notice below that there are many things that are accumulate between frames or better to call them “temporal”…When we hear this word, we usually know the topic will be evolving around Anti-Aliasing, but in Temporal Ring, it’s more beyond that, AA is temporal, SSAO is temporal, Glare, Even shadows, have a Previous frame’s direct shadows carried over to that frame! And things that is not relying on previous frame RT, it rely on Velocity or Motion delta from previous frame. I’ve noticed that in almost every major step/effect in the game, it rely on the previous frame’s data in a way or another. The prefix “Prev” becomes a common friendly word when digging inside that game!
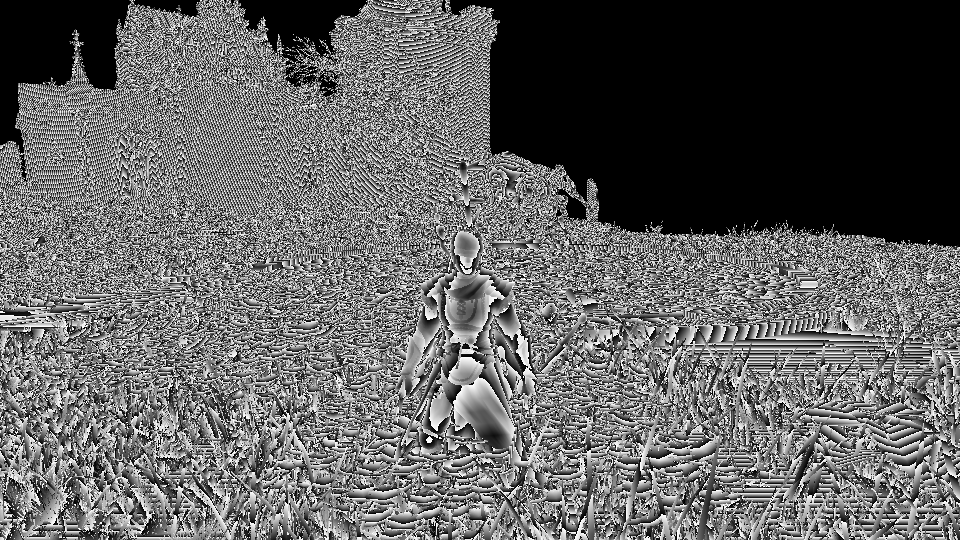
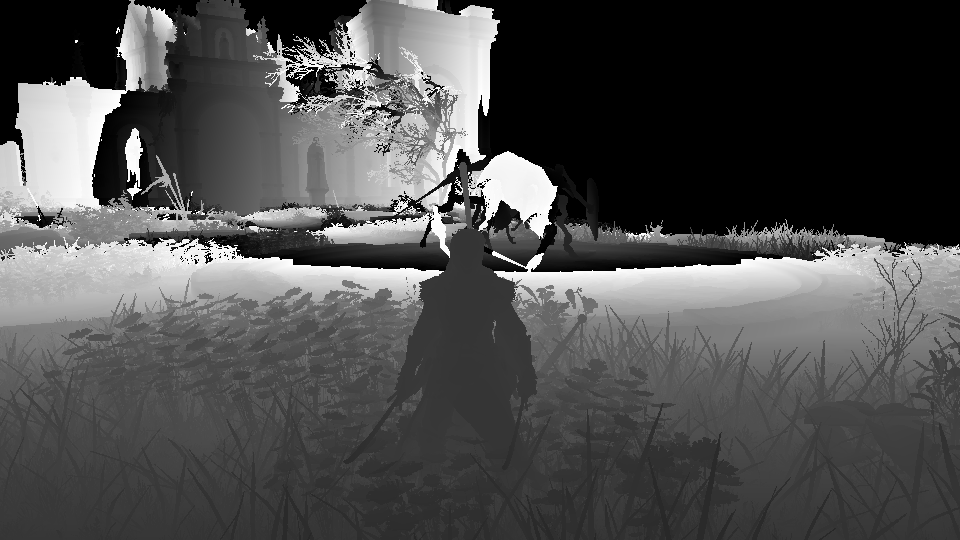
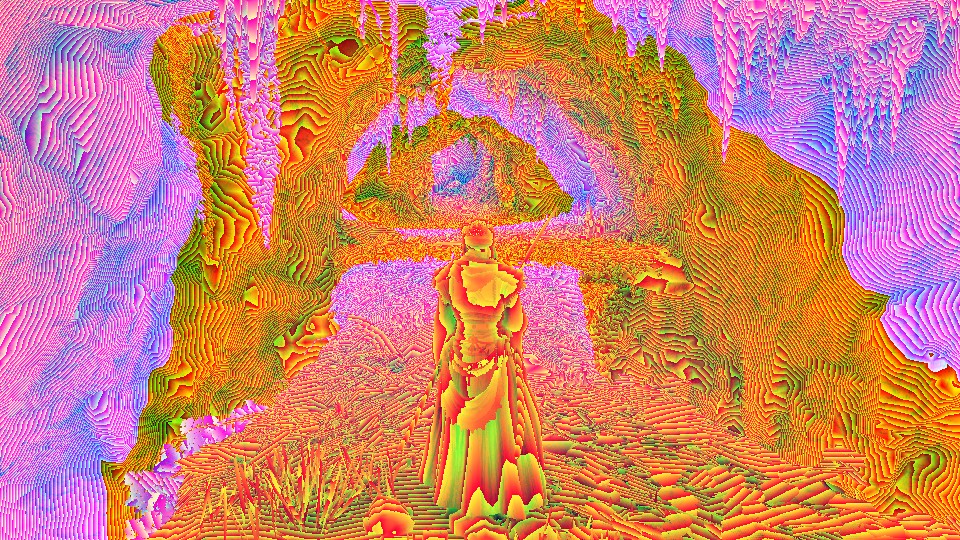
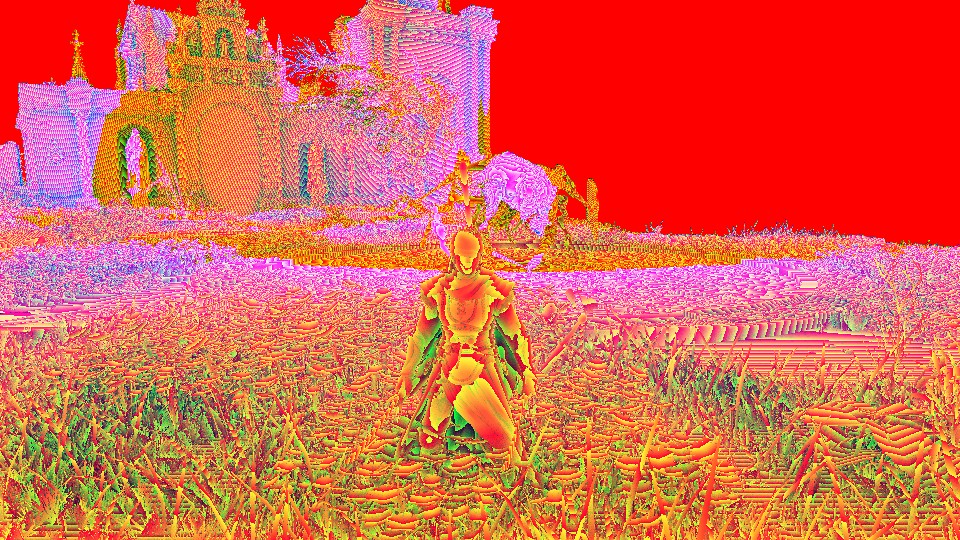
Elden Vertex
One of the things that interests me a lot in different engines, is their vertex descriptions. I’m always interested in seeing if the engine is using a lazy vertex description (like me long time ago) and just use same vertex description for everything (usually skinned even for none skinned meshes), or they are using smart multiple descriptions that each fits multiple situations. Or…they are very very micro-specialized and using even multiple vertex descriptions for different types of the same thing. And as far as i can tell, Elden People of Elden Ring are from that 3rd group of micro-specialized vertex descriptions lovers. Below are some of the “most” commonly used ones across the engine (not all what is exist in the game engine/renderer).
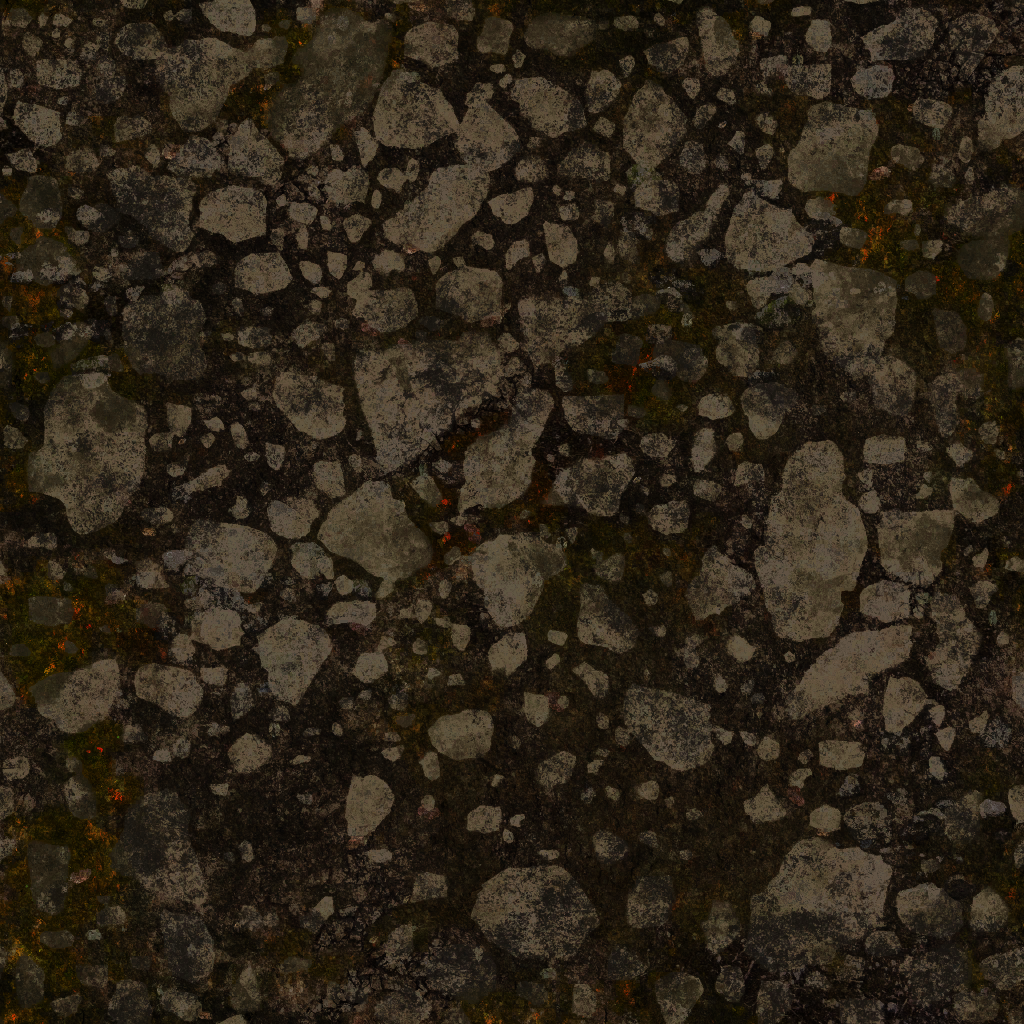
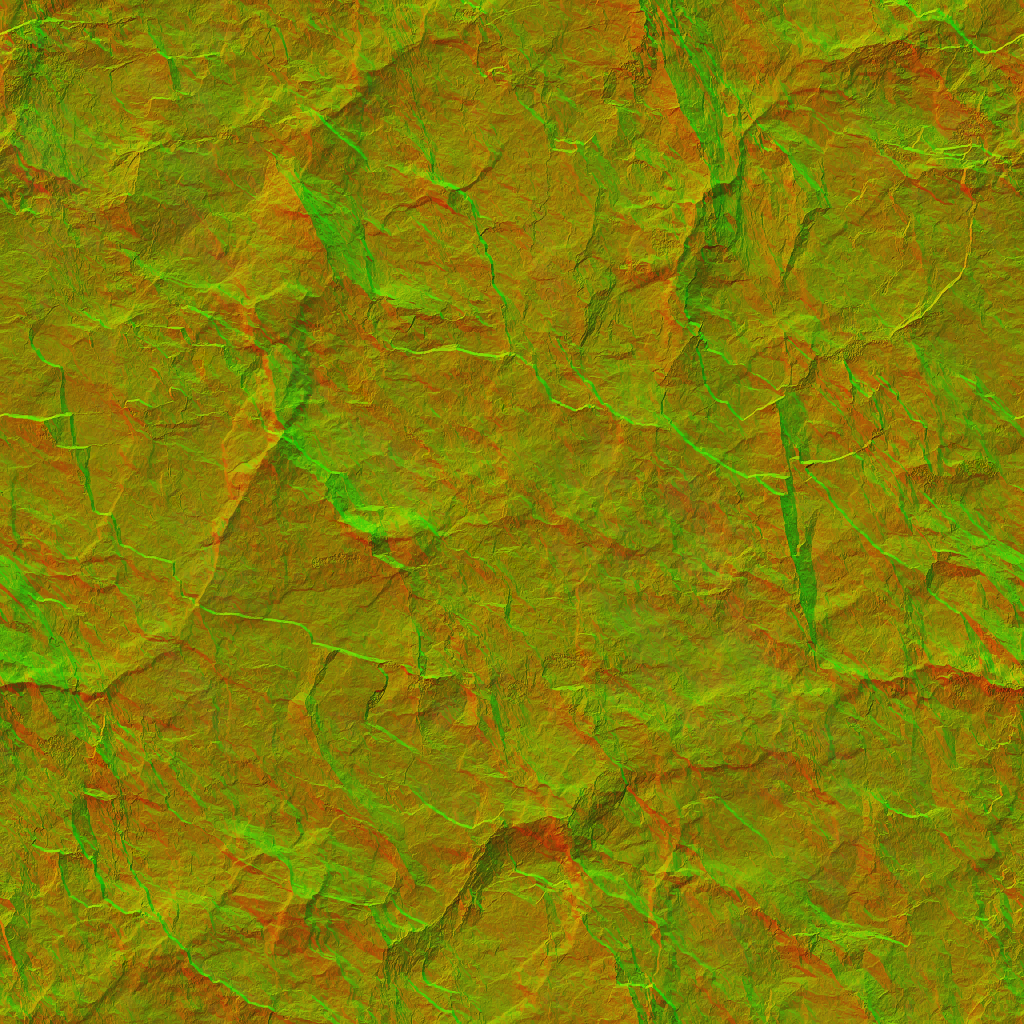
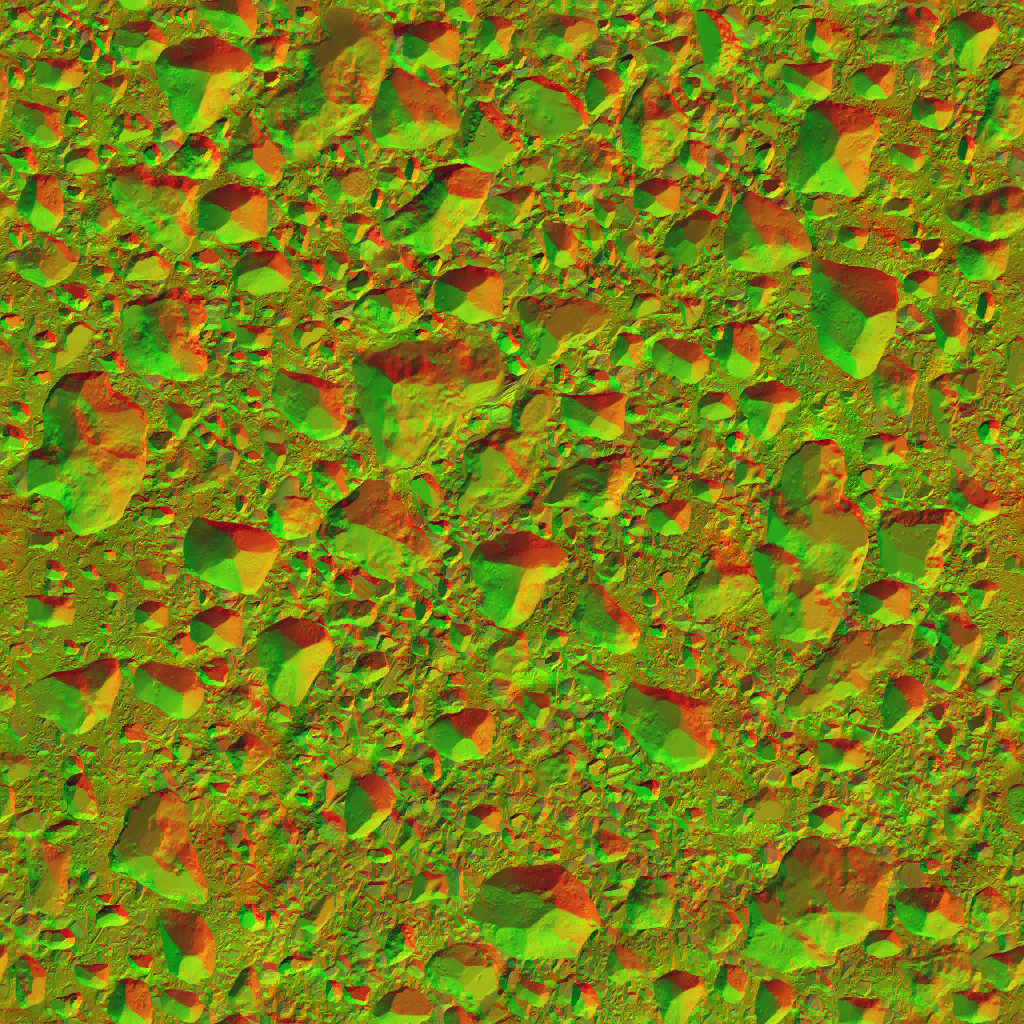
Elden Ring’s Vertex Description – Most Meshes (Stone, Rocks, Buildings,…etc.)
POSITION   R32G32B32_FLOAT          0
NORMAL     R8G8B8A8_UINT            12
TANGENT    R8G8B8A8_UINT            16
COLOR      R8G8B8A8_UNORM           20
TEXCOORD0  R16G16_SINT              24
TEXCOORD1  R8G8B8A8_UNORM           28    //optional, mostly for big meshes
Elden Ring’s Vertex Description – Skinned Meshes (Characters, Enemies, Env Animals,….etc.)
POSITION        R32G32B32_FLOAT          0
NORMAL          R8G8B8A8_UINT            12
TANGENT         R8G8B8A8_UINT            16
BLENDINDICES    R8G8B8A8_UINT            20
BLENDWEIGHT     R8G8B8A8_UNORM           24
COLOR           R8G8B8A8_UNORM           28
TEXCOORD0       R16G16B16A16_SINT        32
Elden Ring’s Vertex Description – Skinned Meshes (Cloth)
POSITION        R32G32B32_FLOAT          0
NORMAL          R8G8B8A8_UINT            12
TANGENT         R8G8B8A8_UINT            16
TANGENT         R8G8B8A8_UINT            20
BLENDINDICES    R8G8B8A8_UINT            24
BLENDWEIGHT     R8G8B8A8_UNORM           28
COLOR           R8G8B8A8_UNORM           32
TEXCOORD0       R16G16B16A16_SINT        36
TEXCOORD1       R8G8B8A8_UNORM           44
TEXCOORD2       R8G8B8A8_UNORM           48
TEXCOORD3       R8G8B8A8_UNORM           52
Elden Ring’s Vertex Description – Skinned Meshes (Cloth under Cloth)
POSITION        R32G32B32_FLOAT          0
NORMAL          R8G8B8A8_UINT            12
TANGENT         R8G8B8A8_UINT            16
BINORMAL        R8G8B8A8_UINT            0
BLENDINDICES    R8G8B8A8_UINT            4
BLENDWEIGHT     R8G8B8A8_UNORM           8
COLOR           R8G8B8A8_UNORM           12
TEXCOORD0       R16G16B16A16_SINT        16
POSITION        R32G32B32_FLOAT          0
NORMAL          R8G8B8A8_UINT            12
TANGENT         R8G8B8A8_UINT            16
Elden Ring’s Vertex Description – Foliage Meshes
POSITION   R32G32B32_FLOAT          0
NORMAL     R8G8B8A8_UINT            12
TANGENT    R8G8B8A8_UINT            16
COLOR      R8G8B8A8_UNORM           20
TEXCOORD0  R16G16_SINT              24
TEXCOORD1  R8G8B8A8_UNORM           28
TEXCOORD2  R8G8B8A8_UNORM           32
TEXCOORD3  R16G16B16A16_FLOAT       36
Elden Ring’s Vertex Description – Some Stones
POSITION   R32G32B32_FLOAT          0
NORMAL     R8G8B8A8_UINT            12
TANGENT    R8G8B8A8_UINT            16
TANGENT    R8G8B8A8_UINT            20
COLOR      R8G8B8A8_UNORM           24
TEXCOORD0  R16G16B16A16_SINT        28
Elden Ring’s Vertex Description – Some Instancing (SpeedTree)
POSITION   R32G32B32A32_FLOAT          0
TEXCOORD0  R32G32B32A32_FLOAT          16
TEXCOORD1  R32G32B32A32_FLOAT          32
TEXCOORD2  R16G16B16A16_FLOAT          0
TEXCOORD3  R16G16B16A16_FLOAT          8
TEXCOORD4  R16G16B16A16_FLOAT          16
TEXCOORD5  R16G16B16A16_FLOAT          24
TEXCOORD6  R16G16B16A16_FLOAT          32
TEXCOORD7  R16G16_FLOAT                40     //Optional
TEXCOORD8  R8G8B8A8_UNORM              44     //Optional
TEXCOORD9  R8G8B8A8_UNORM              48     //Optional
Elden Ring’s Vertex Description – Some Meshes (Only used during shadow pass)
POSITION   R32G32B32_FLOAT          0
NORMAL     R8G8B8A8_UINT            12
TANGENT    R8G8B8A8_UINT            16
COLOR      R8G8B8A8_UNORM           20
COLOR      R8G8B8A8_UNORM           24
TEXCOORD0  R16G16_SINT              28
TEXCOORD1  R8G8B8A8_UNORM           32
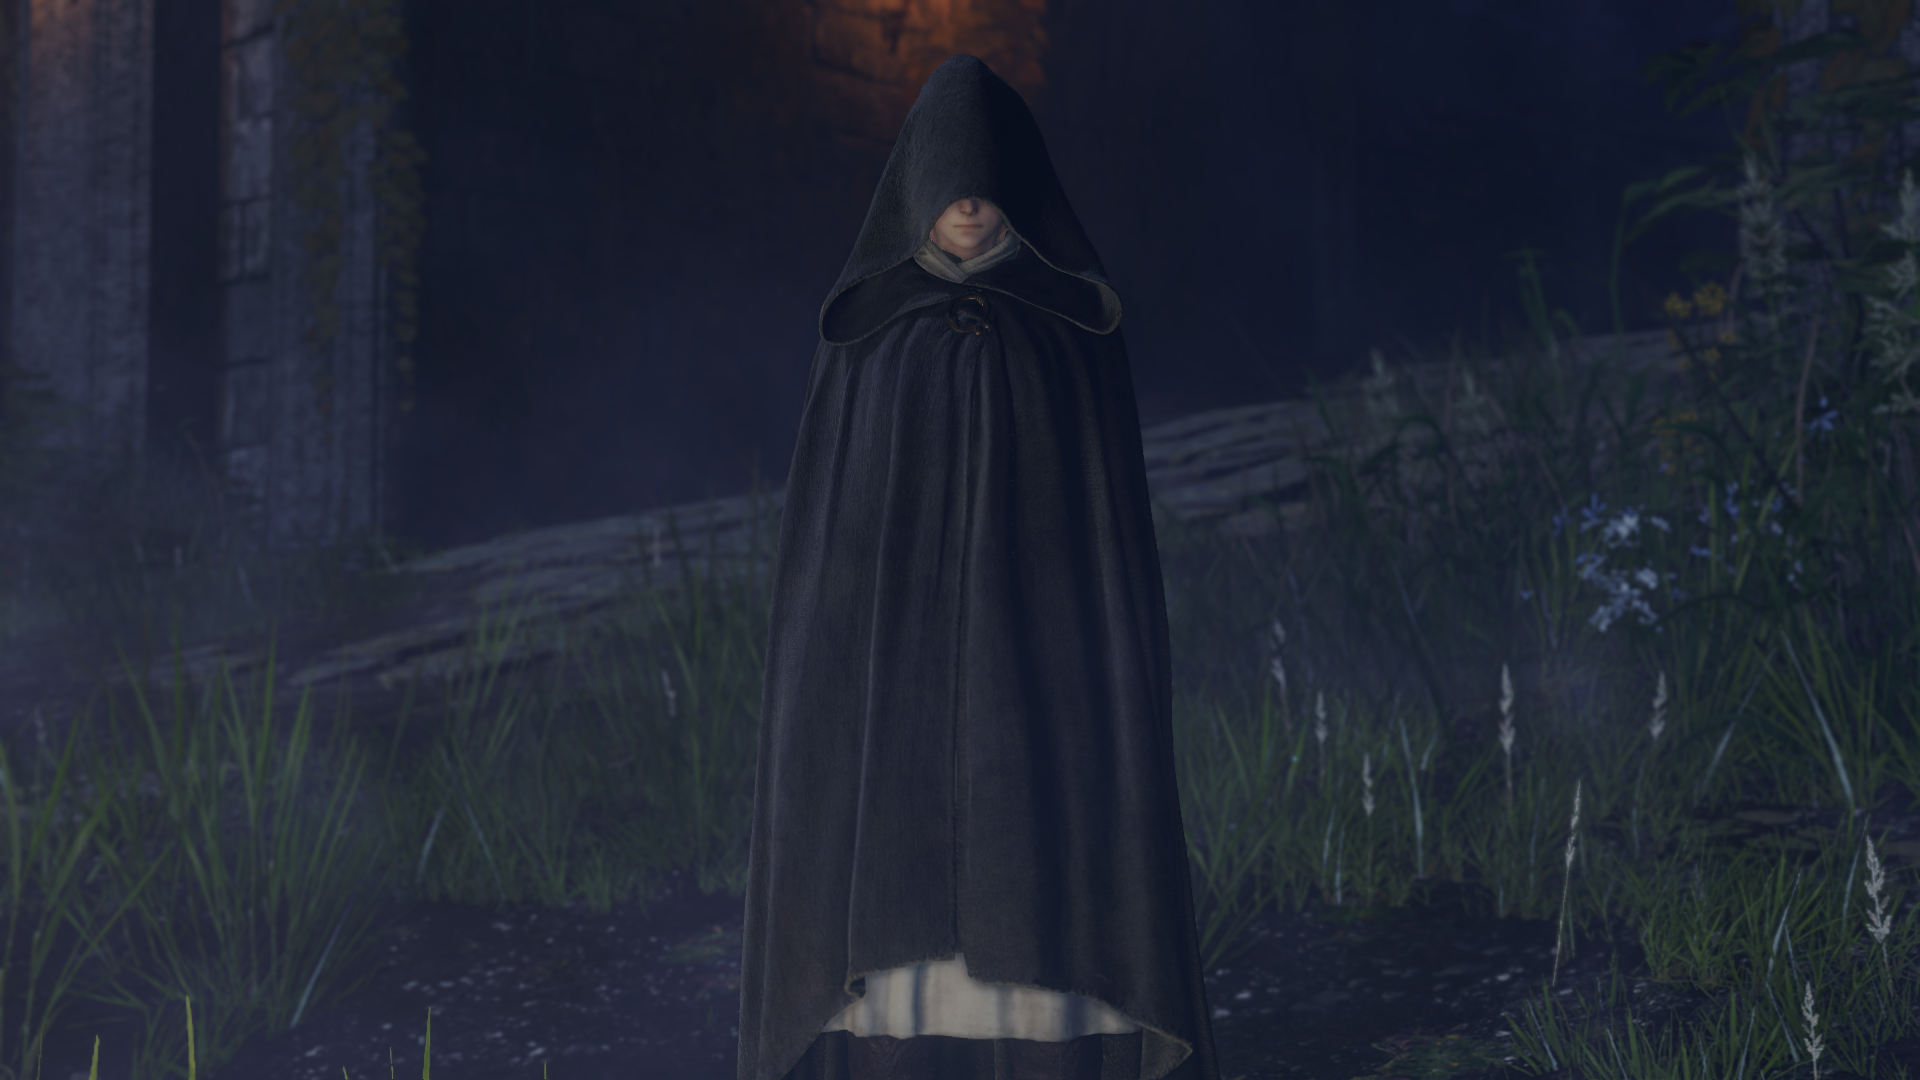
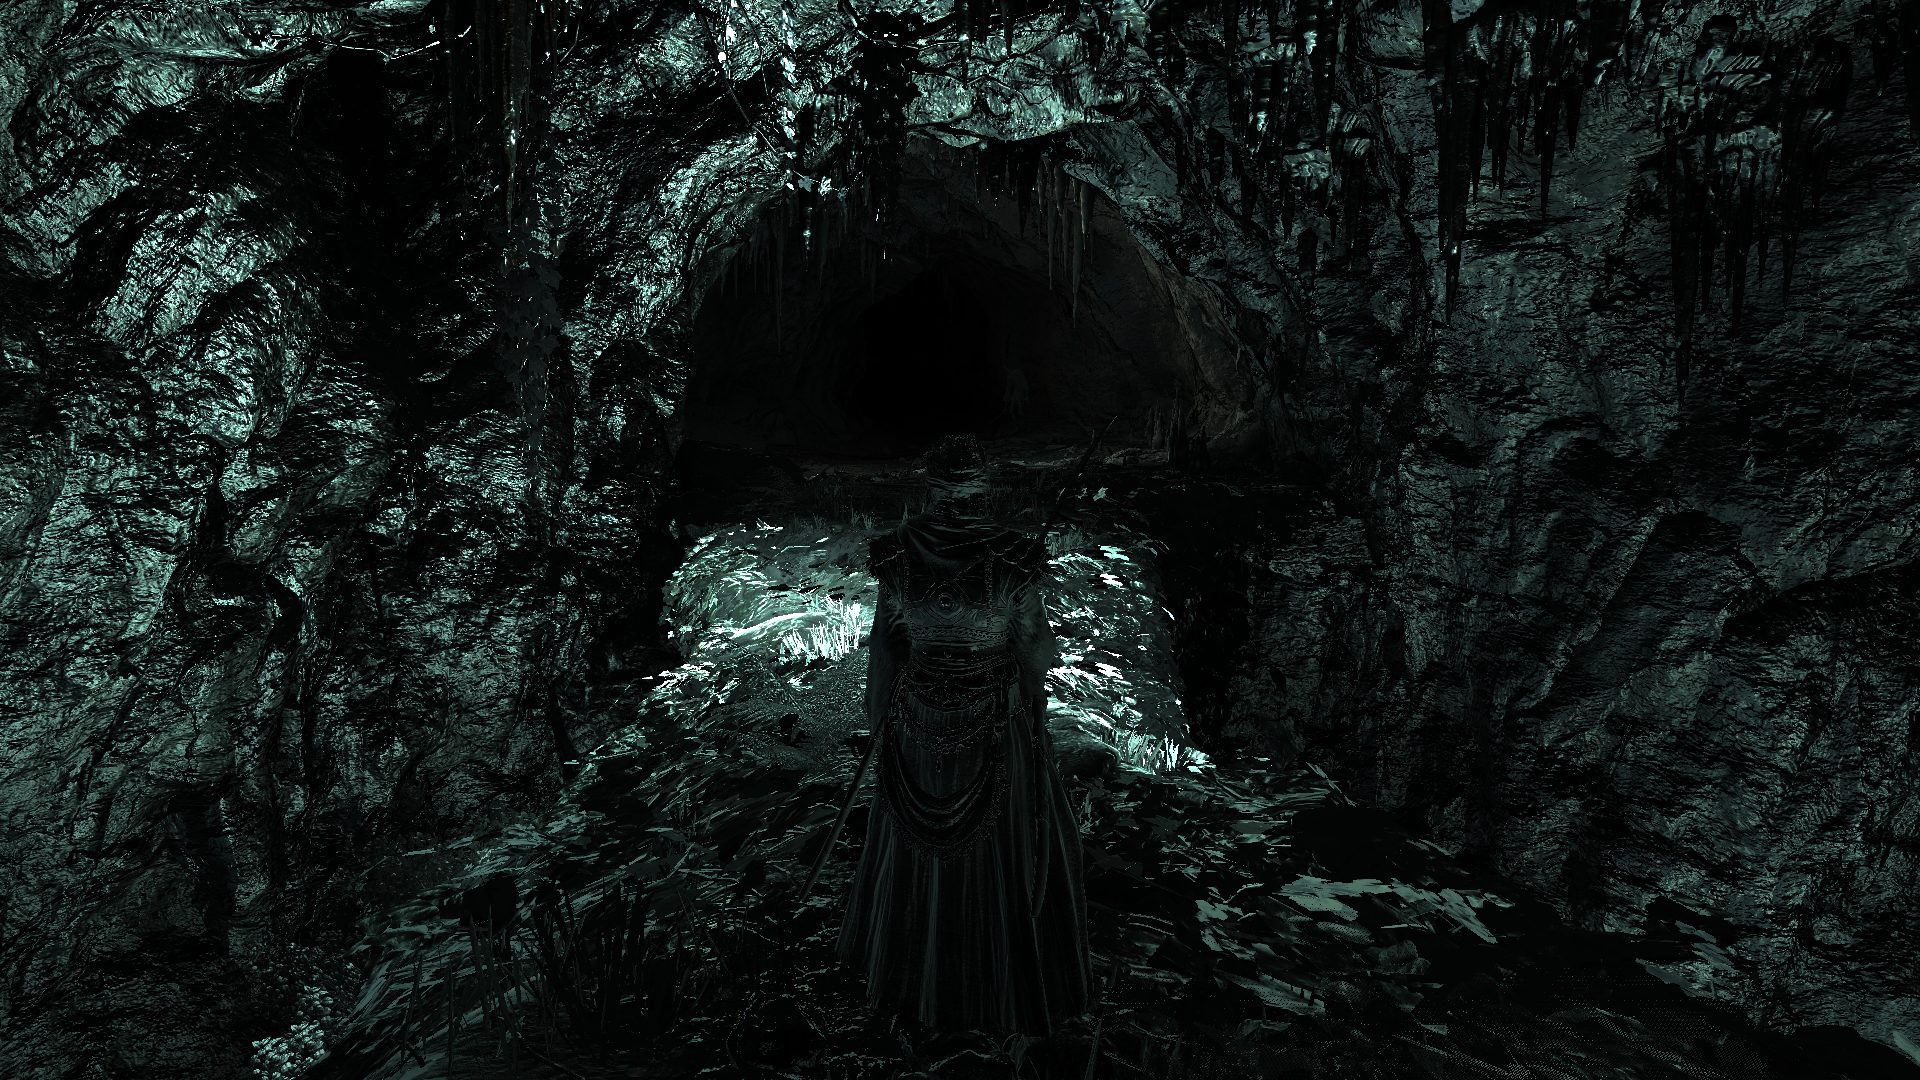
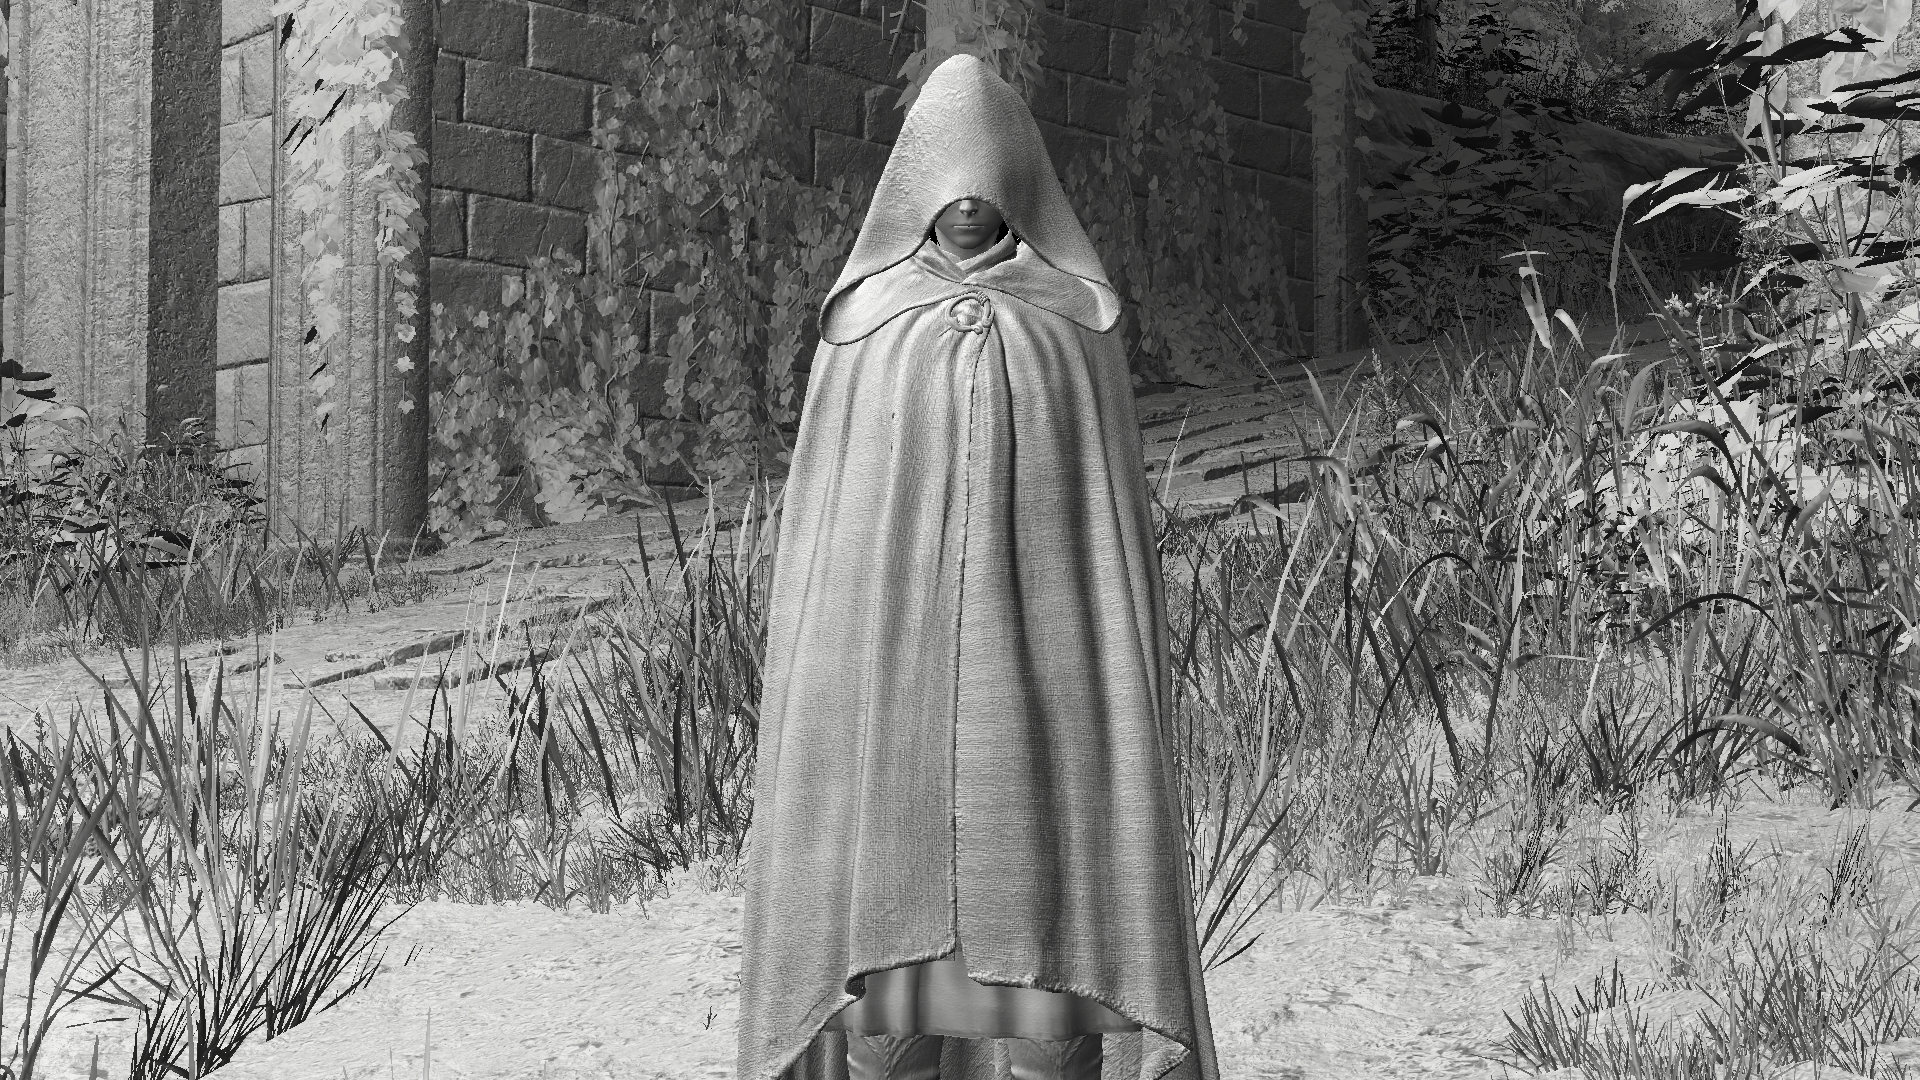
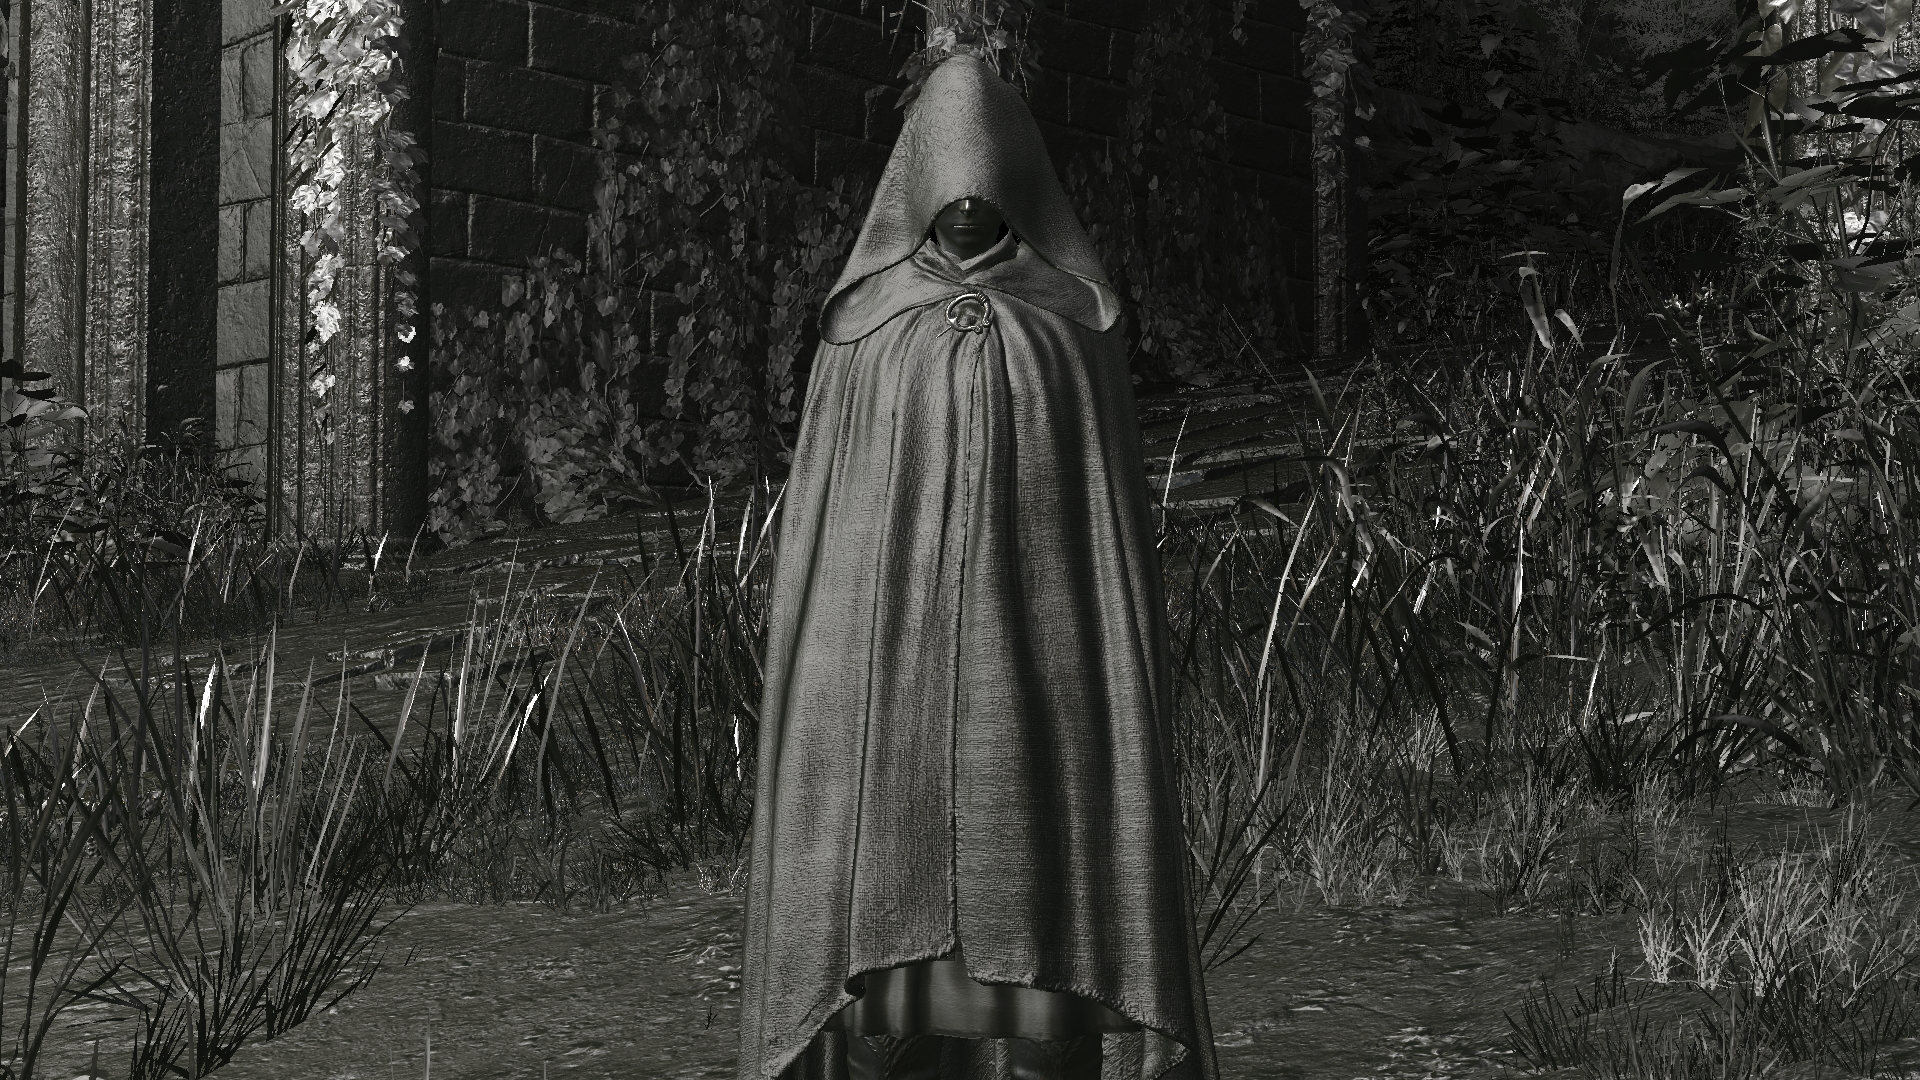
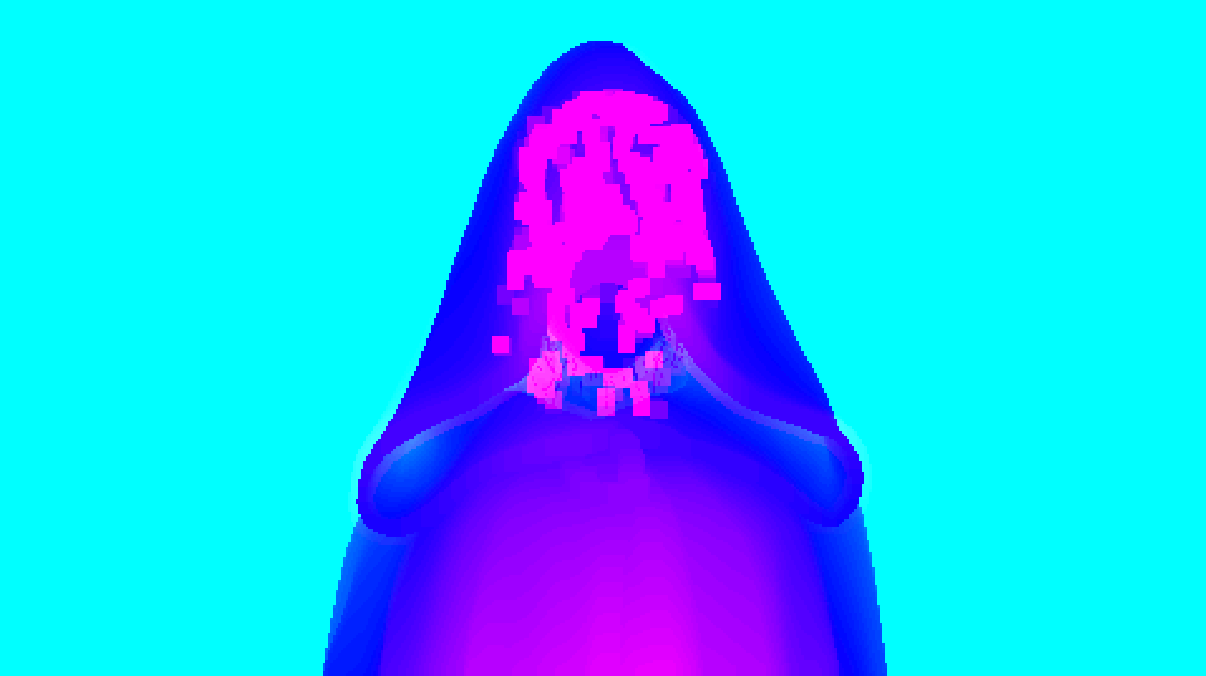
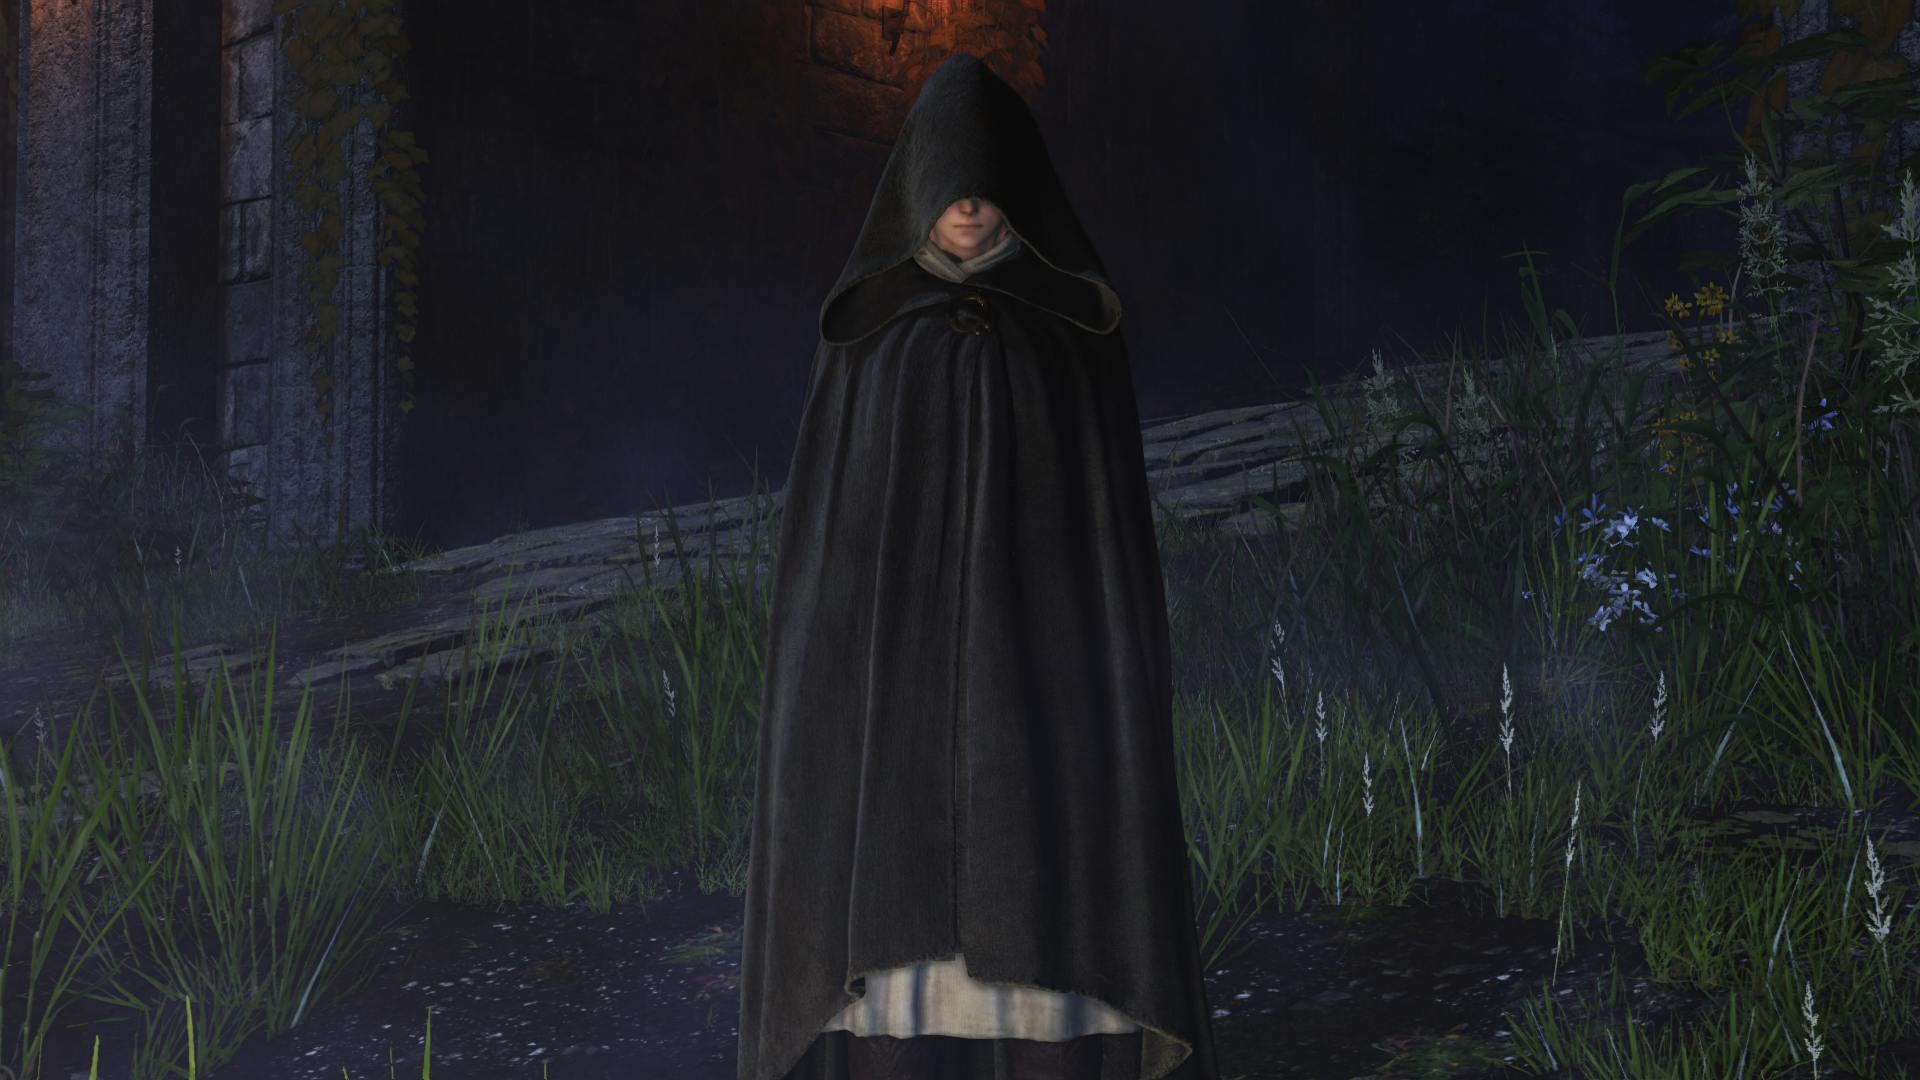
Over the years, i learned to like and to practice specialized things, things such as vertex descriptions, but not too much specialized like that!! If you think for example Cloth vertex descriptions variations ended here, you’re wrong, there are couple of more variations for cloth mesh descriptions, one of them (if i would call it) is for cloth under cloth that is already under cloth! You can observe those layers of clothing and armoring easily in the game, specially in cinematics…Melina is the best test case to observe!
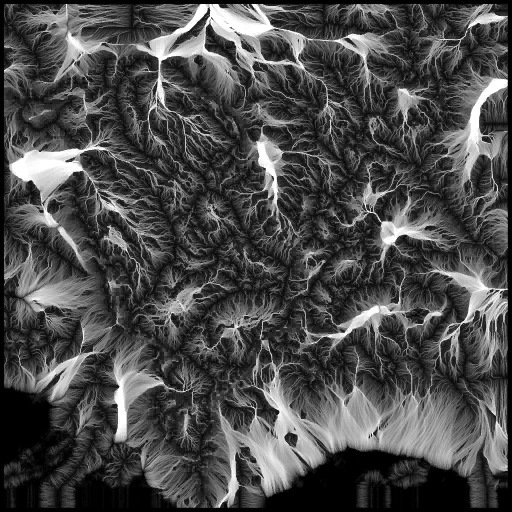
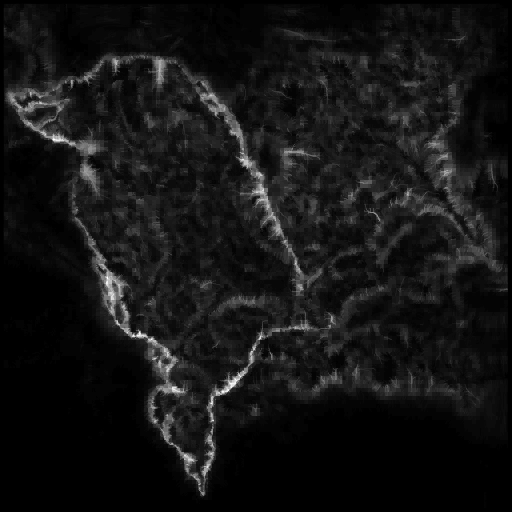
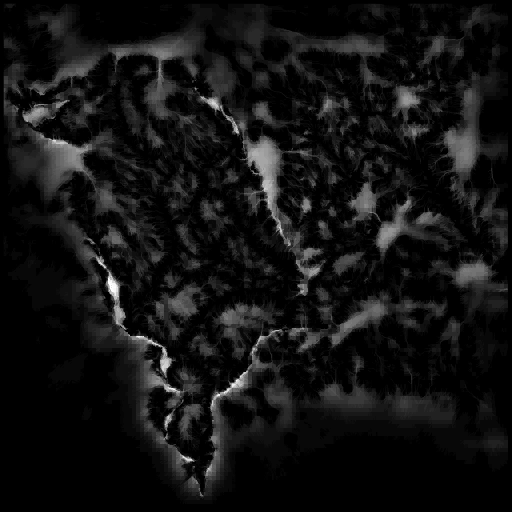
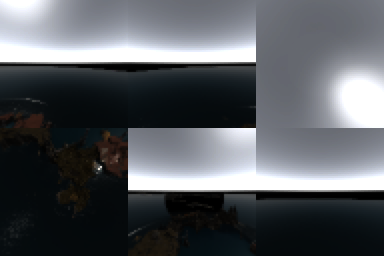
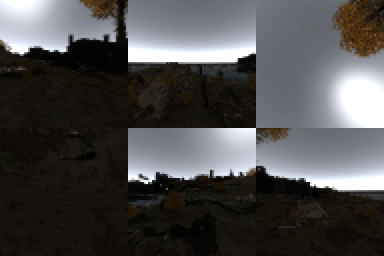
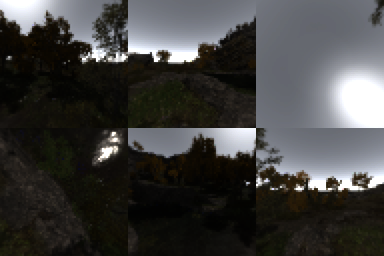
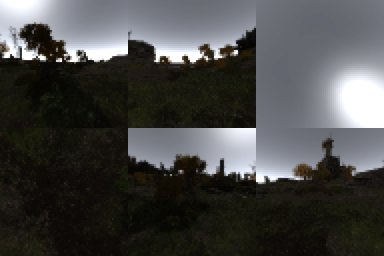
Direct Light CSM
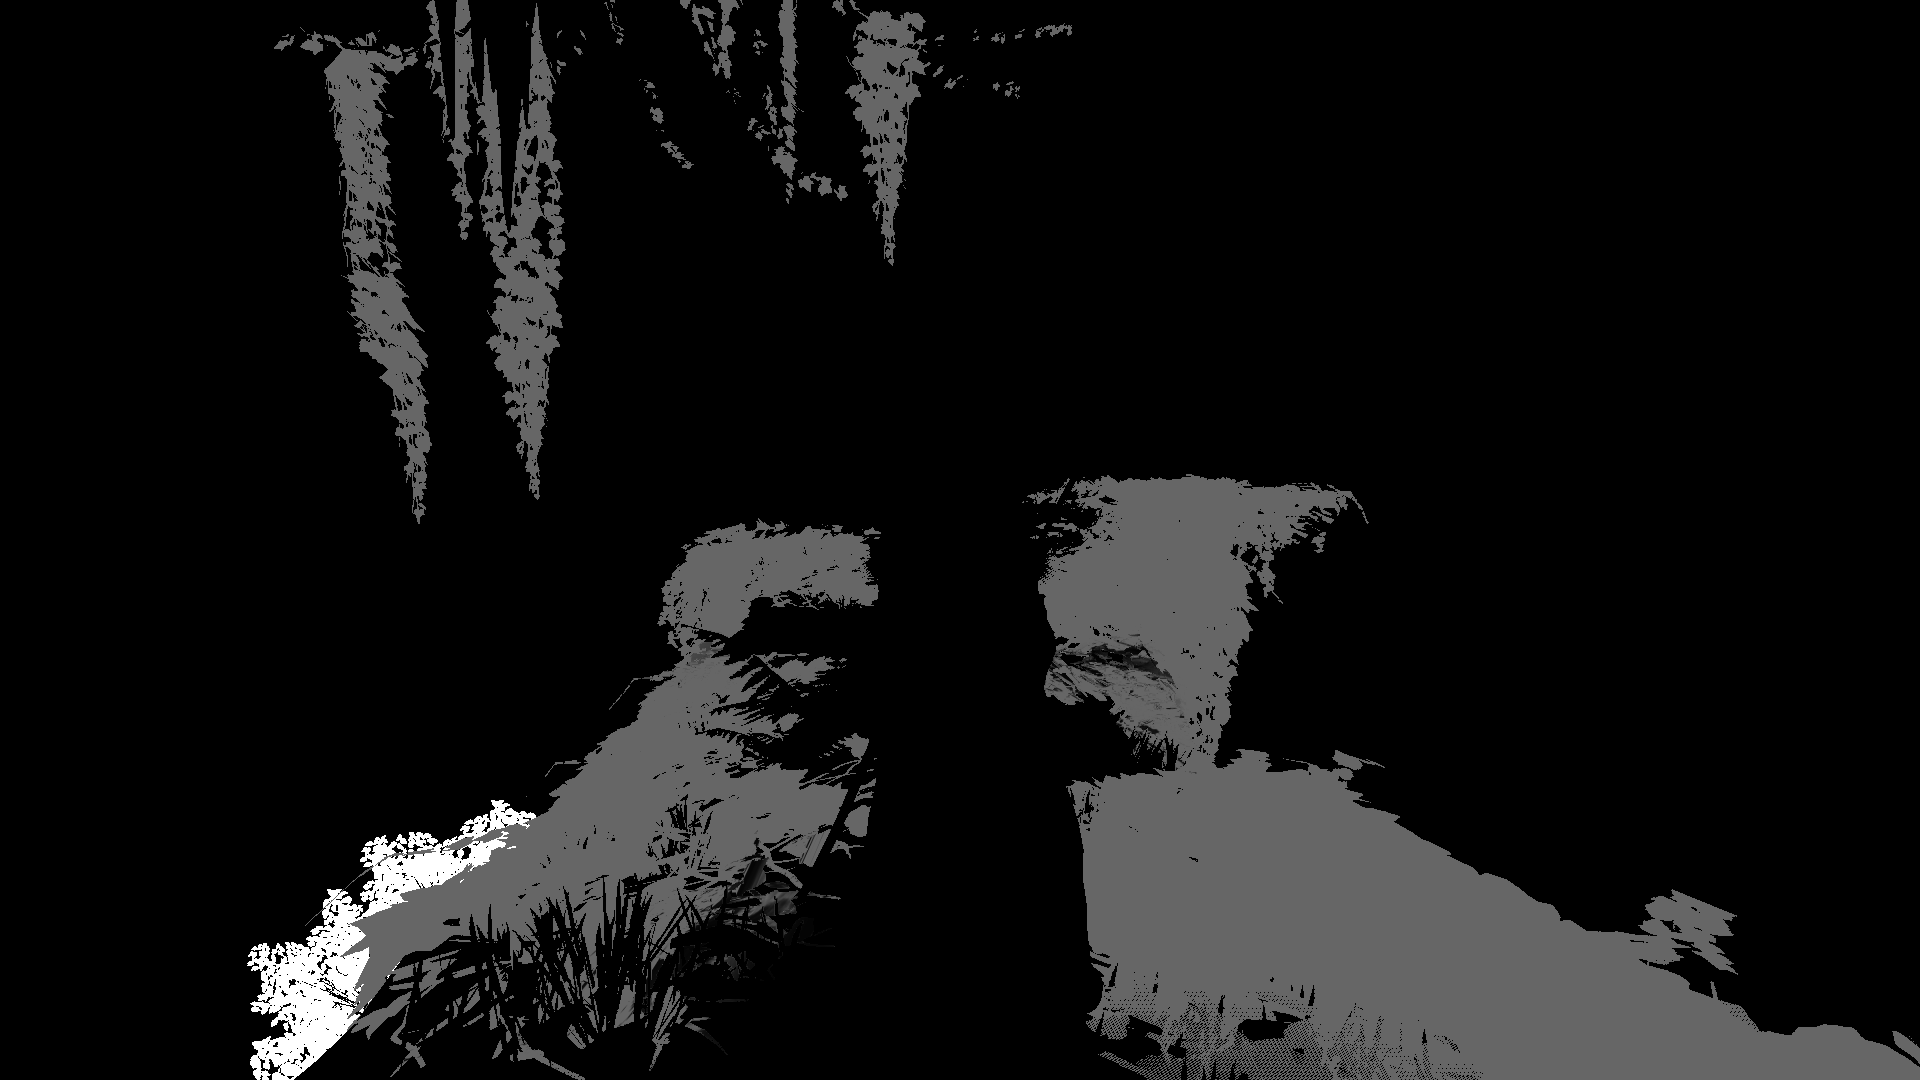
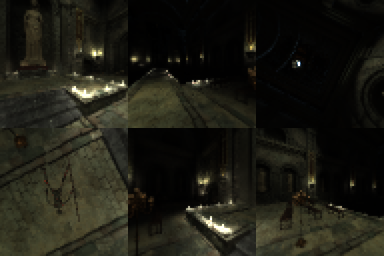
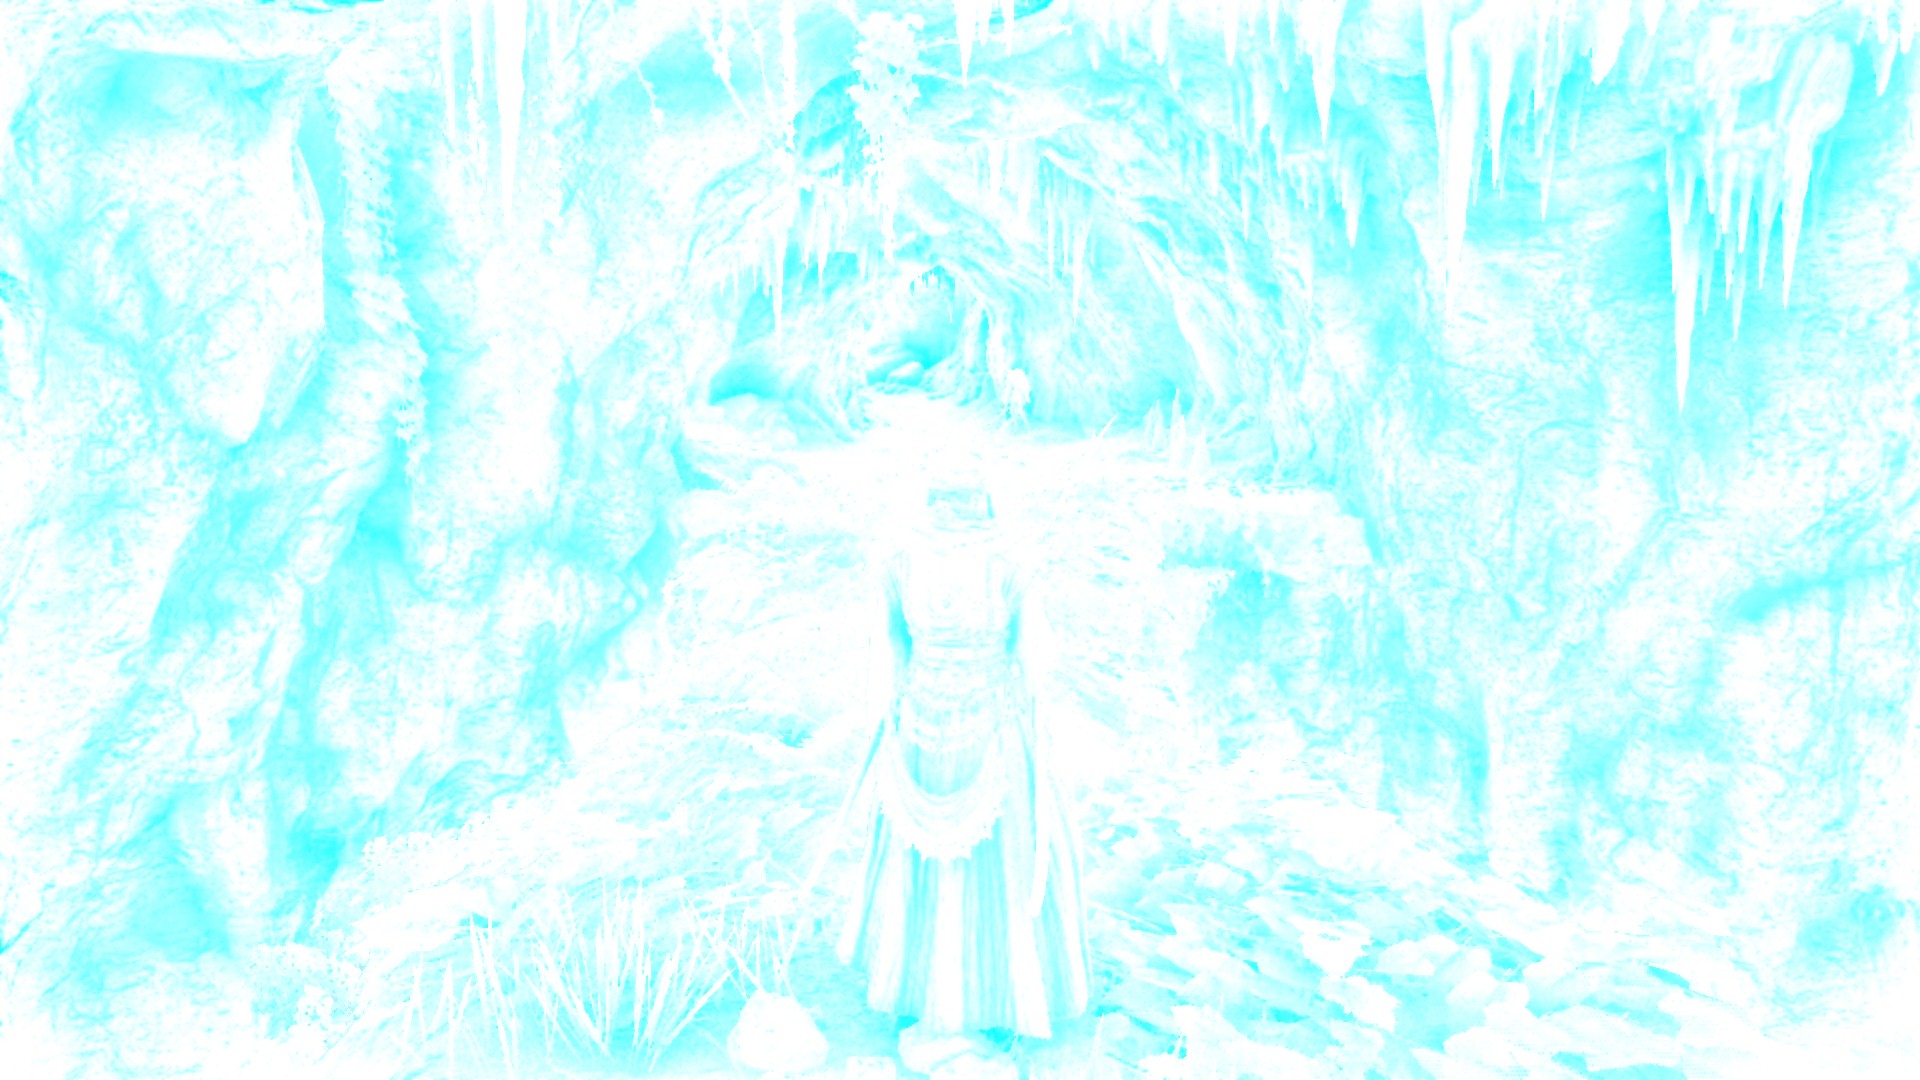
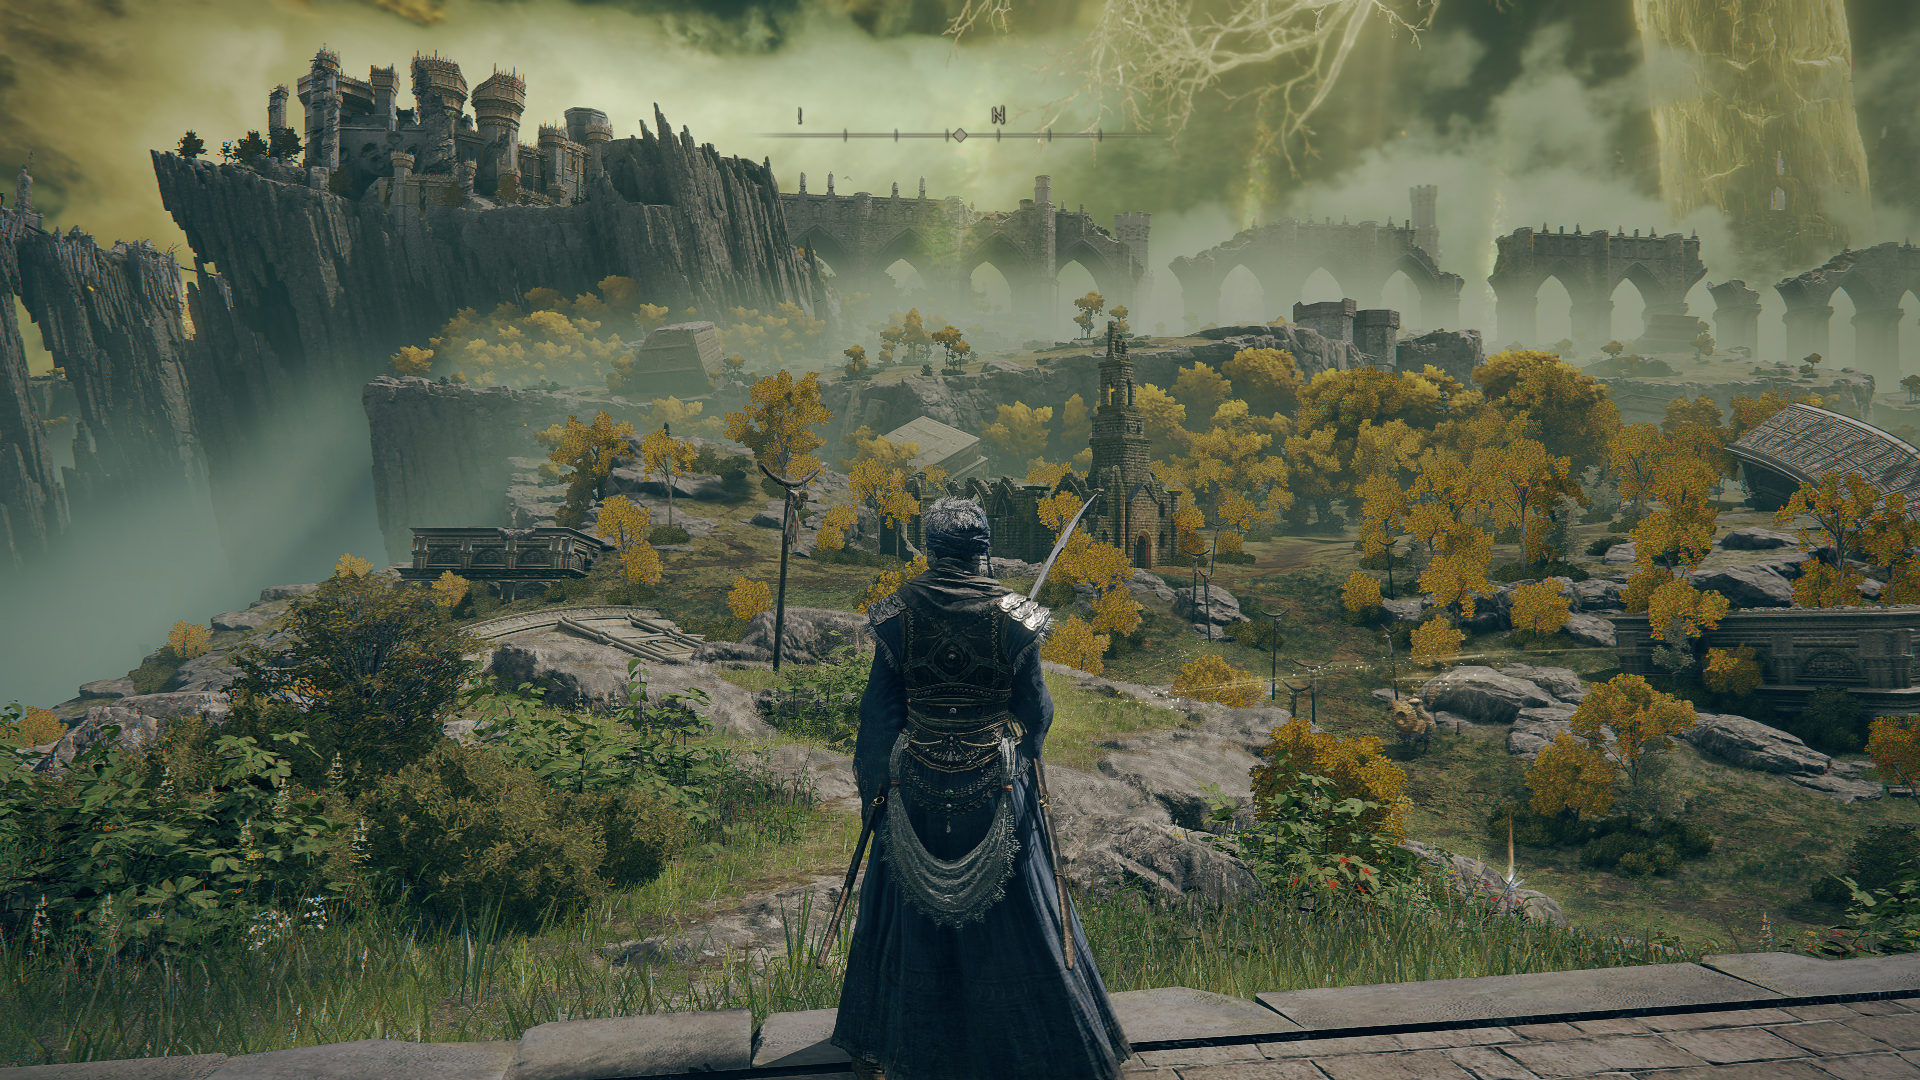
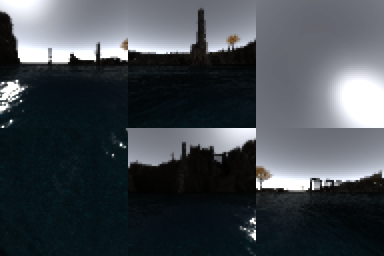
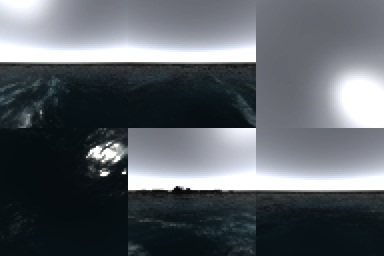
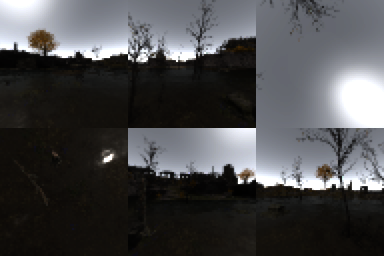
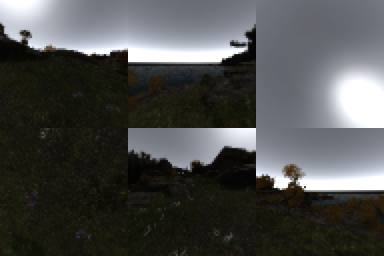
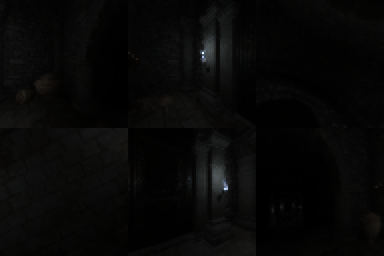
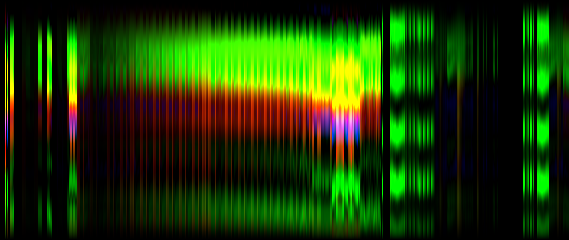
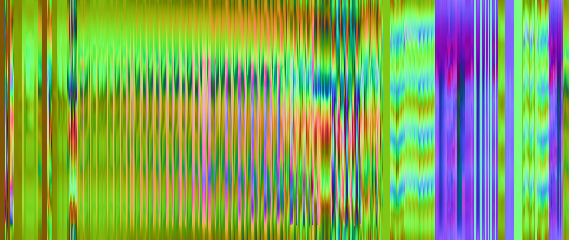
Few of depth only early passes for directional/direct light (sunlight) aka Shadow Map Cascades. It starts from at least 6 Depth only passes up to 14 (there might be more, but that was the maximum i found in my captures) it depends on the amount of details (objects/meshes count per frame), so you can have 6 or 8 passes for a dungeon frame while you can have 14 (maybe more) passes when are in the open world above the ground. Those are all ending up with total of 5 cascades that are stored always as 8192*4096 of the format R16_TYPELESS….Always! Even when you’re inside a dungeon under the ground, still present & with the same size…Consistency is good,…sometimes!
Few examples below, with boosted versions to show more details at the 3rd row.


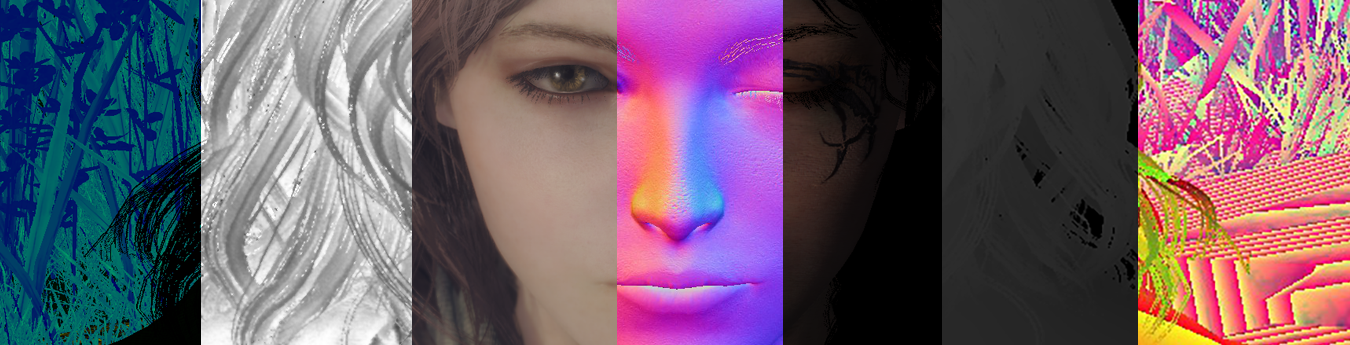
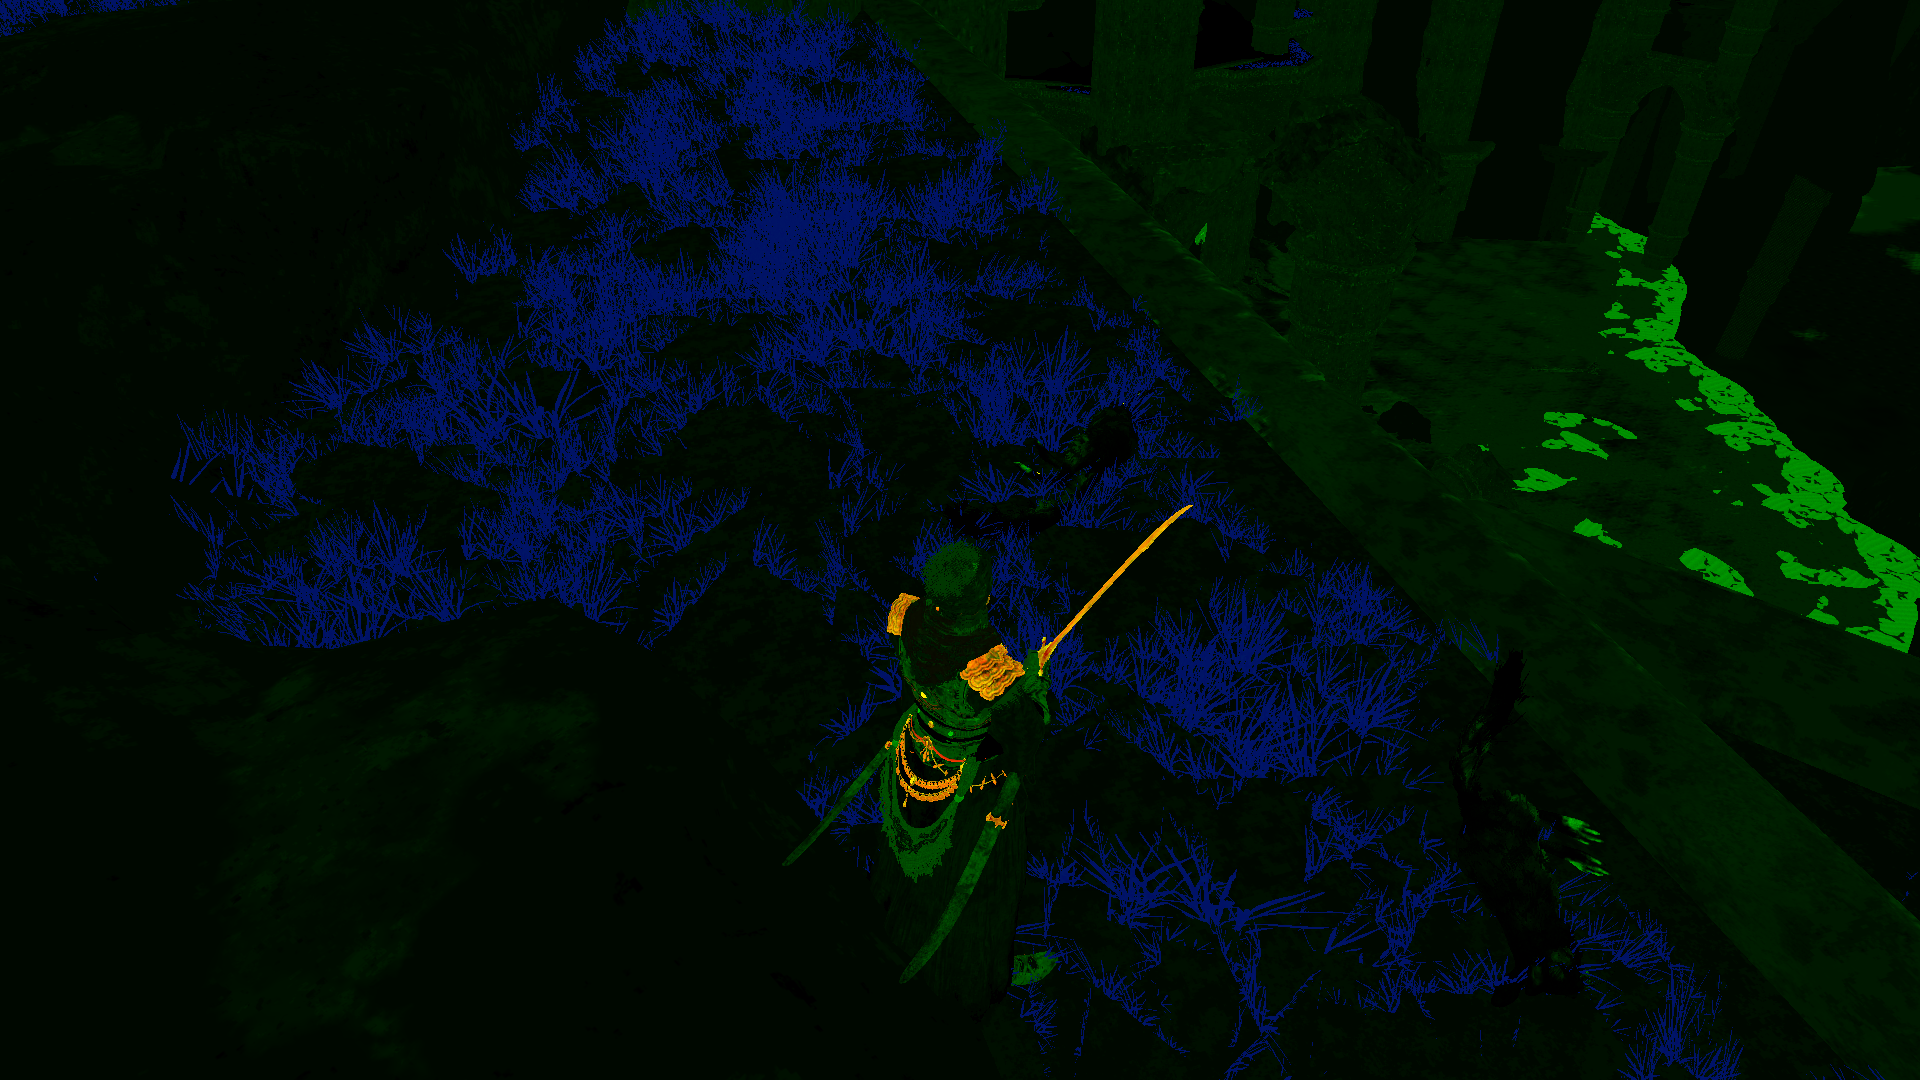
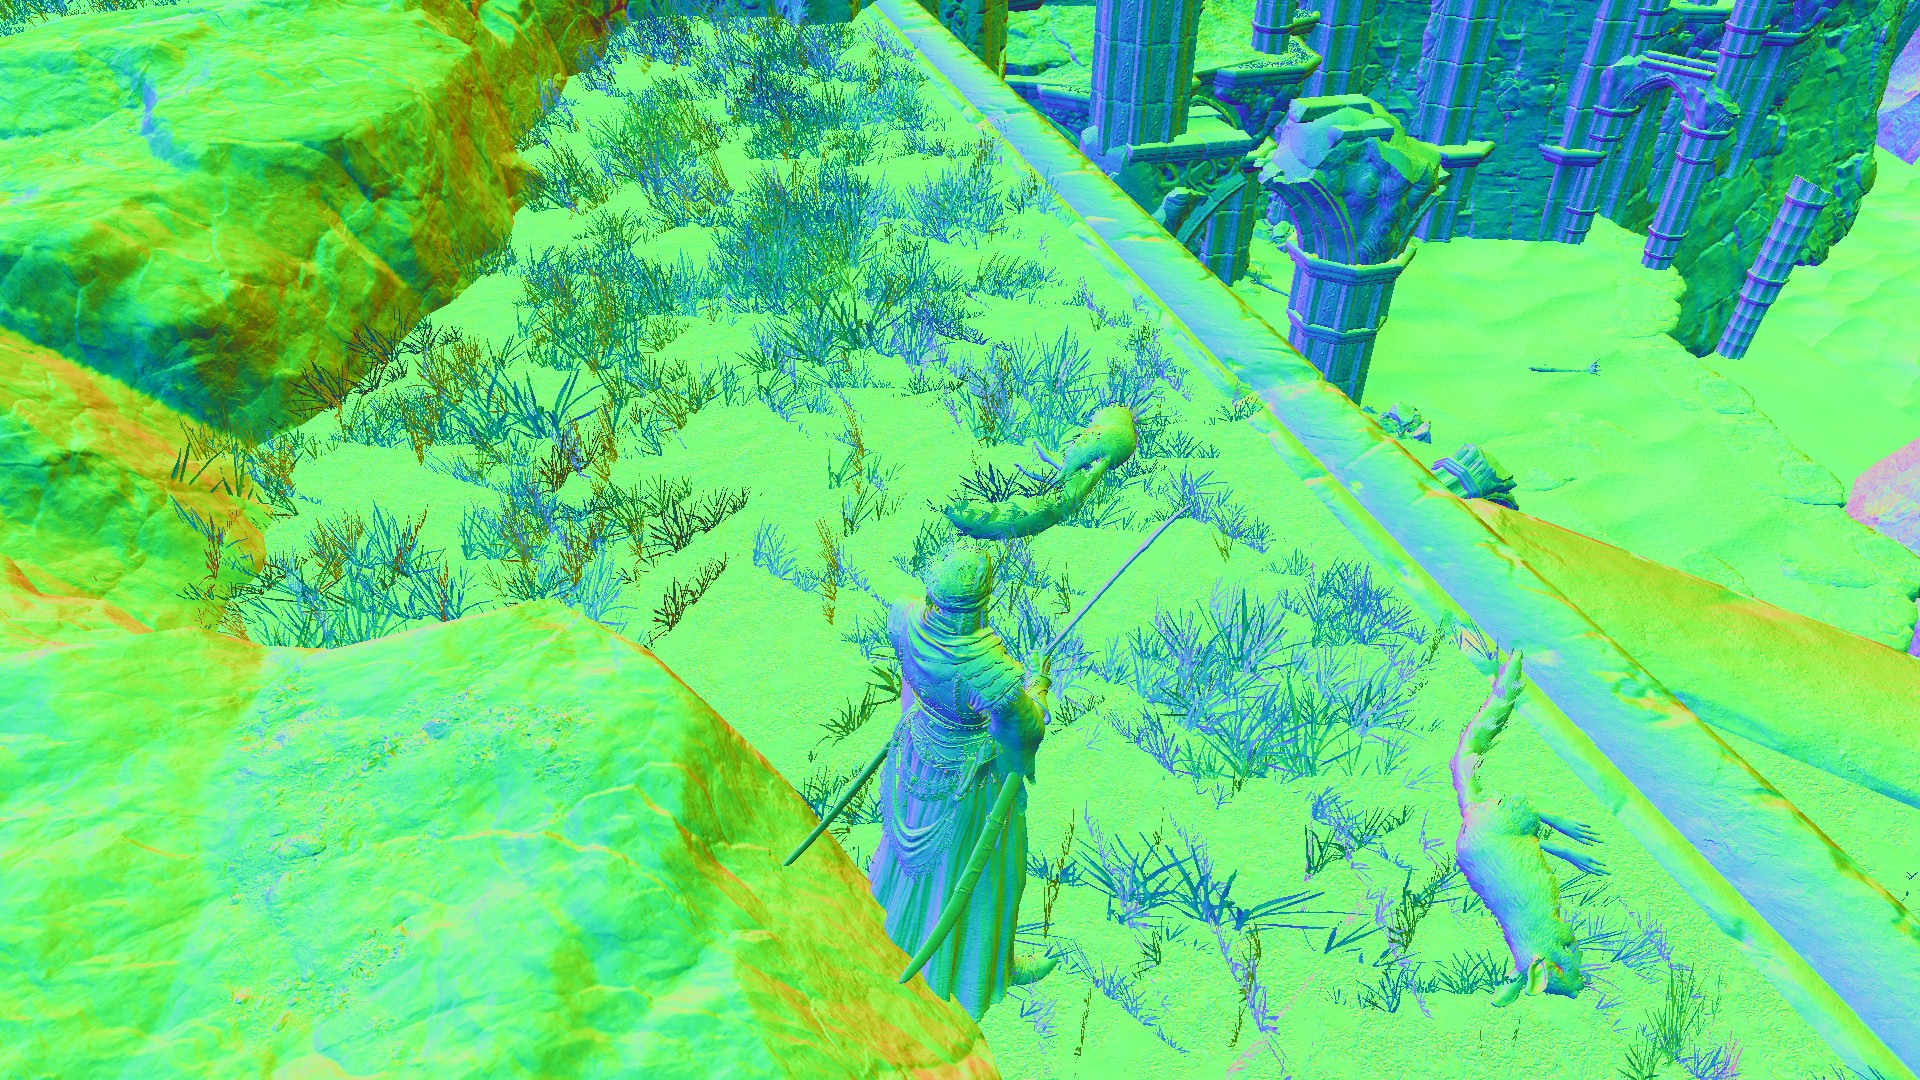
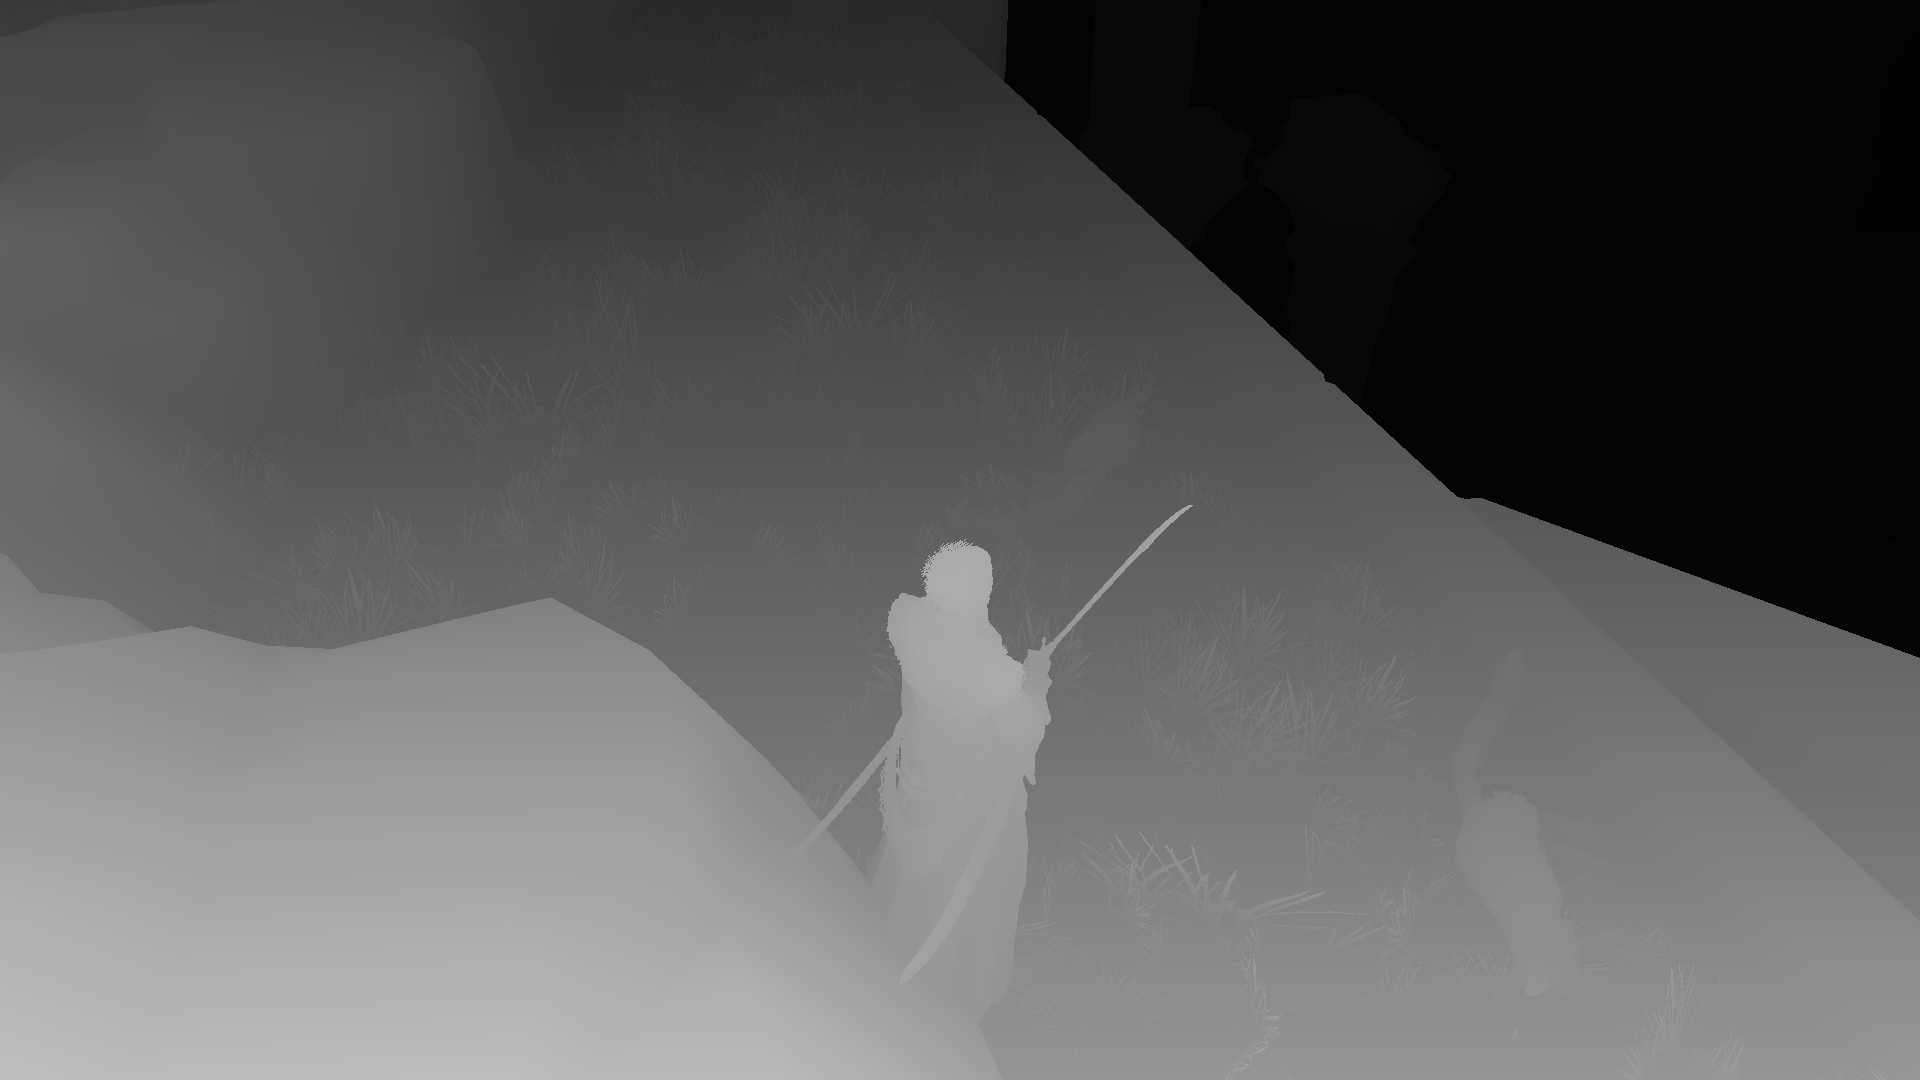
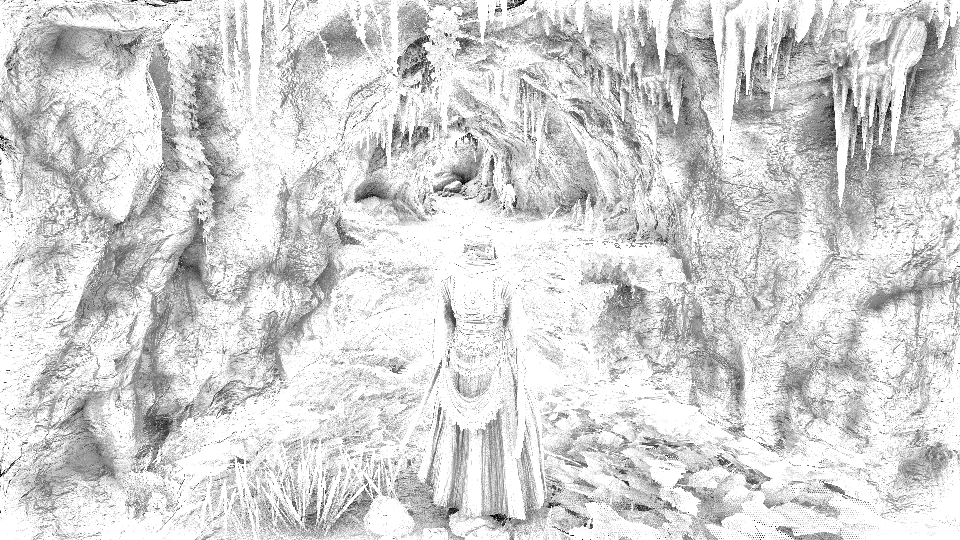
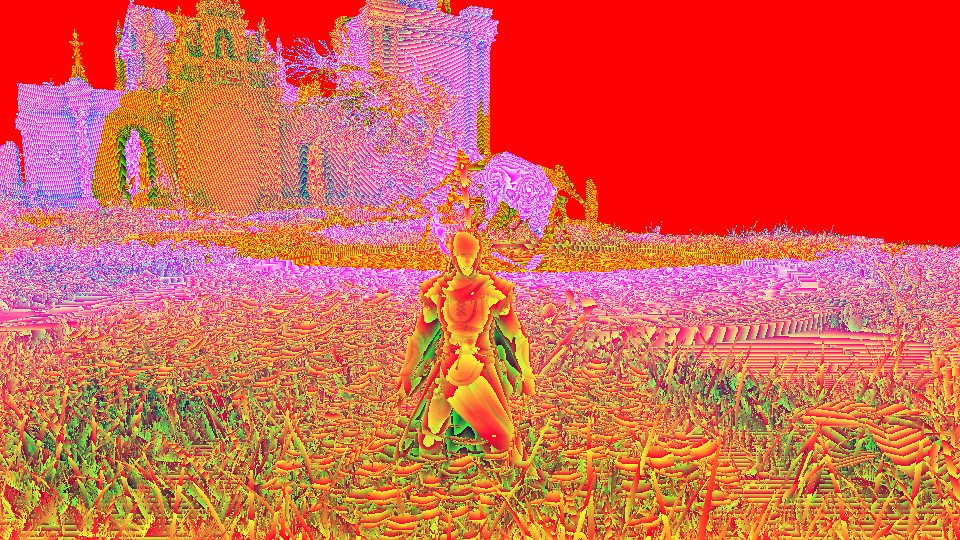
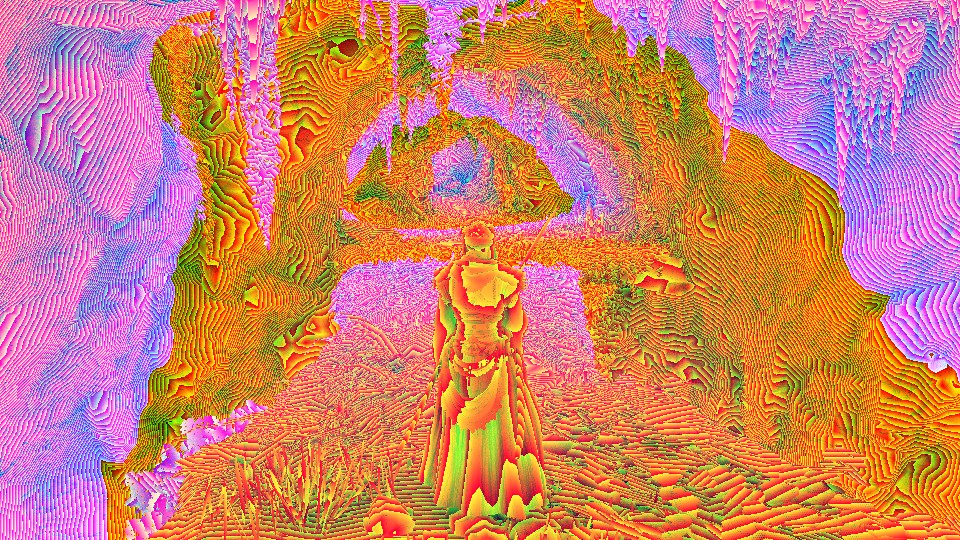
Color Passes [GBuffer/Deferred]
As the game is rendering in deferred shading, at this step there will be a sequential set of deferred passed to produce the final GBuffer render targets. Those passes can vary in their total count (duration) based on the number of elements to draw. Where in cave or cinematic we can have 8-12 passes of drawing, in a big open area it can go beyond 20 passes. Eventually we end up with usual GBuffer, nothing out of the ordinary at this point.
For the surface definition render target, those are the separate channels. Where one is metallic, and the other is roughness, but 3rd is quite “unexpected”…It’s for shadows (using it later in few steps below).

And in action, here are some timelapse for the GBuffer targets.


It’s worth mentioning that there are usually 2 floating render targets in the GBuffer that do NOTHING, they are fully black, in one pass you have all the major render targets + those two, and in another pass you have these 2 are holding some of the major render target values, where the render targets themselves are black. it’s random and there is not exact predictable pattern for that as far as i can tell.
And of course, some frames/areas would have a values in a dedicated Render Target for Emissive, that previous frame have almost 0 emissive & the RT is black, but for example that given frame below is a good example of a useful emissive render target accompanying the GBuffer.
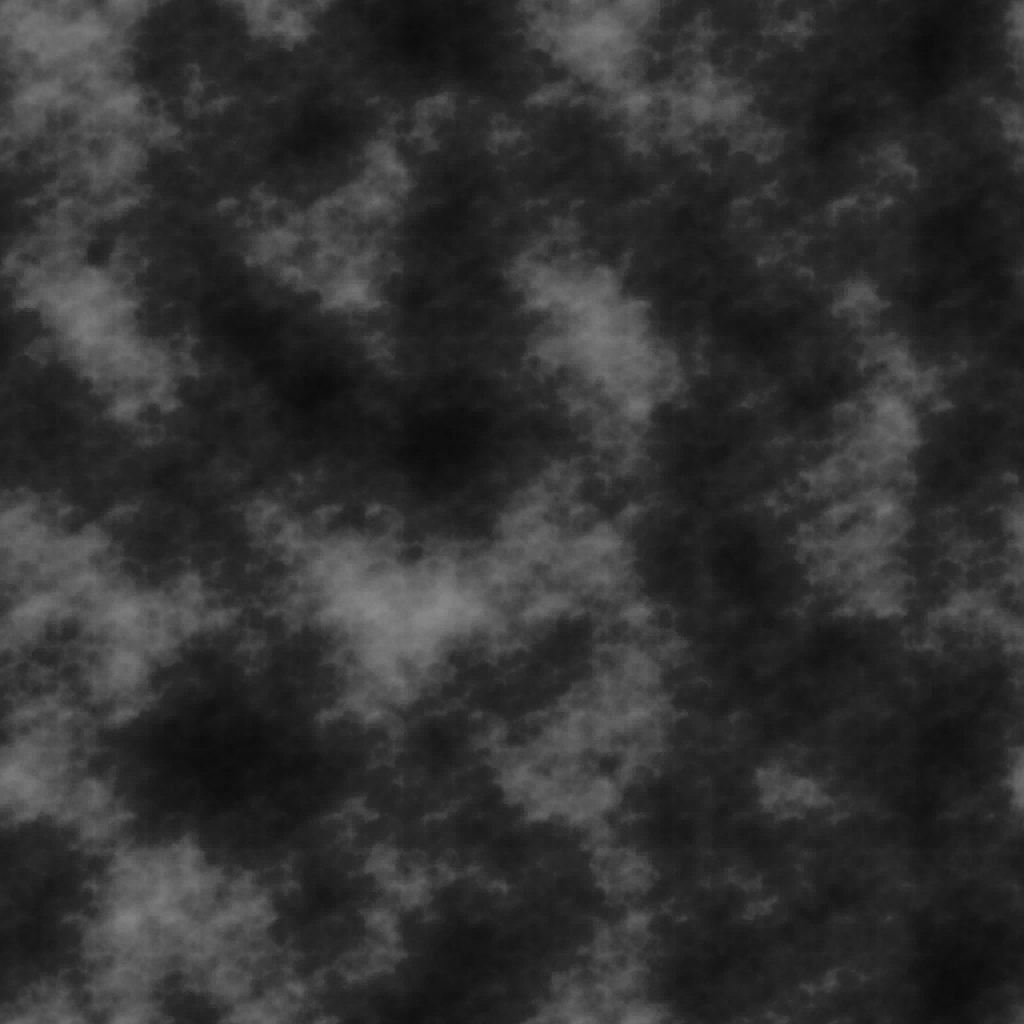
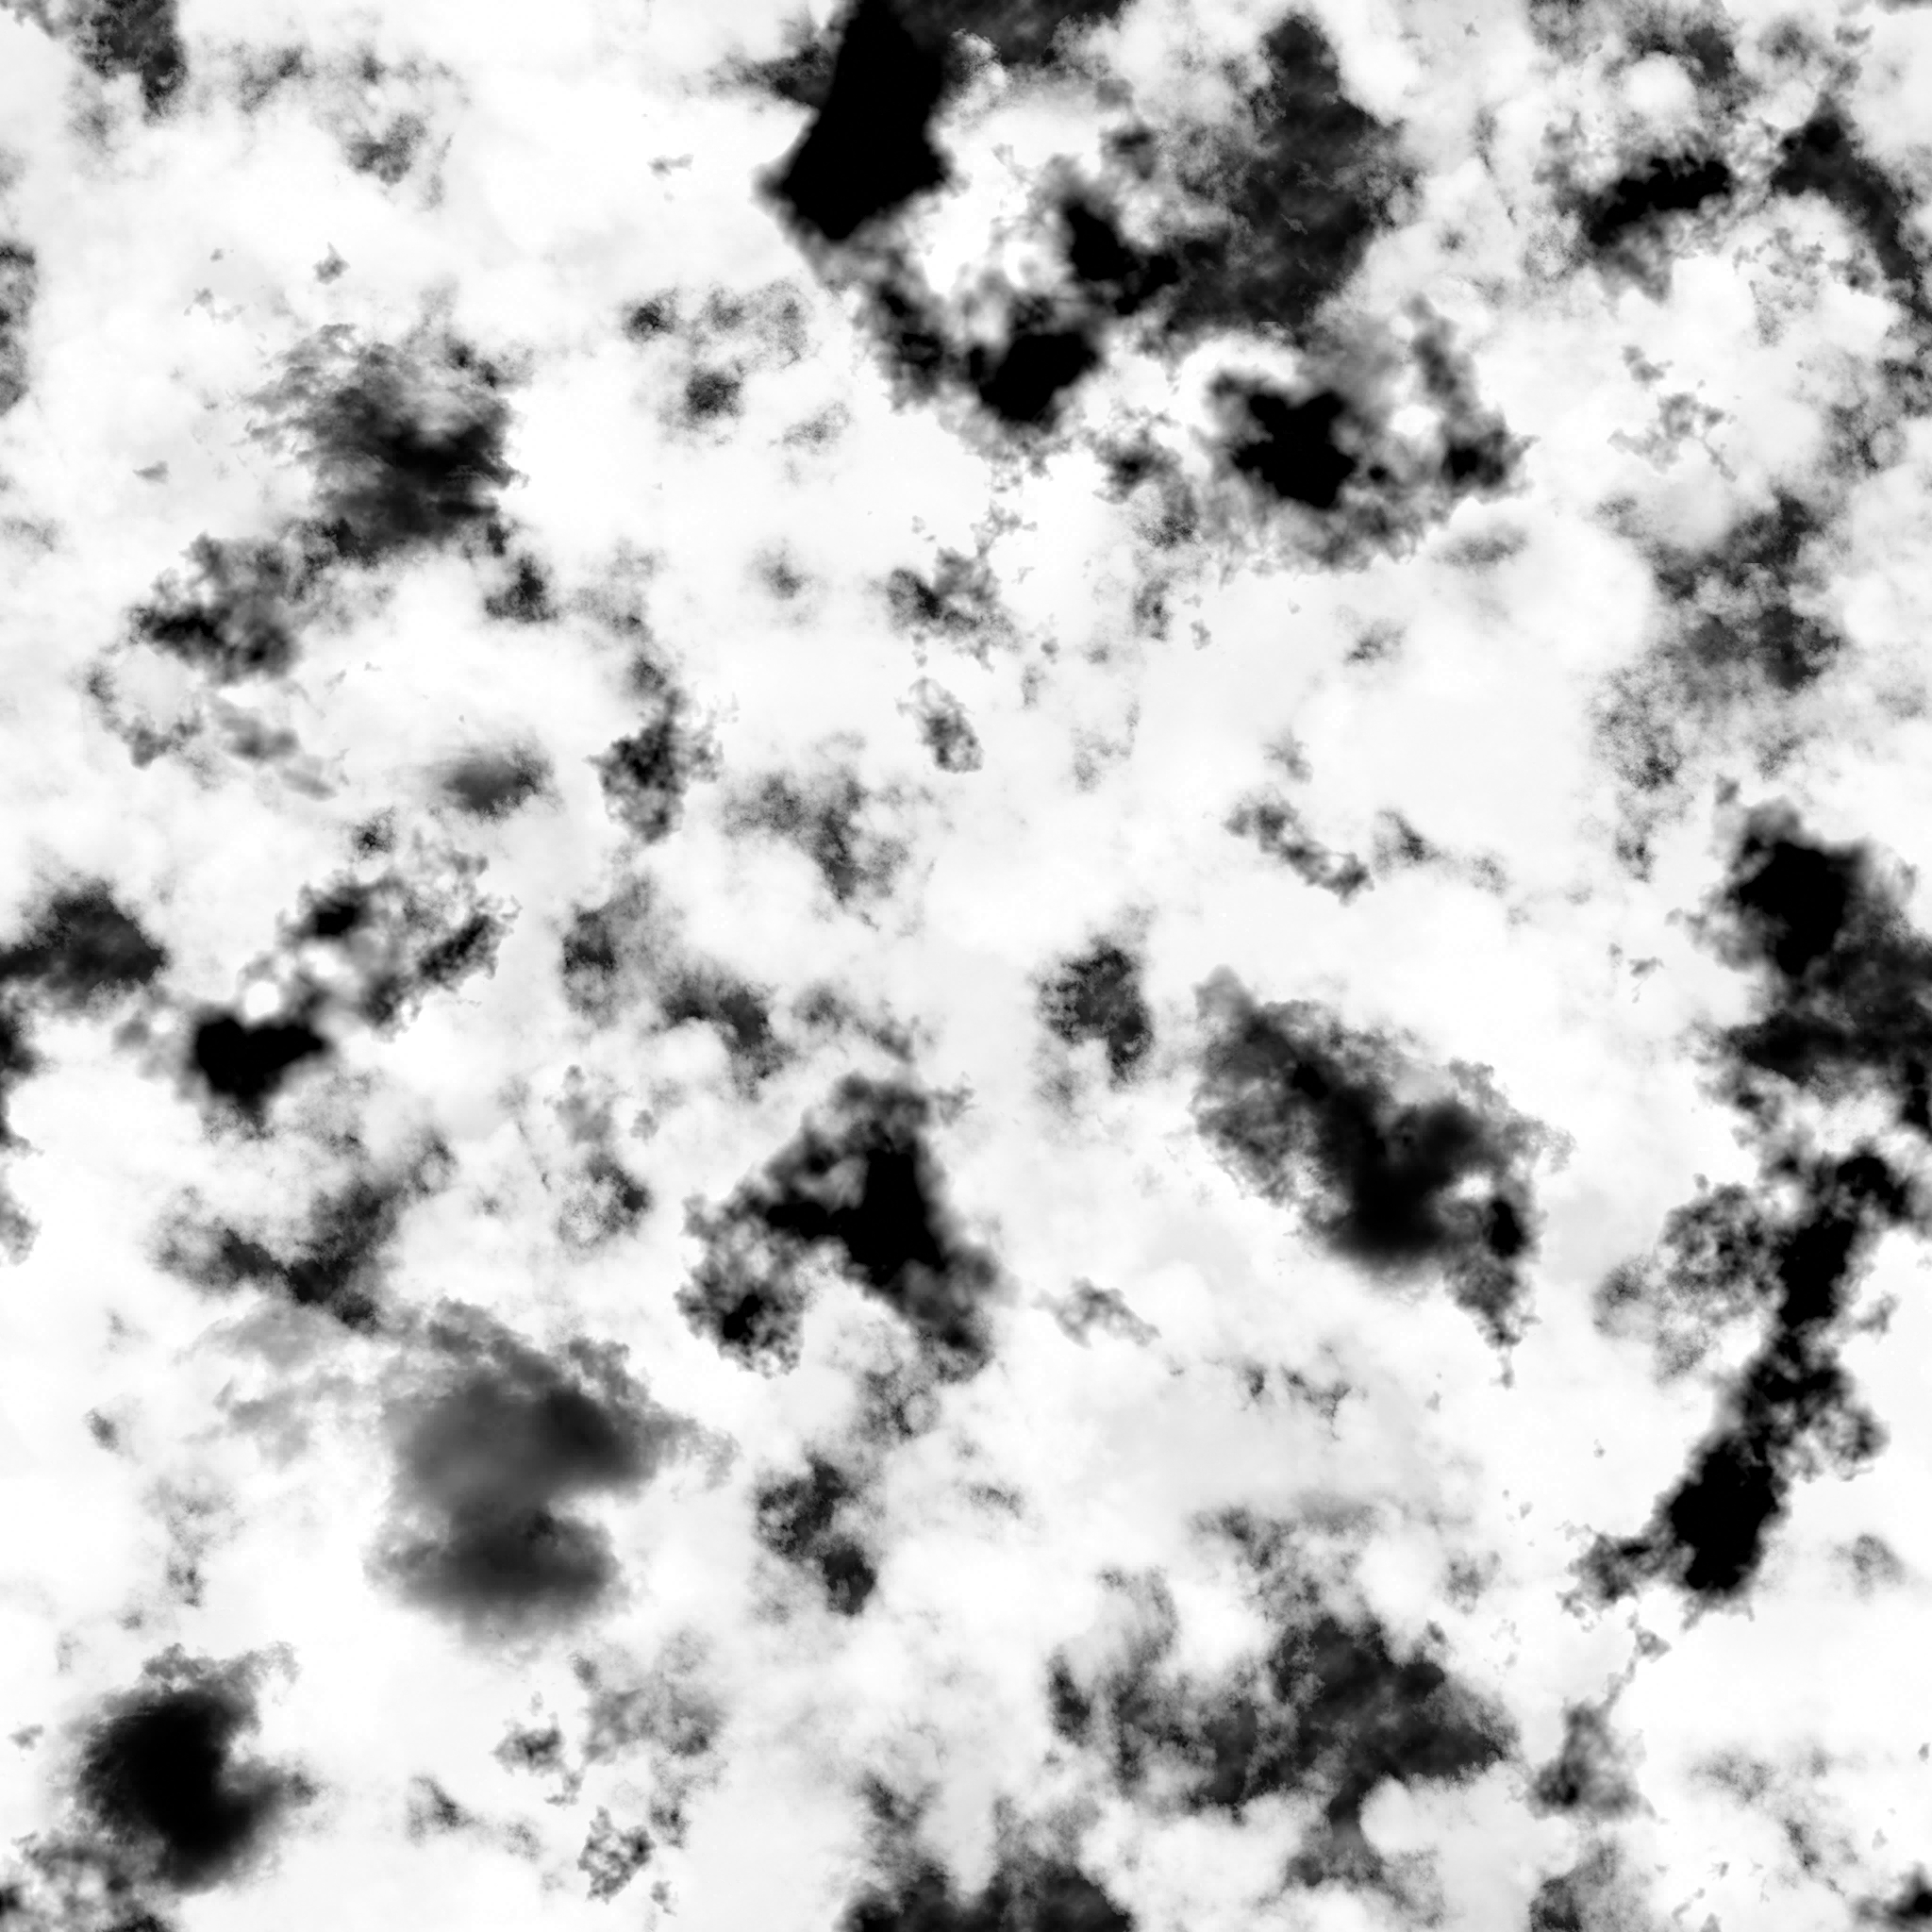
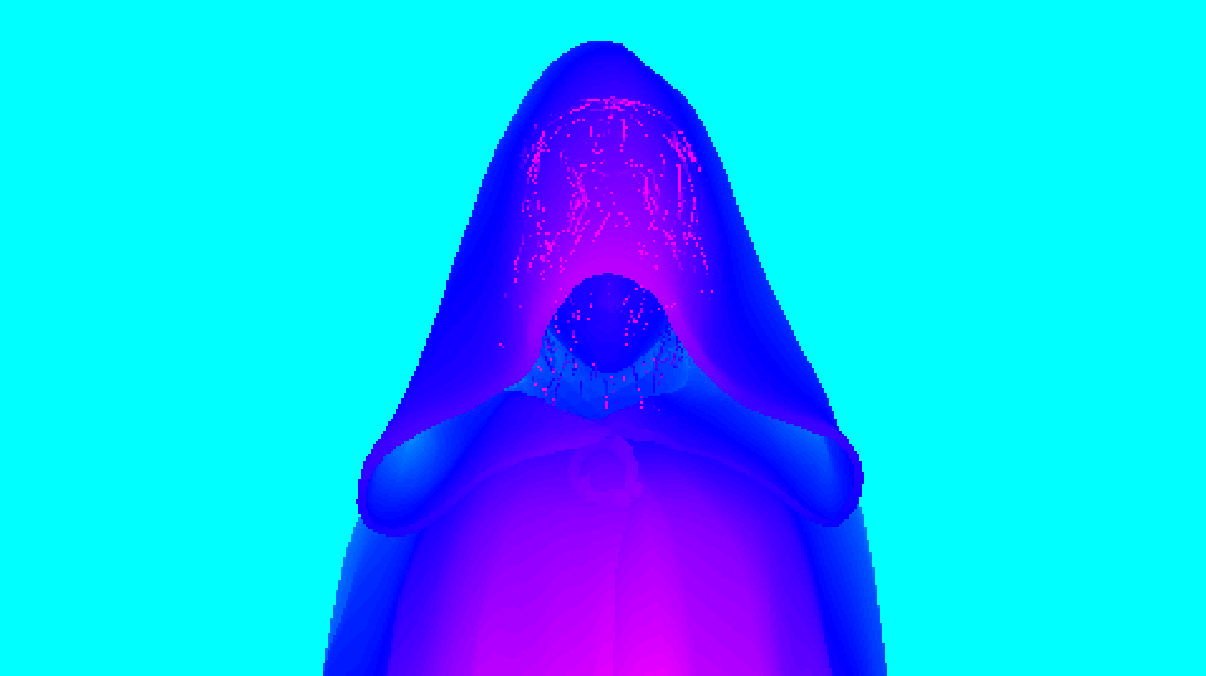
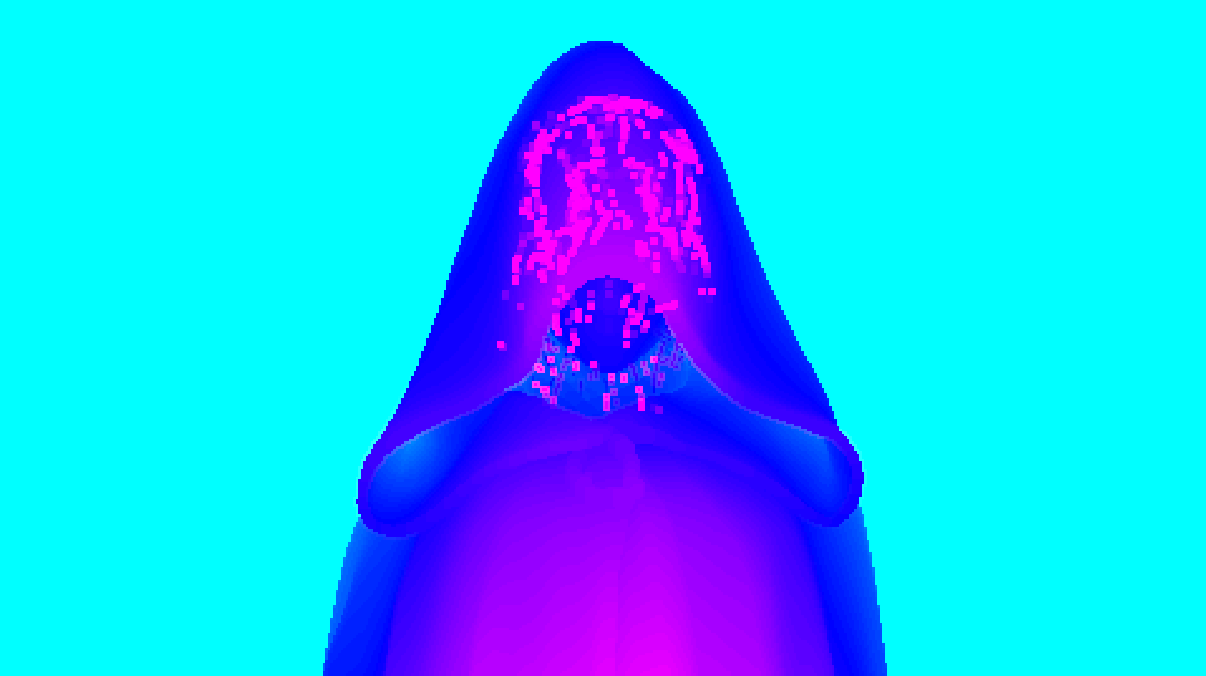
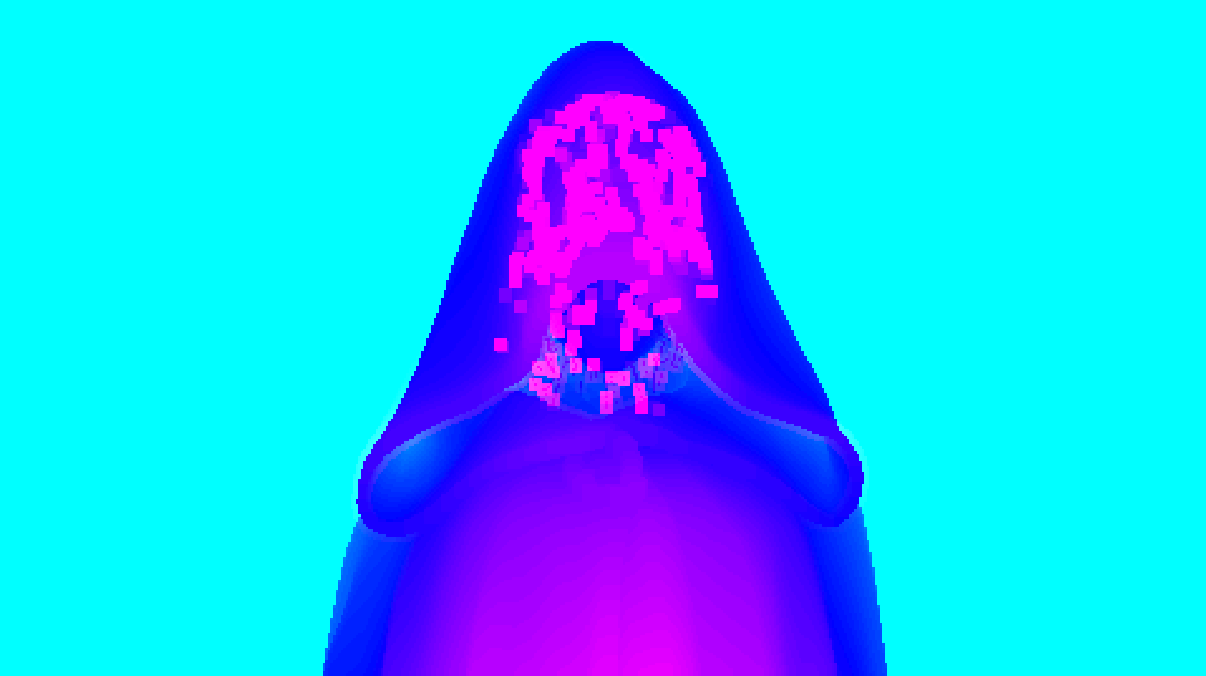
Dithering
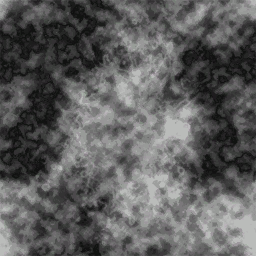
Lots of objects in Elden Ring are supporting dithering-transparency and having that global single channel dither 8*8 texture passed to them at draw time. Regardless you see those objects dithering or not, but they are drawn ready for that when needed. Grass, Trees all foliage types as well as the Player Character Armors & Cloth, Flags & Banners, NPCs and Enemies, all supporting dithering out of the box.

That was an upscaled linearly filtered version of Elden Ring’s global dithering texture for the purpose of demonstration, but in reality, this is how it looks in it’s real size

Decals
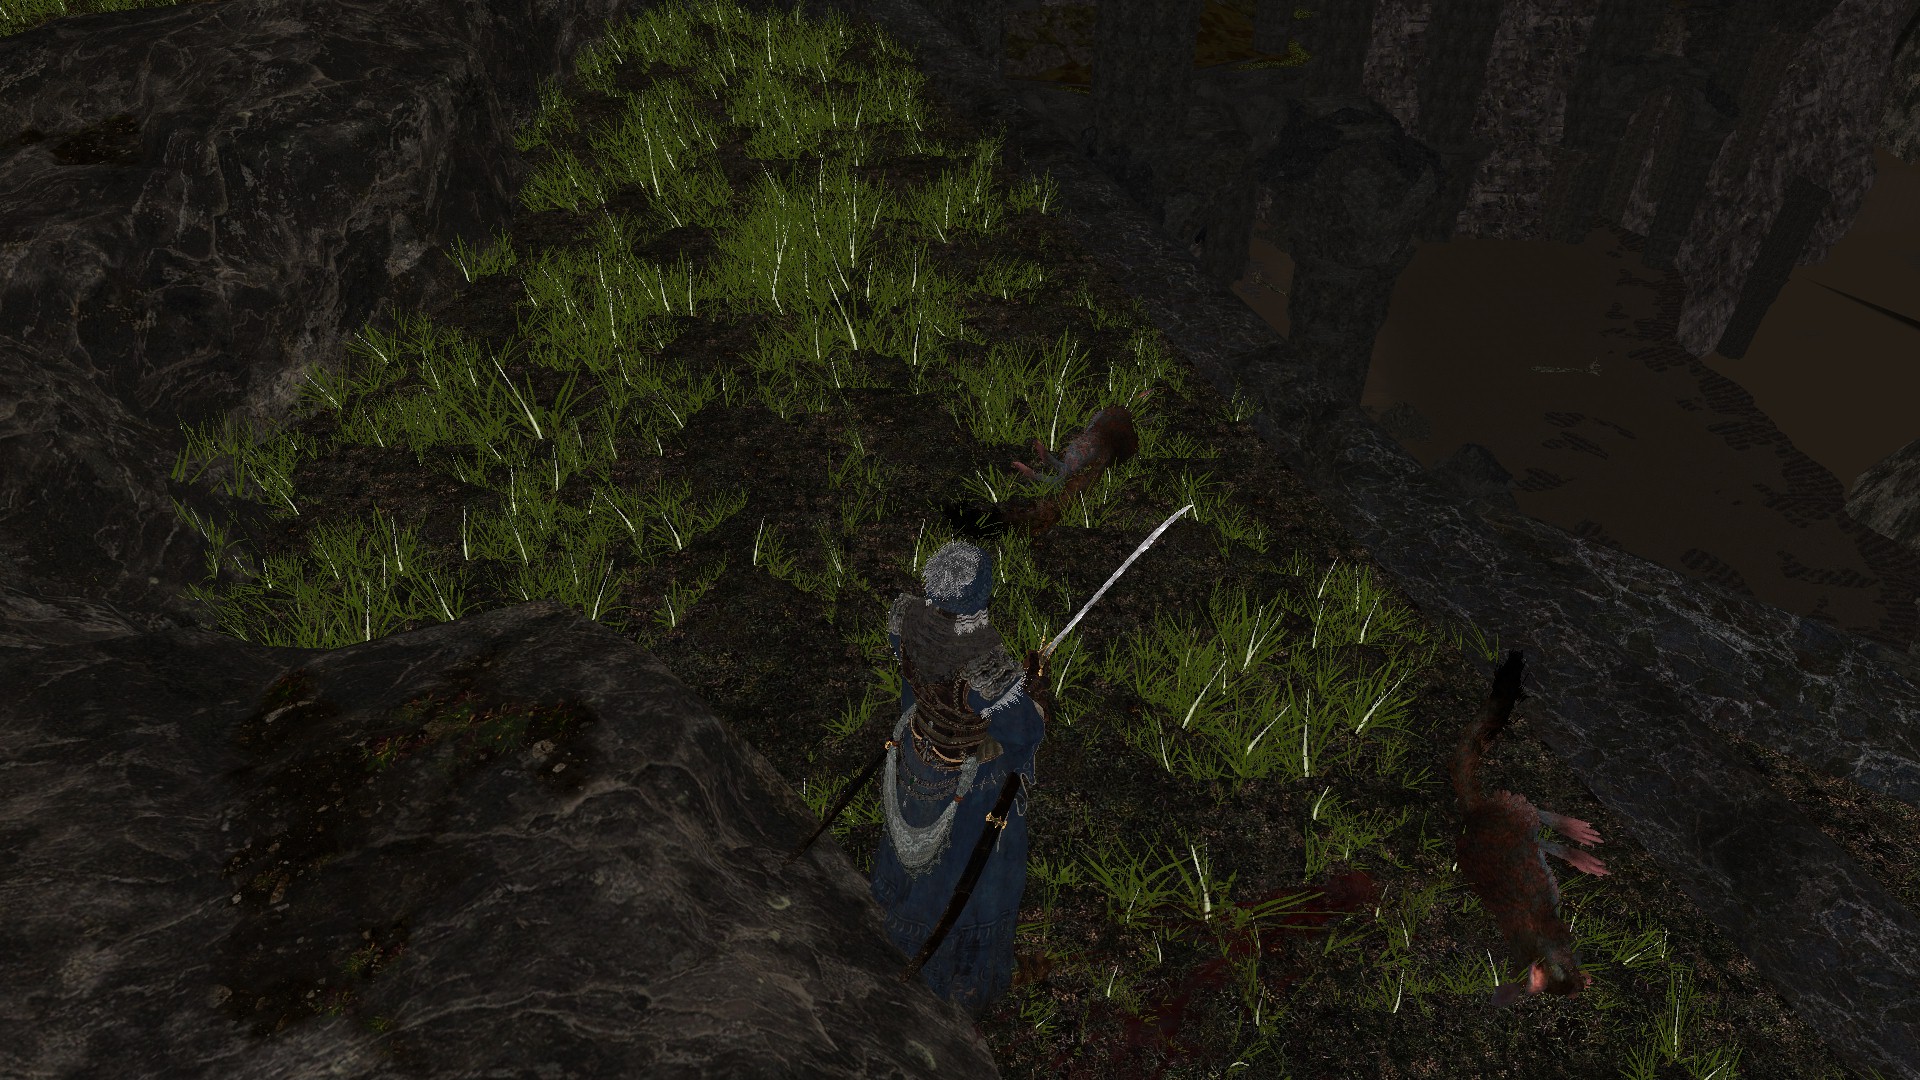
Decals painting over the deferred GBuffer happens in a sequence of DrawIndexedInstanced based on the the variations of decals as well as their count. Nothing fancy here.
So, given that deferred GBuffer
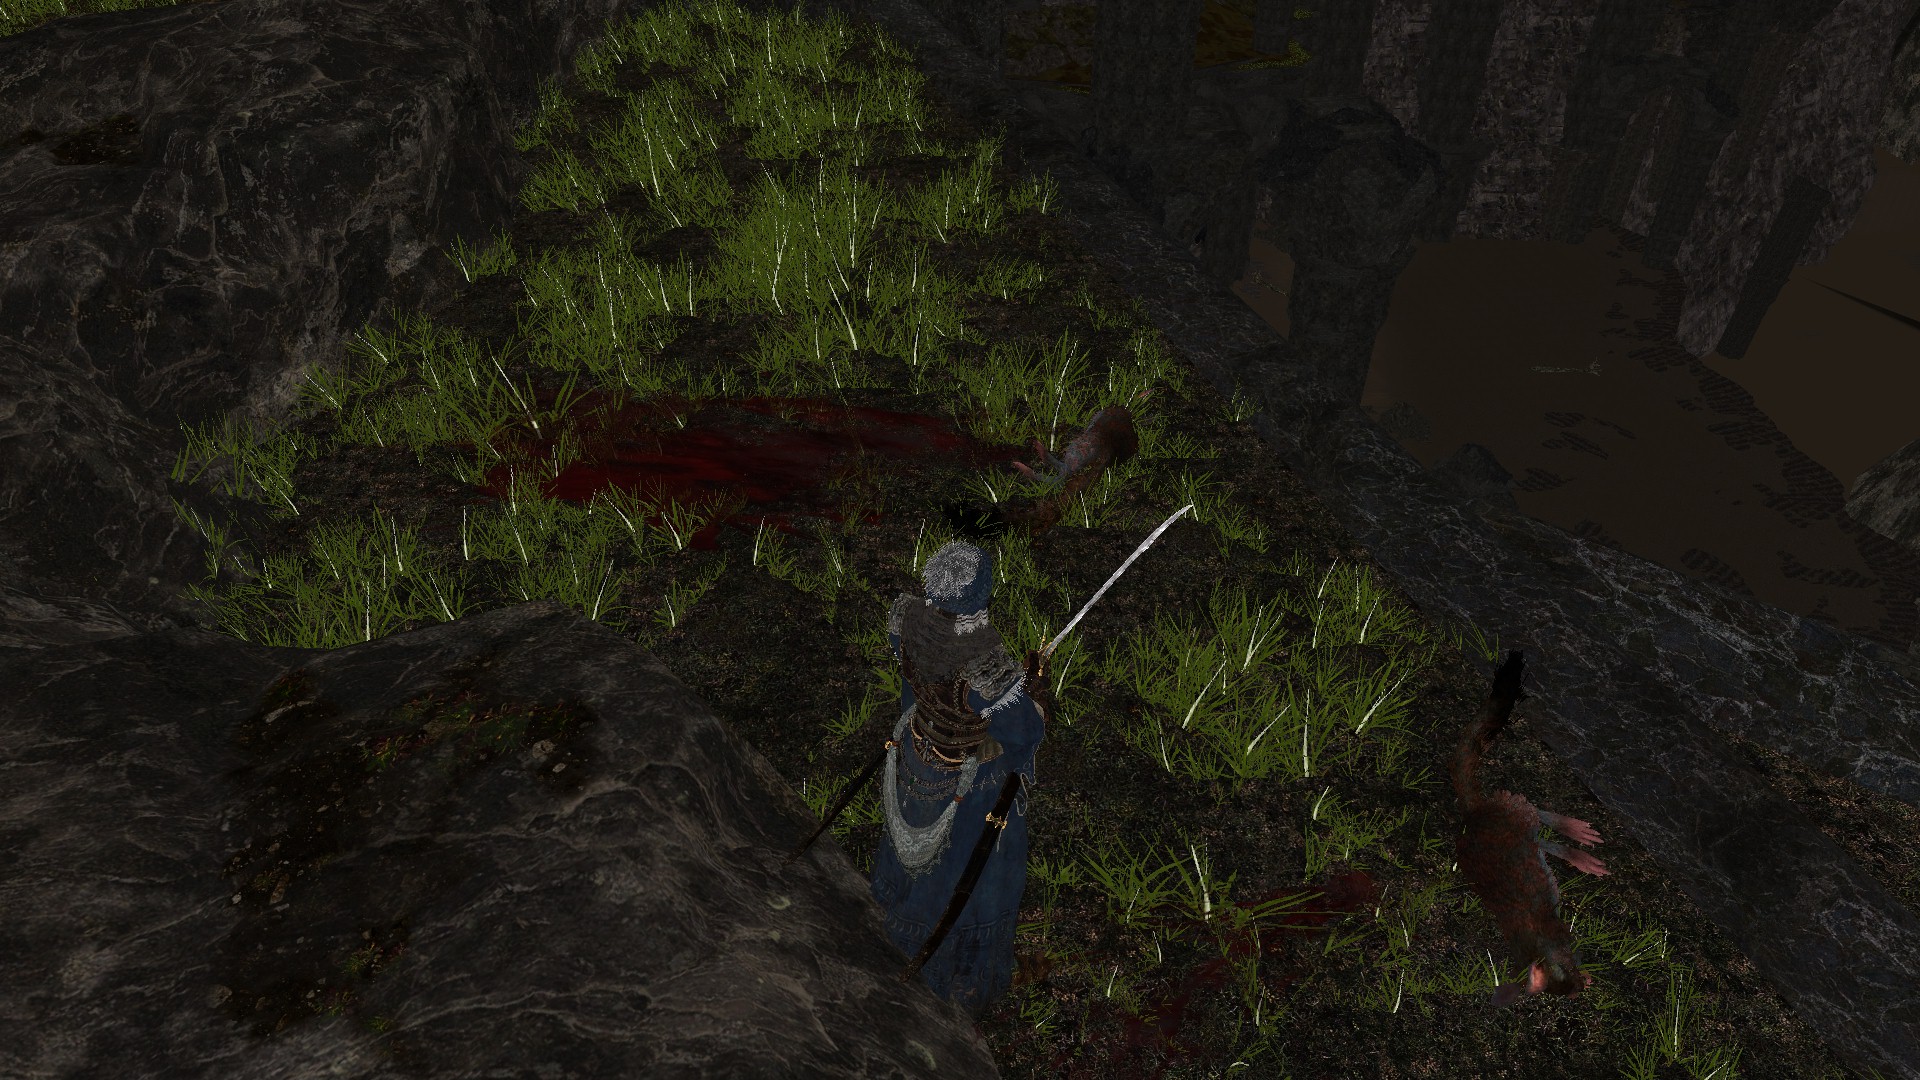
And we need to end up with that frame below, where we’ve two big blood splatters decals near the two dead creatures.
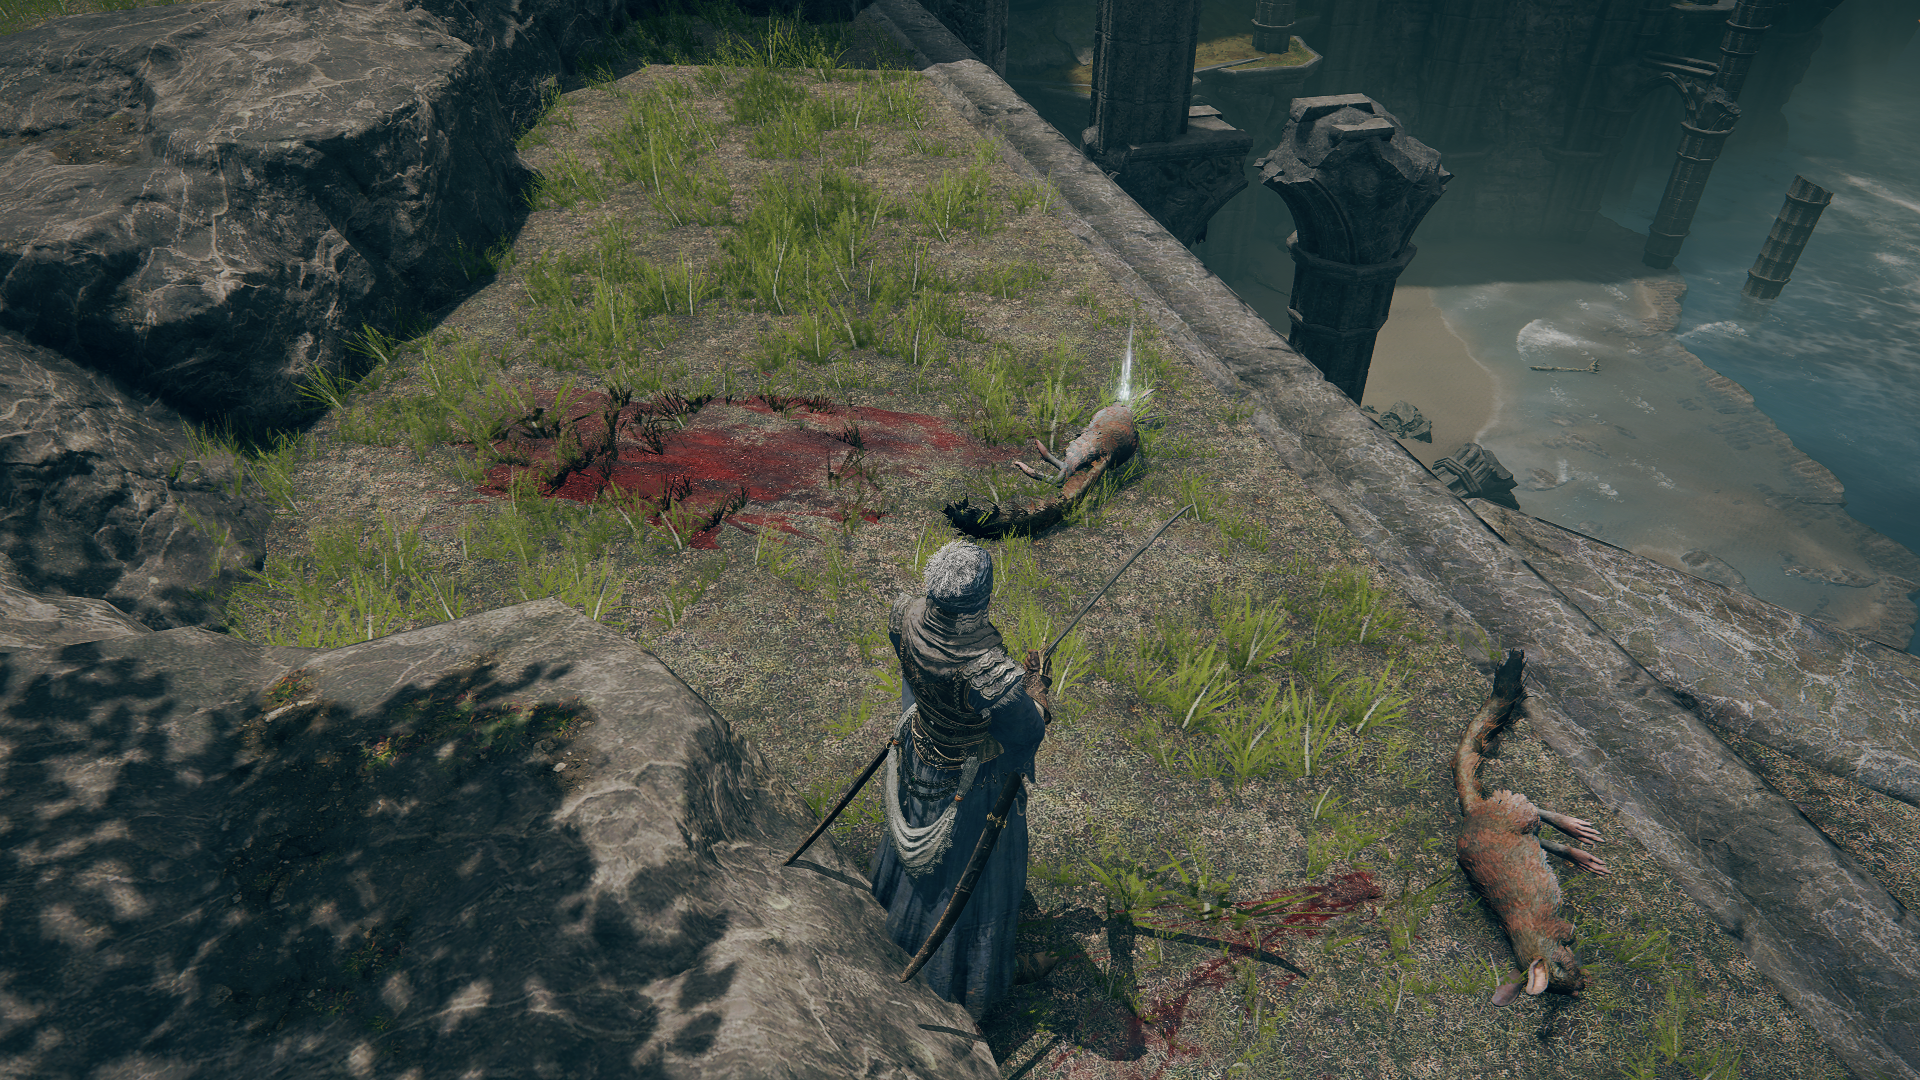
The swapchain frame at the end
We will go through two different draws, for each we use a mask as decal, and some supporting textures (such as diffuse, specular & normal) to project the decal in the desired position.
Draw 1


Draw 2


Draw N…
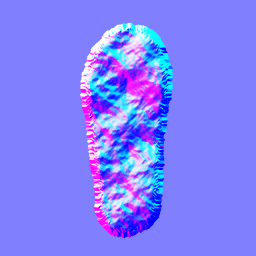
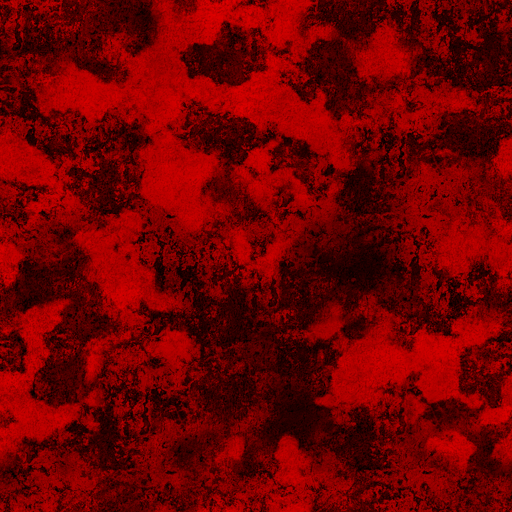
Just side note, the blood mask is not actually red, it’s used BC4_UNORM, so it’s a nice coincidence that it is a blood mask, and it “looks” red.
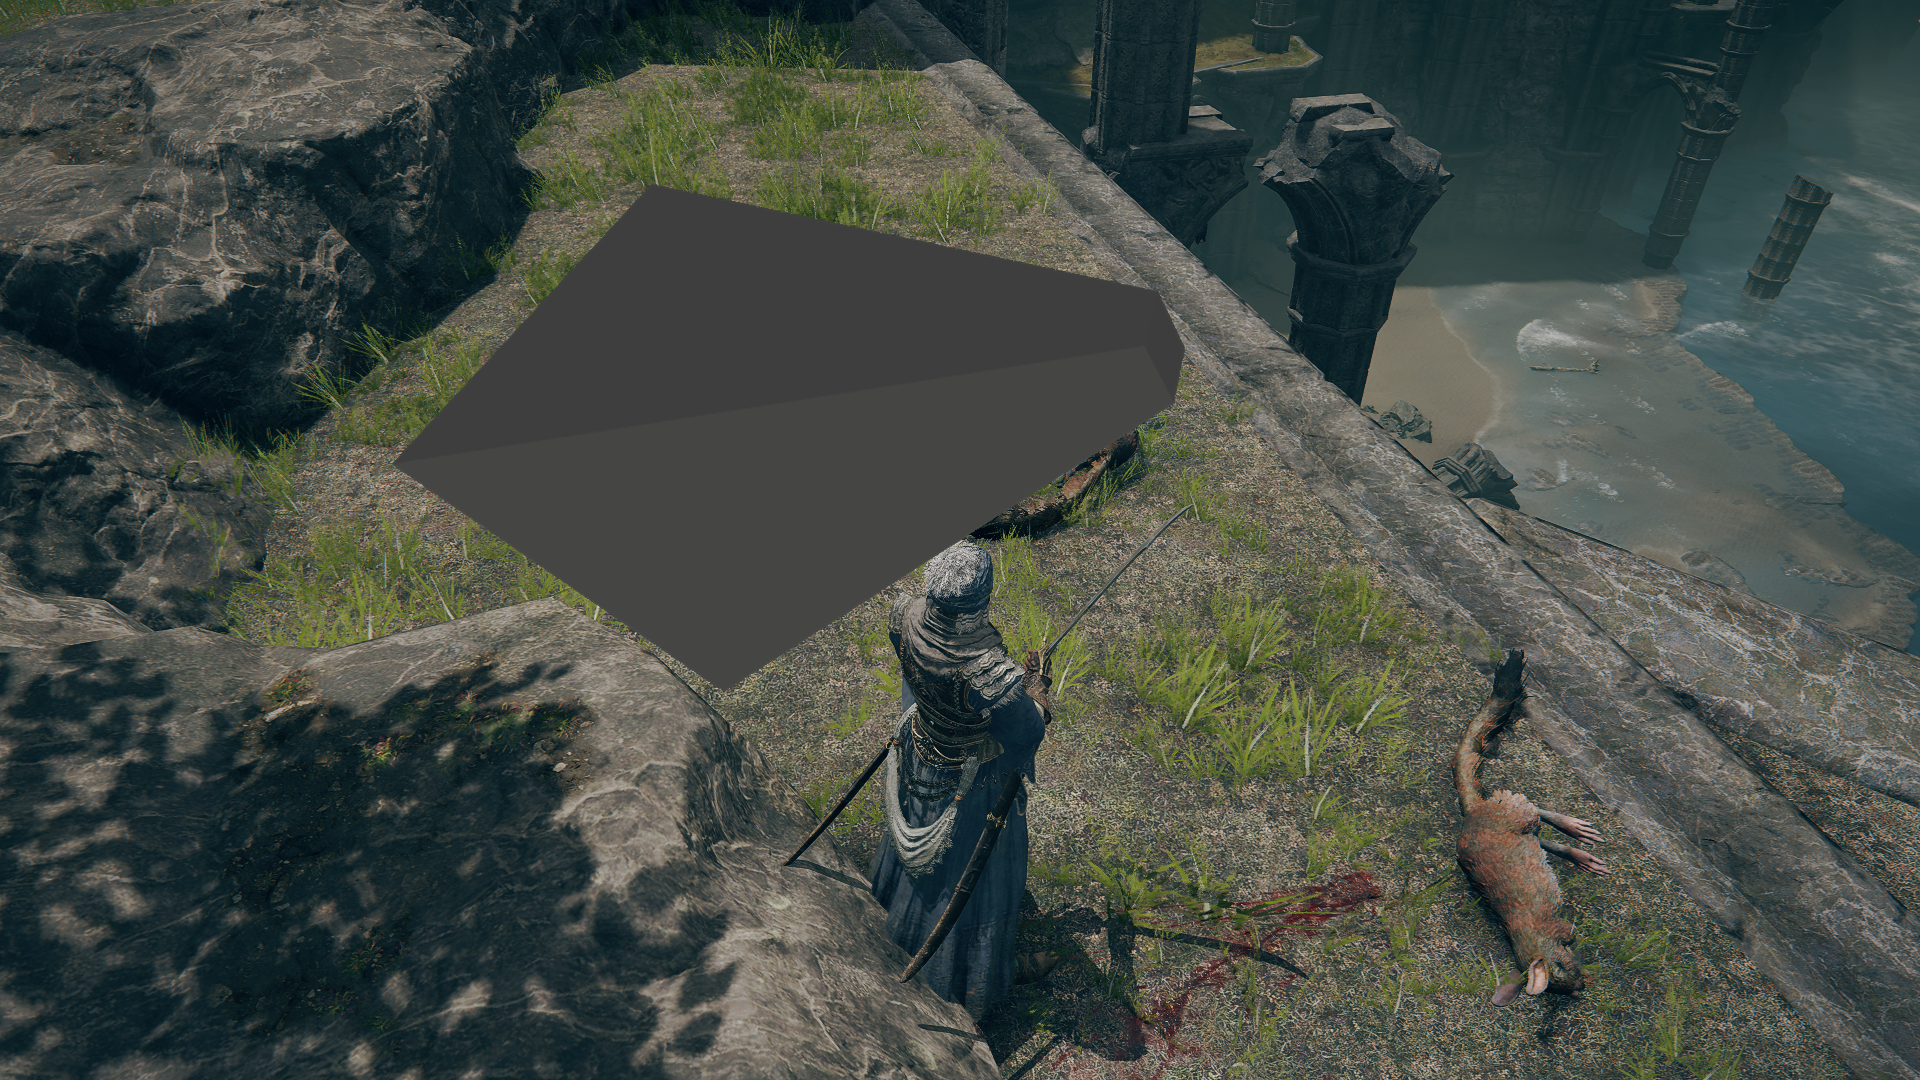
Also it’s worth mentioning that the decals projection is not always using usual/common cube volume as it is used in many other games and engine, but instead it is sometimes done using a “truncated prism” or “top-cut prism” which is essentially a cube 😀 but deformed. So you can think about it as something like that (roughly):
So if you think about it for a moment, it is really brilliant decision, because the box is used to project things top-down, for example a foot-step, and it works great. But for something like a big blood splatter, deforming that cube a bit to be more of a truncated prism + rotating it will give some deformation and stretchy-ness to the final decal, and makes it look “kinda” very unique every time you see it, even if it still using the exact same decal mask.. So for example that given big blood splatter:
It is used in these two frames below, but it’s projection looks different everytime, because the box been deformed in a different amount and different direction everytime.

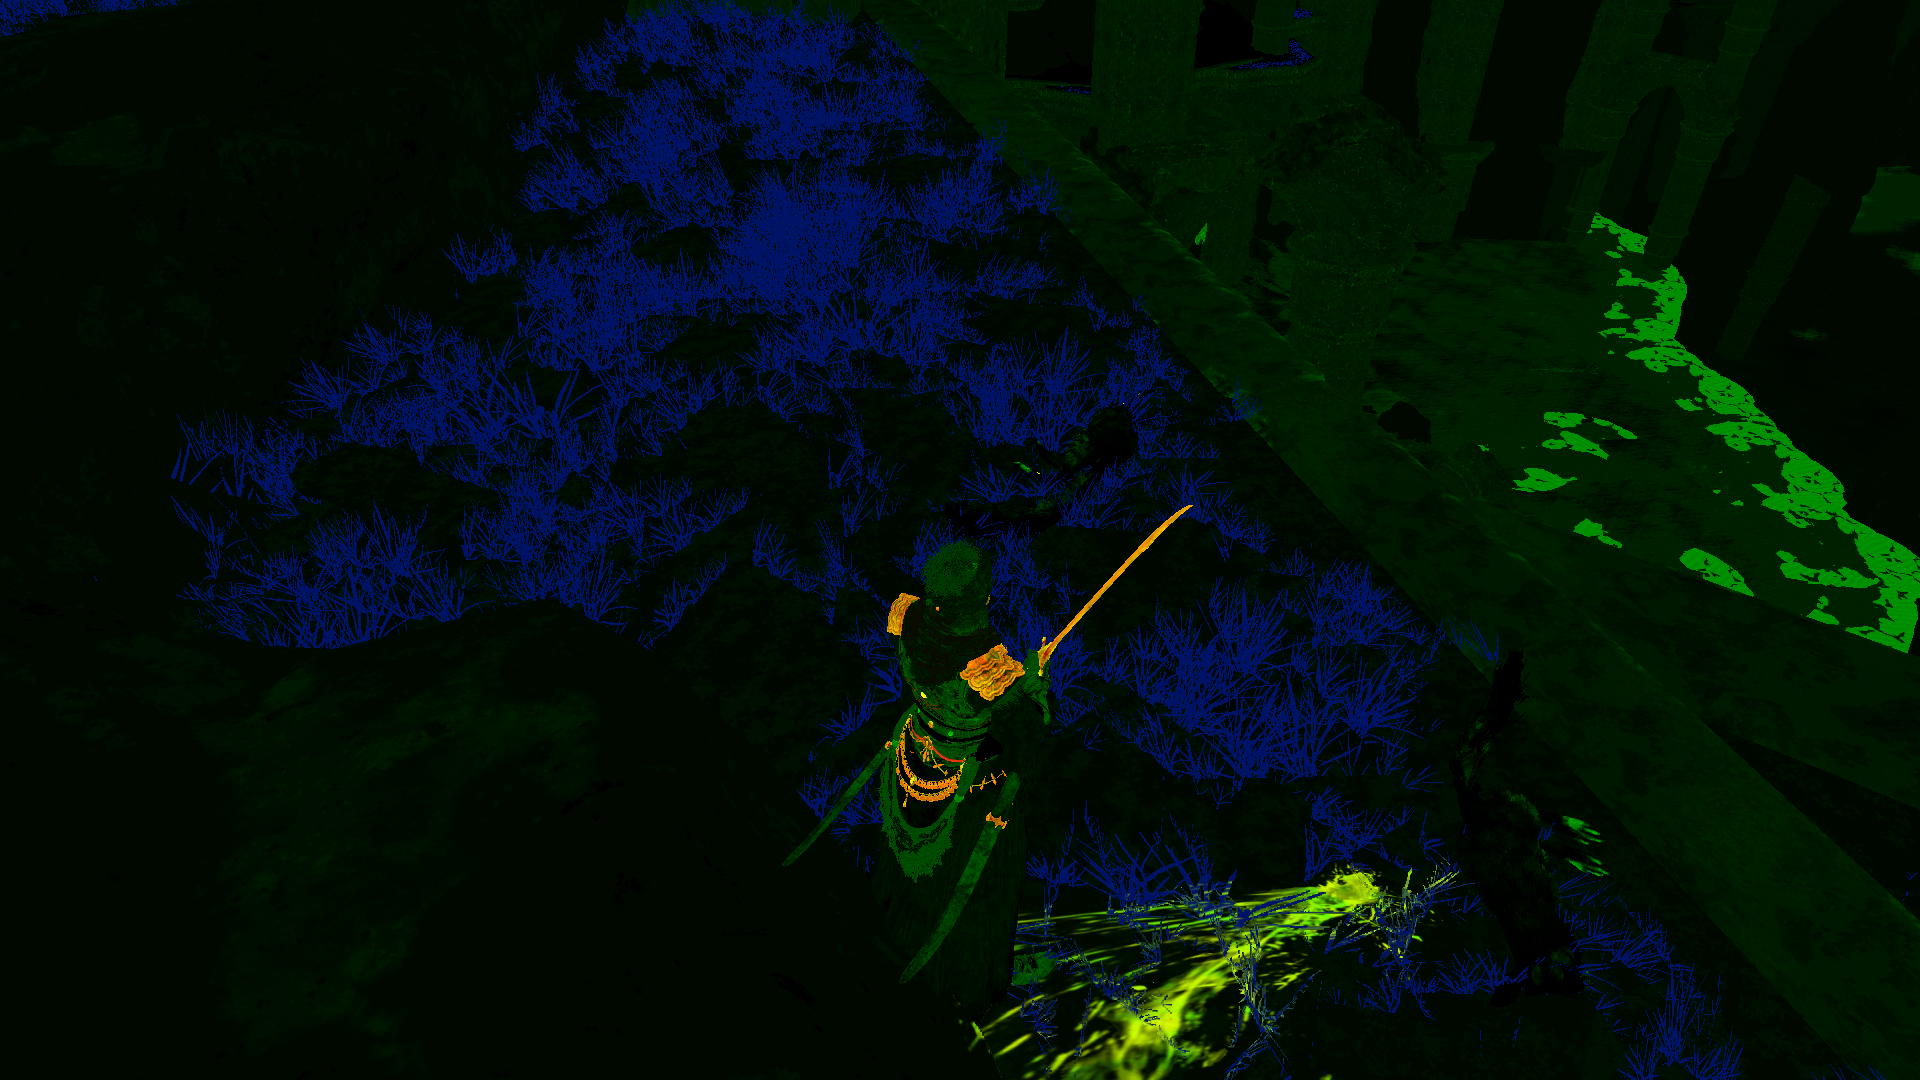
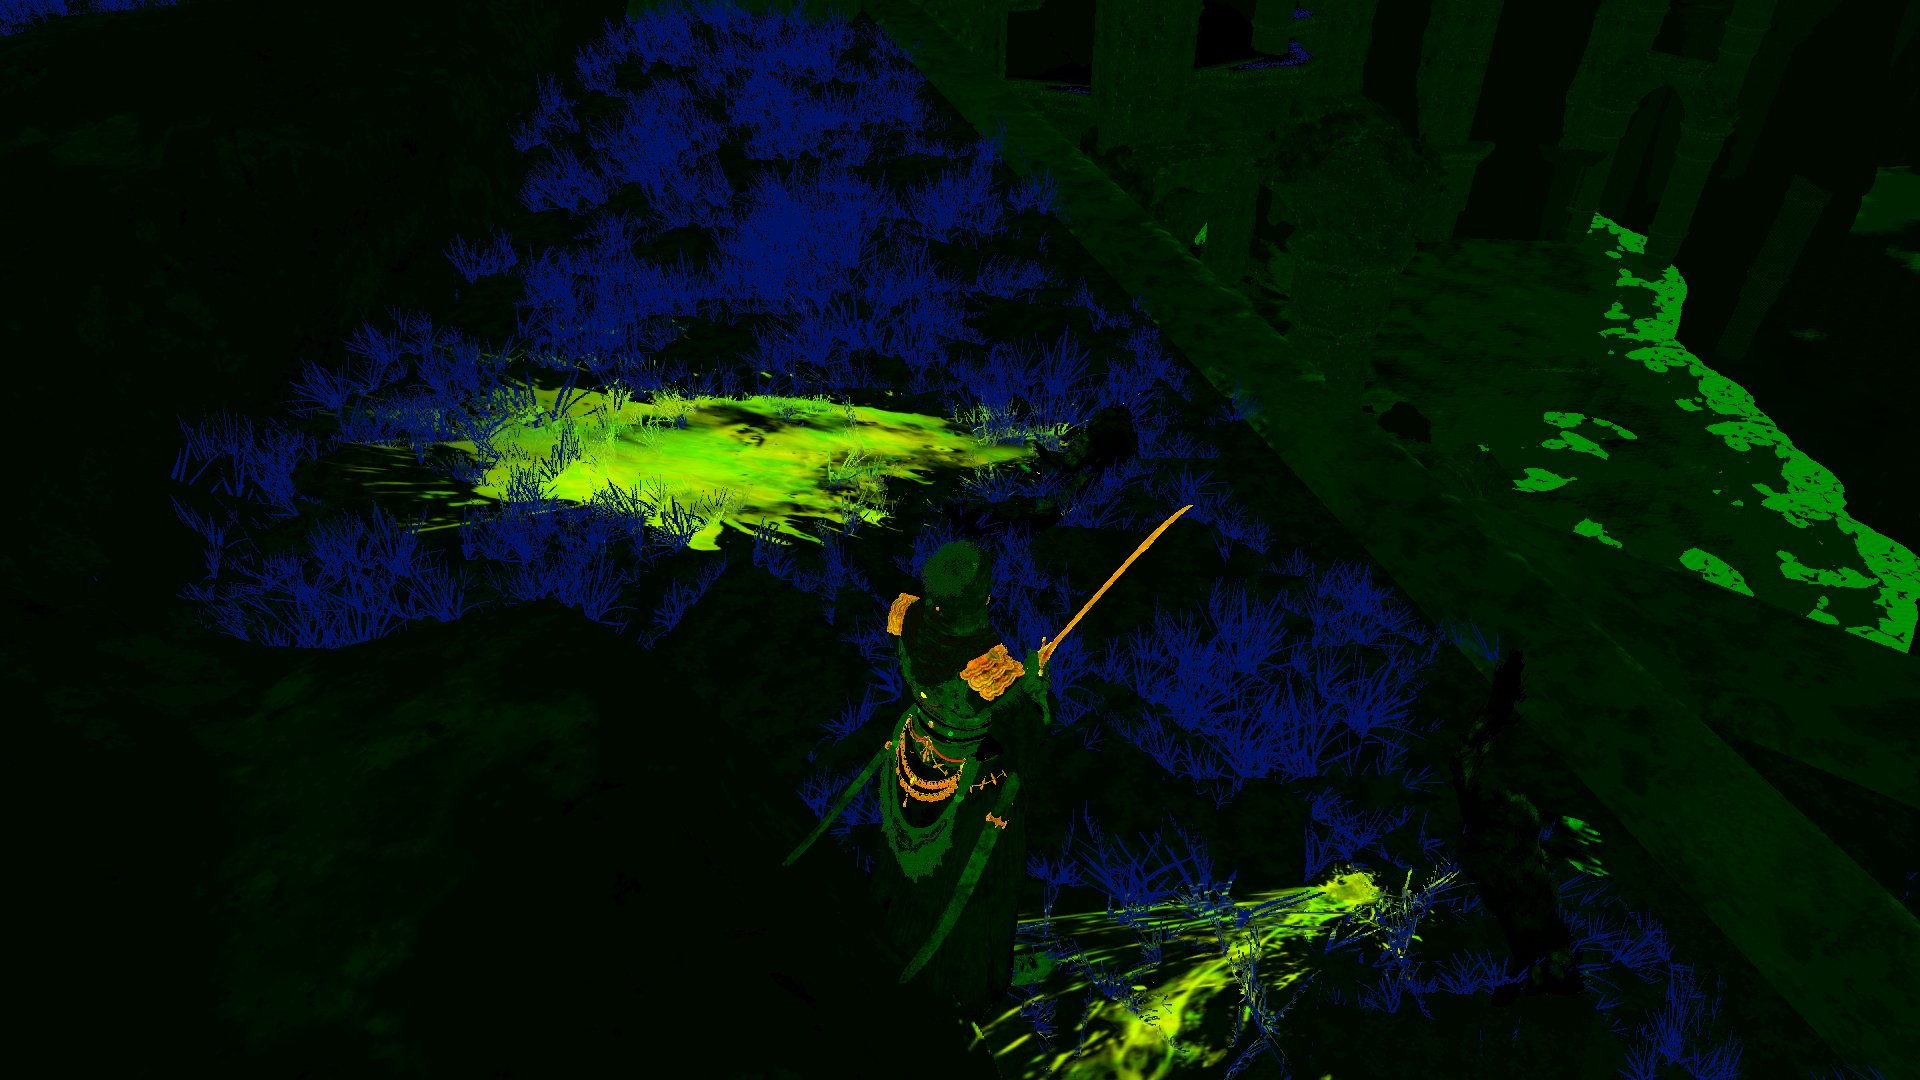
Perhaps looking at the GBuffer’s surface definitions will be more clear in showing the variation as well as the stretchy-ness in the final projected blood splatter texture.
Specially the one at the left, looks nothing like the actual decal texture due to the big amount of stretchiness on the Vertical axis of the texture.
Now, if that was the resources part the is sent to the deferred decals, what about the shader parameter? Here is a list of of decals params that is passed to the shaders
MTD Param
struct MtdParam
{
	float4 FC_DifMapMulCol;
	float4 FC_AlphaRef;
	float4 FC_GlowScale;
	float FC_BloodAmount;
	float cbMtdParam_pad3_y;
	float2 FC_VATPlayFrame;
	float HC_BackFaceCull;
	float HC_FrustumCullEpsilon;
	float2 cbMtdParam_pad4_zw;
	float4 FC_HairSpecularParam0;
	float4 FC_HairSpecularParam1;
	float4 FC_HairSpecularParam2;
	float4 FC_RimLightingParam;
}
Still, Alignment!!!
Also not sure why have that mix of kinda “unrelated” parameters in that single struct. Couldn’t it be better to use whatever related to decals in a single struct here, and keep other things for their other usages?!
Instance Data
struct InstanceData[2]
{
	float4x3 mWorld;
	float4 userClipPlane;
	uint matricesData;
	uint cmMatricesOffset;
	uint ccMatricesOffset;
	uint prevMatricesOffset;
	uint envData;
	bool dynamicLightDisable;
	uint2 envPad;
	float4 mulCol;
	float ditherFadeAlpha;
	uint forceNum;
	uint2 forceIndex;
	float4 recursiveResolveArea;
	float4[4] aColor;
}
Notice that this InstanceData array of struct is always having 2 elements, regardless how many instances of a decal is draw, and regardless if there is even decals present or no. Always 2 elements in that array.
Model Param
struct ModelParam
{
	float4 FC_DifColMul;
	float FC_EnvMapInterpRatioDiff;
	float FC_EnvMapColorScale0;
	float FC_EnvMapColorScale1;
	float FC_EnvMapInterpRatioSpec;
	float FC_DitherEnable;
	float cbModelParam_pad2_y;
	float cbModelParam_pad2_z;
	float cbModelParam_pad2_w;
	float4 cbModelParam_pad3;
	float4 cbModelParam_pad4;
	float4 cbModelParam_pad5;
	float4 FC_SkinMatchColor;
	float4 cbModelParam_pad7;
	float4 FC_ParallaxCorrectedCubemapOriginA;
	float4 FC_ParallaxCorrectedCubemapOriginB;
	float4x4 FC_ParallaxCorrectedCubemapObbA;
	float4x4 FC_ParallaxCorrectedCubemapInvObbA;
	float4x4 FC_ParallaxCorrectedCubemapObbB;
	float4x4 FC_ParallaxCorrectedCubemapInvObbB;
	float FC_ParallaxCorrectedCubemapObbAEnable;
	float FC_ParallaxCorrectedCubemapObbBEnable;
	float FC_ParallaxCorrectedCubemapMipmapLevelA;
	float FC_ParallaxCorrectedCubemapMipmapLevelB;
	float4x4 FC_IrradianceVolumeAInvObb;
	float4x4 FC_IrradianceVolumeBInvObb;
	float4 FC_IrradianceVolumeASamplingParam;
	float4 FC_IrradianceVolumeBSamplingParam;
	float FC_IrradianceVolumeAEnable;
	float FC_IrradianceVolumeBEnable;
	float FC_IrradianceVolumeAScale;
	float FC_IrradianceVolumeBScale;
	float4 FC_IrradianceVolumeASafeVoxeJacobian;
	float4 FC_IrradianceVolumeBSafeVoxeJacobian;
	float4 FC_IrradianceVolumeAShLuminance;
	float4 FC_IrradianceVolumeBShLuminance;
}
Still, Alignment!!!
Decal Param
struct Decal Param
{
	float4x4 FC_ProjToDecalSpace;
	float4x4 g_InvProjMatrix;
	float4x4 g_CameraMatrix;
	float4 FC_ScreenPercentage;
	float3x4 FC_DecalWorldRotation;
	float4 FC_EyeInDecalSpace;
	float4 FC_ParallaxScale;
	float4 FC_DecalSoakThreshold;
	float4 FC_CubeCenterOffset;
	float4 FC_DiffuseScale;
	float3 FC_ReflectanceScale;
	float FC_ShininessScale;
	float4 FC_LightInDecalSpace;
	float3 FC_EmissiveScale;
	float cbDecalParam_pad23_w;
	float FC_NearFade_Start;
	float FC_NearFade_ReciRange;
	float FC_FarFade_Start;
	float FC_FarFade_ReciRange;
	float FC_NormalThreshold_Start;
	float FC_NormalThreshold_ReciRange;
}
Finally!!! One out of 4 structs that is passed to the shader is really 100% related! But still, not a big fan of the alignment!!
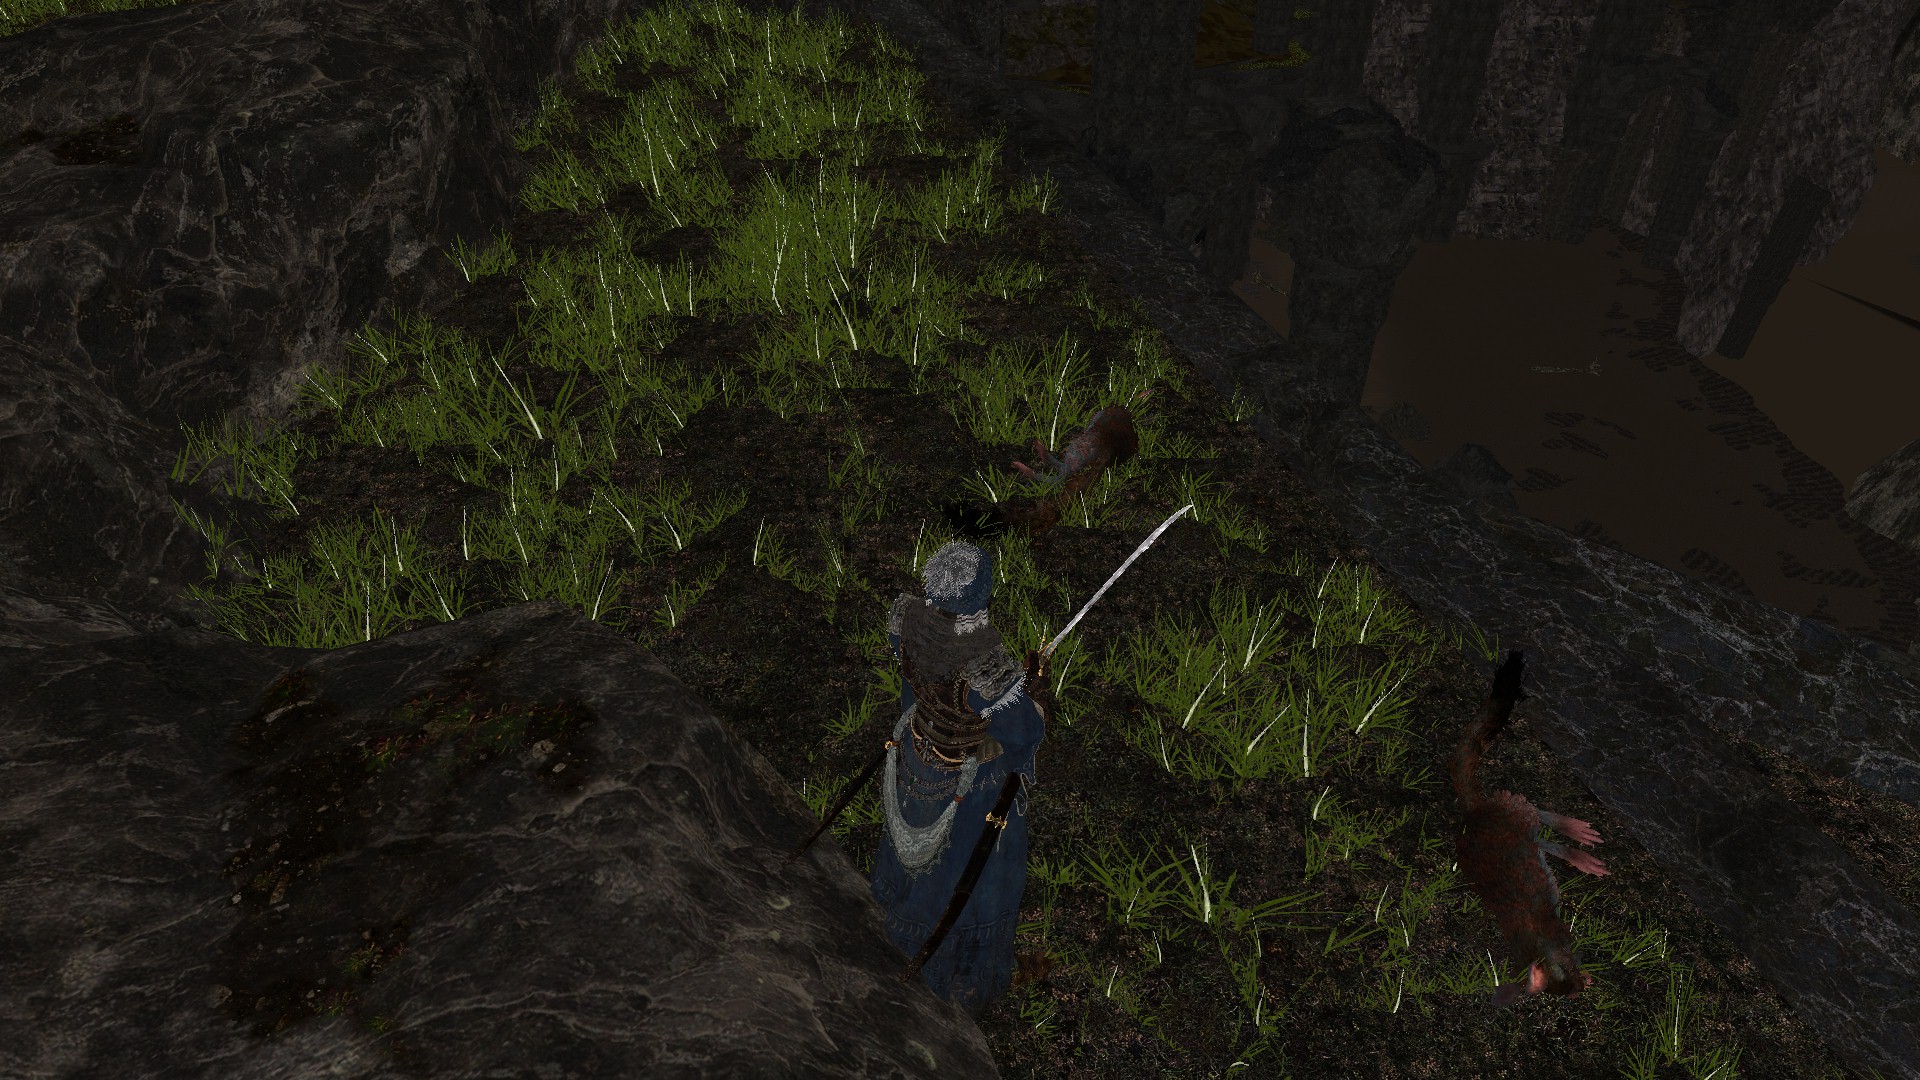
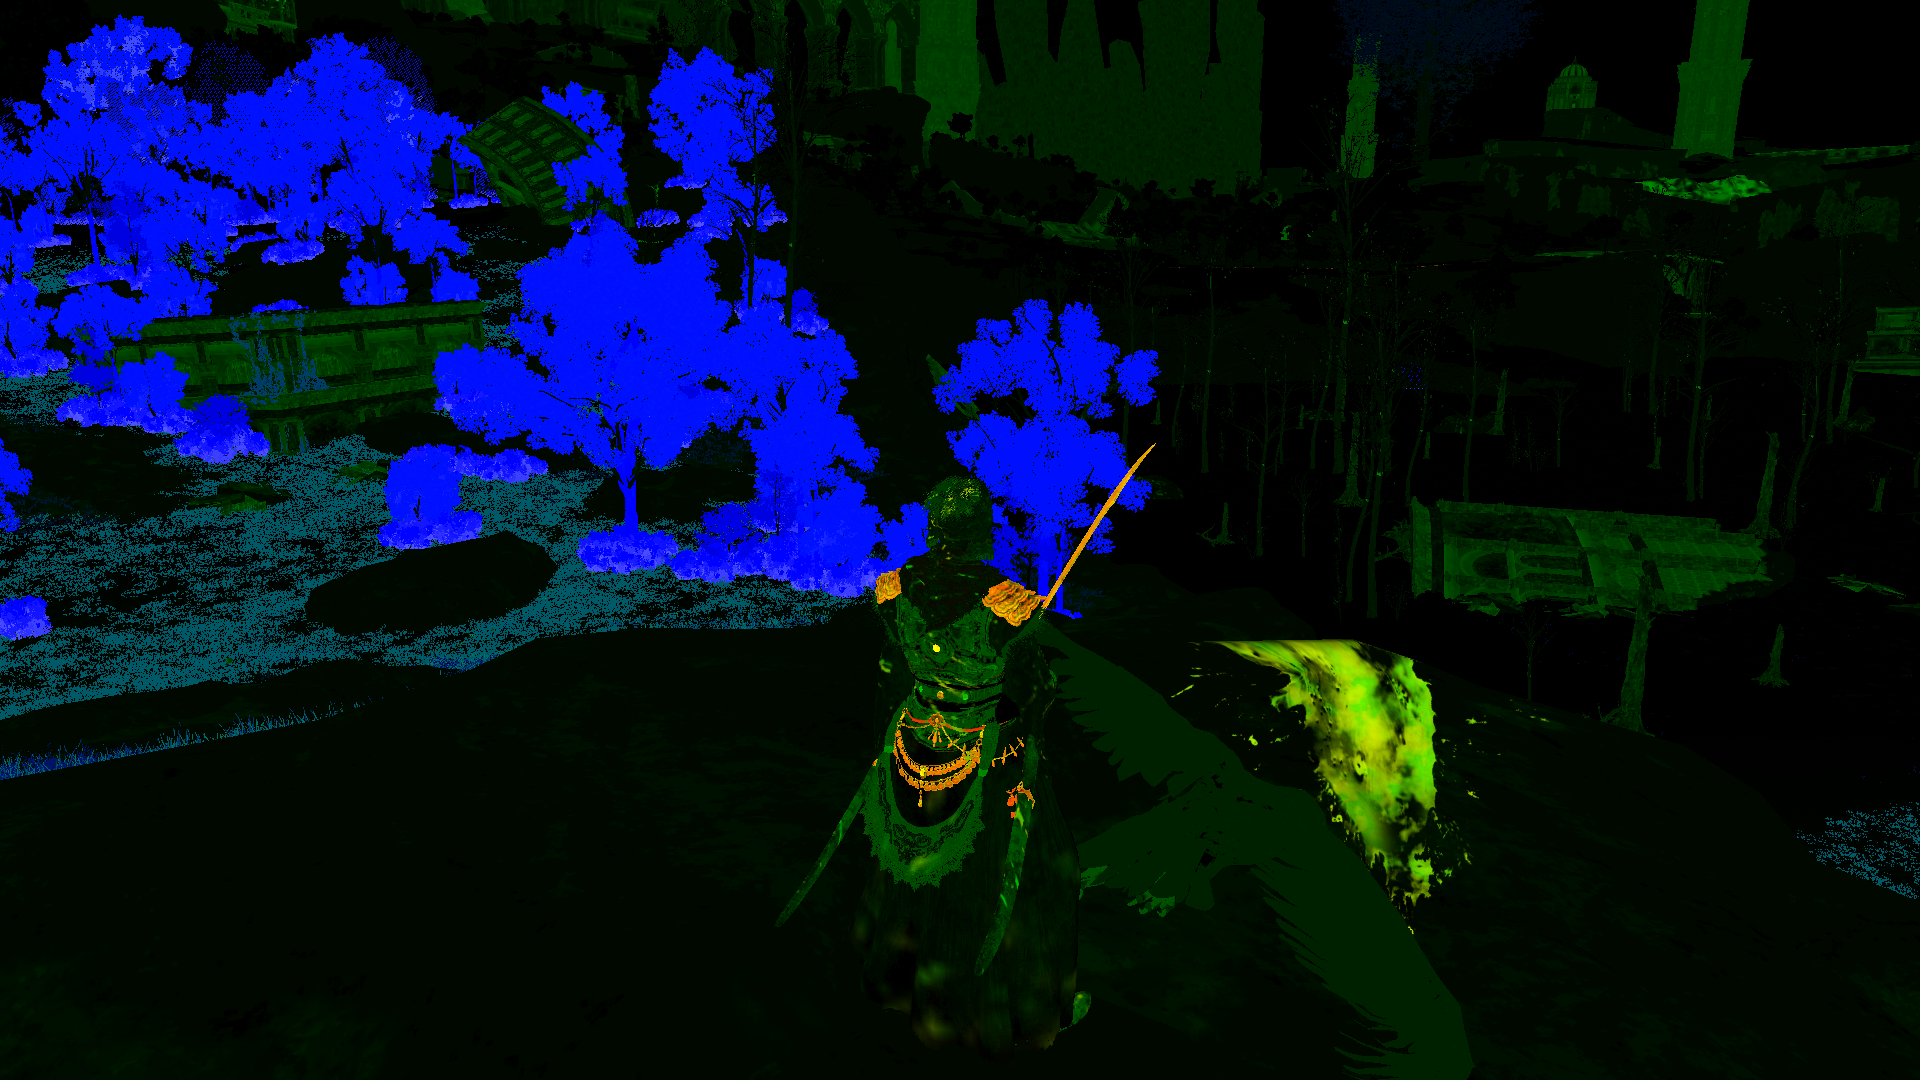
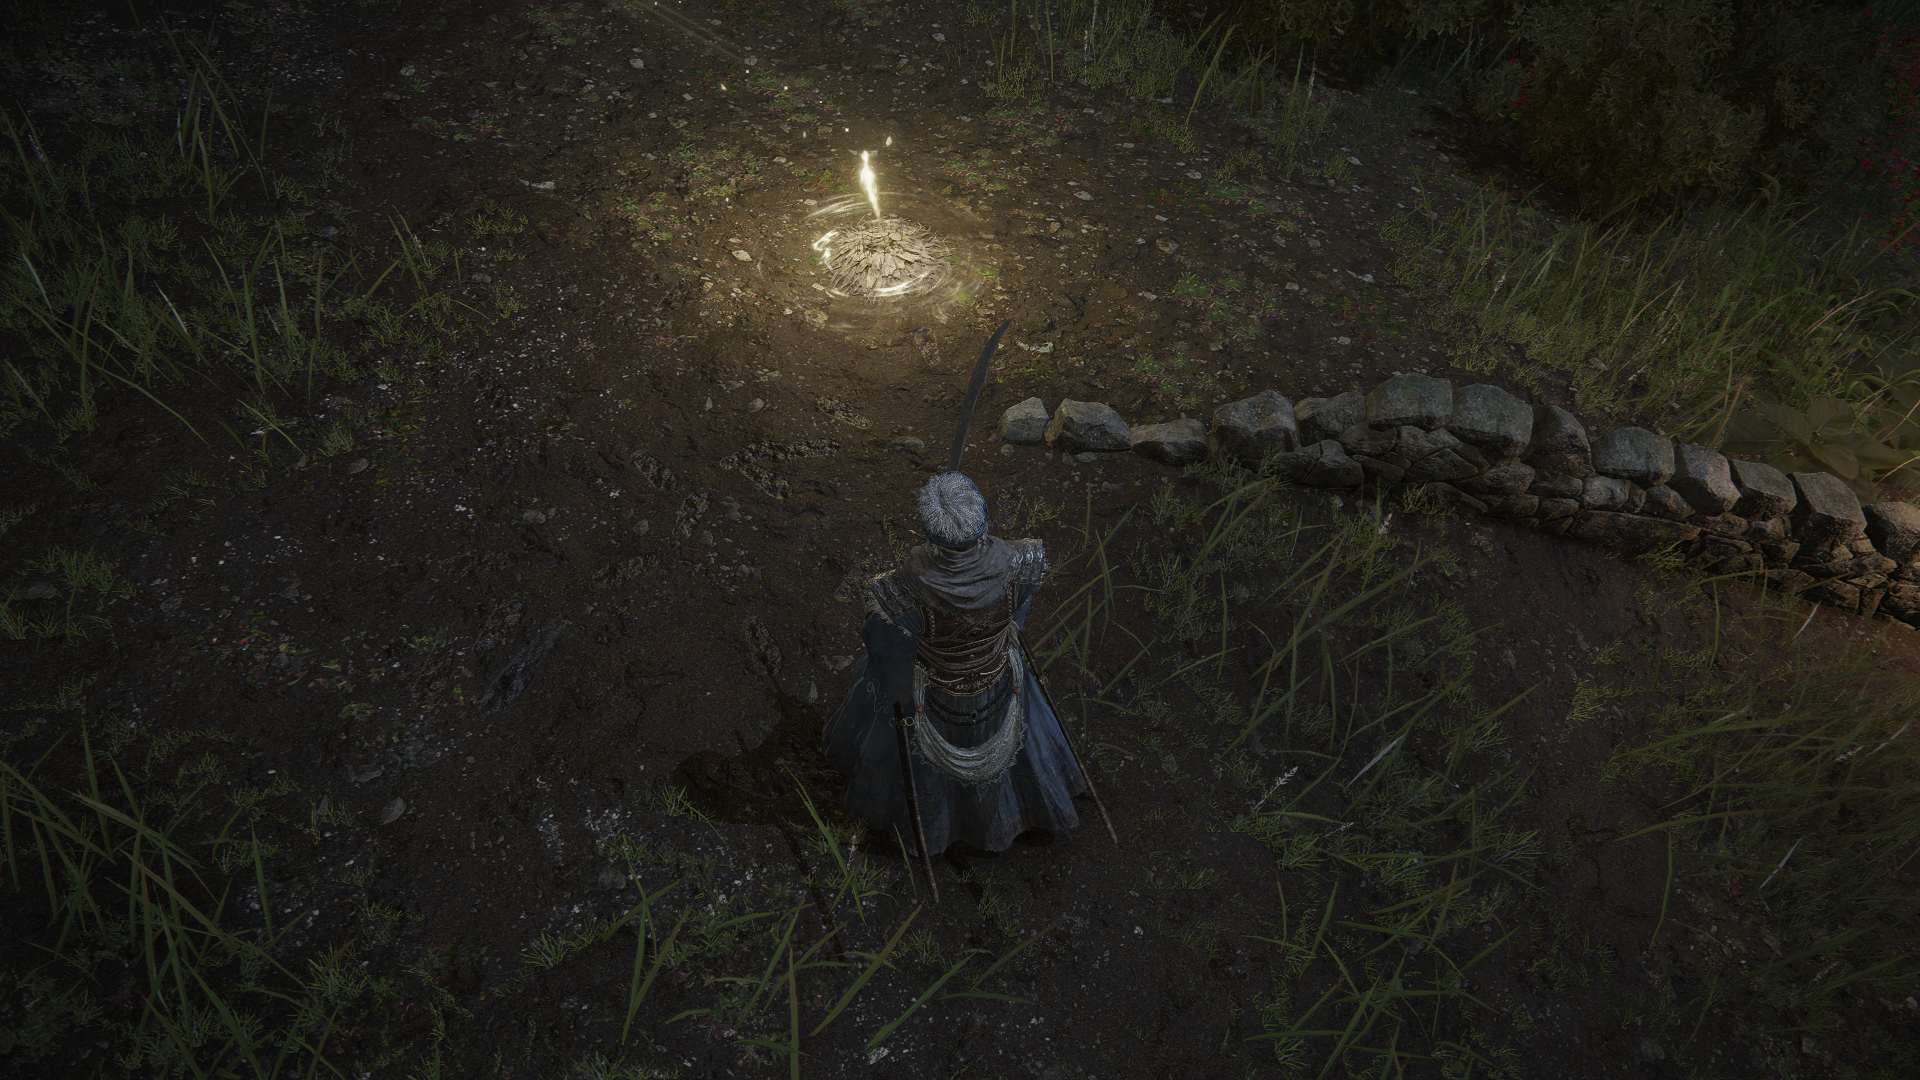
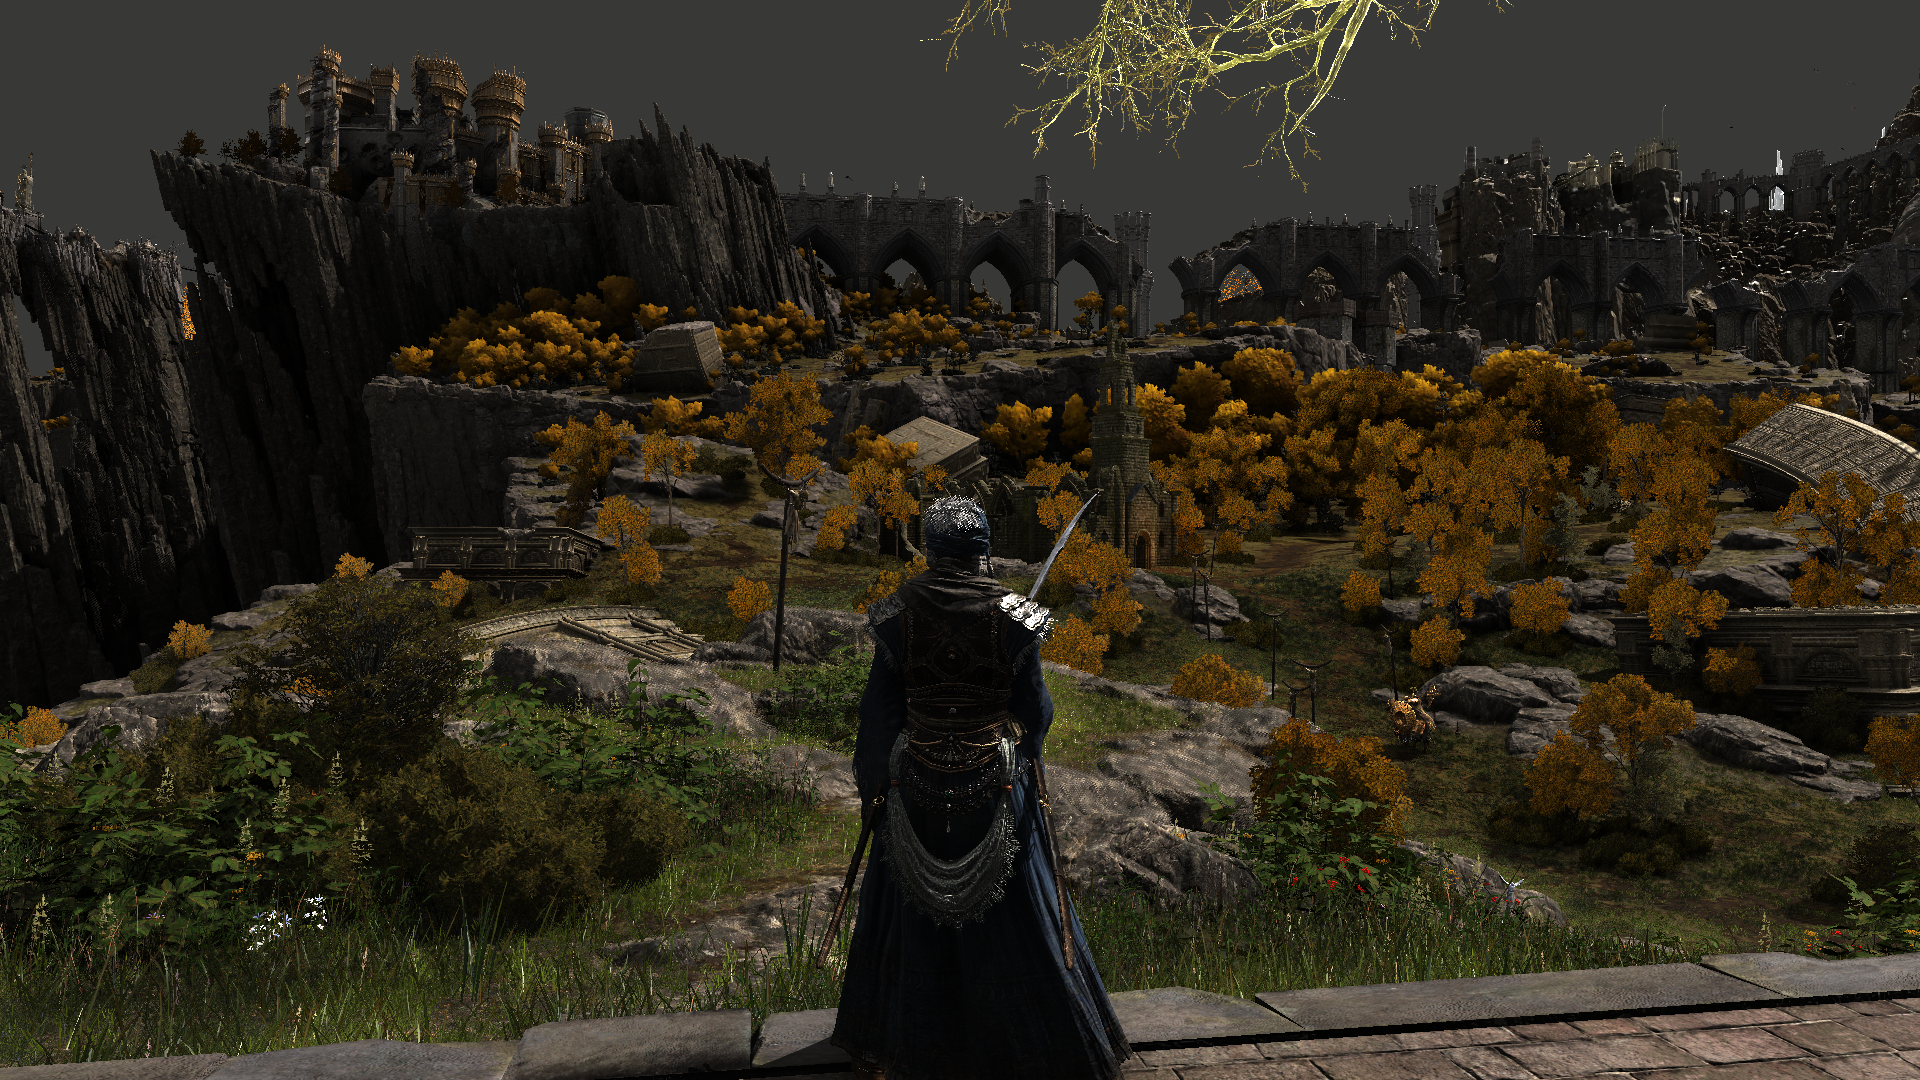
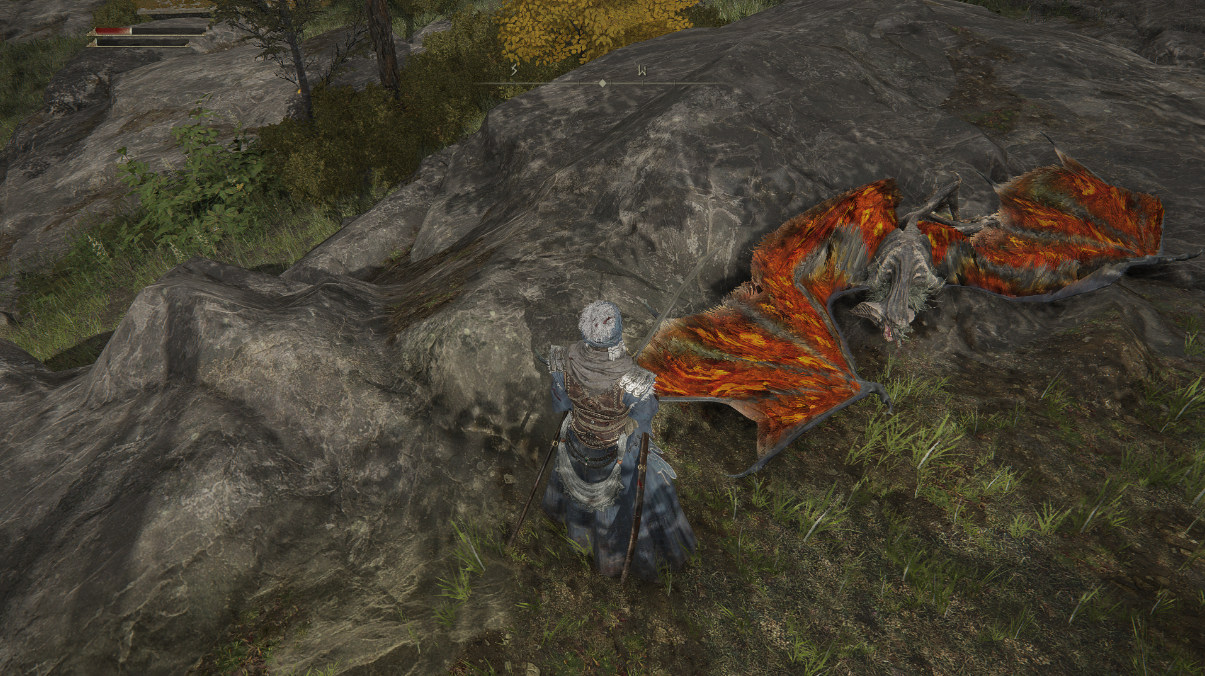
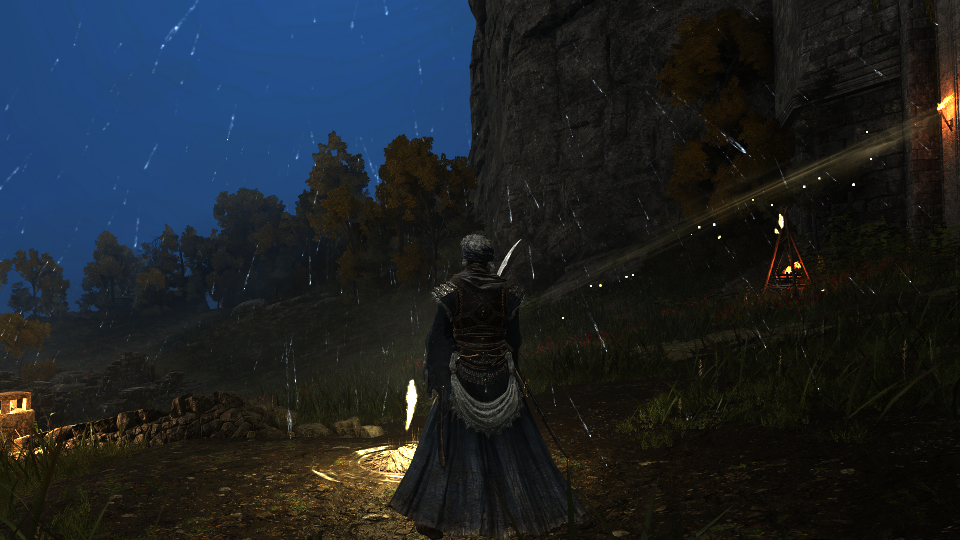
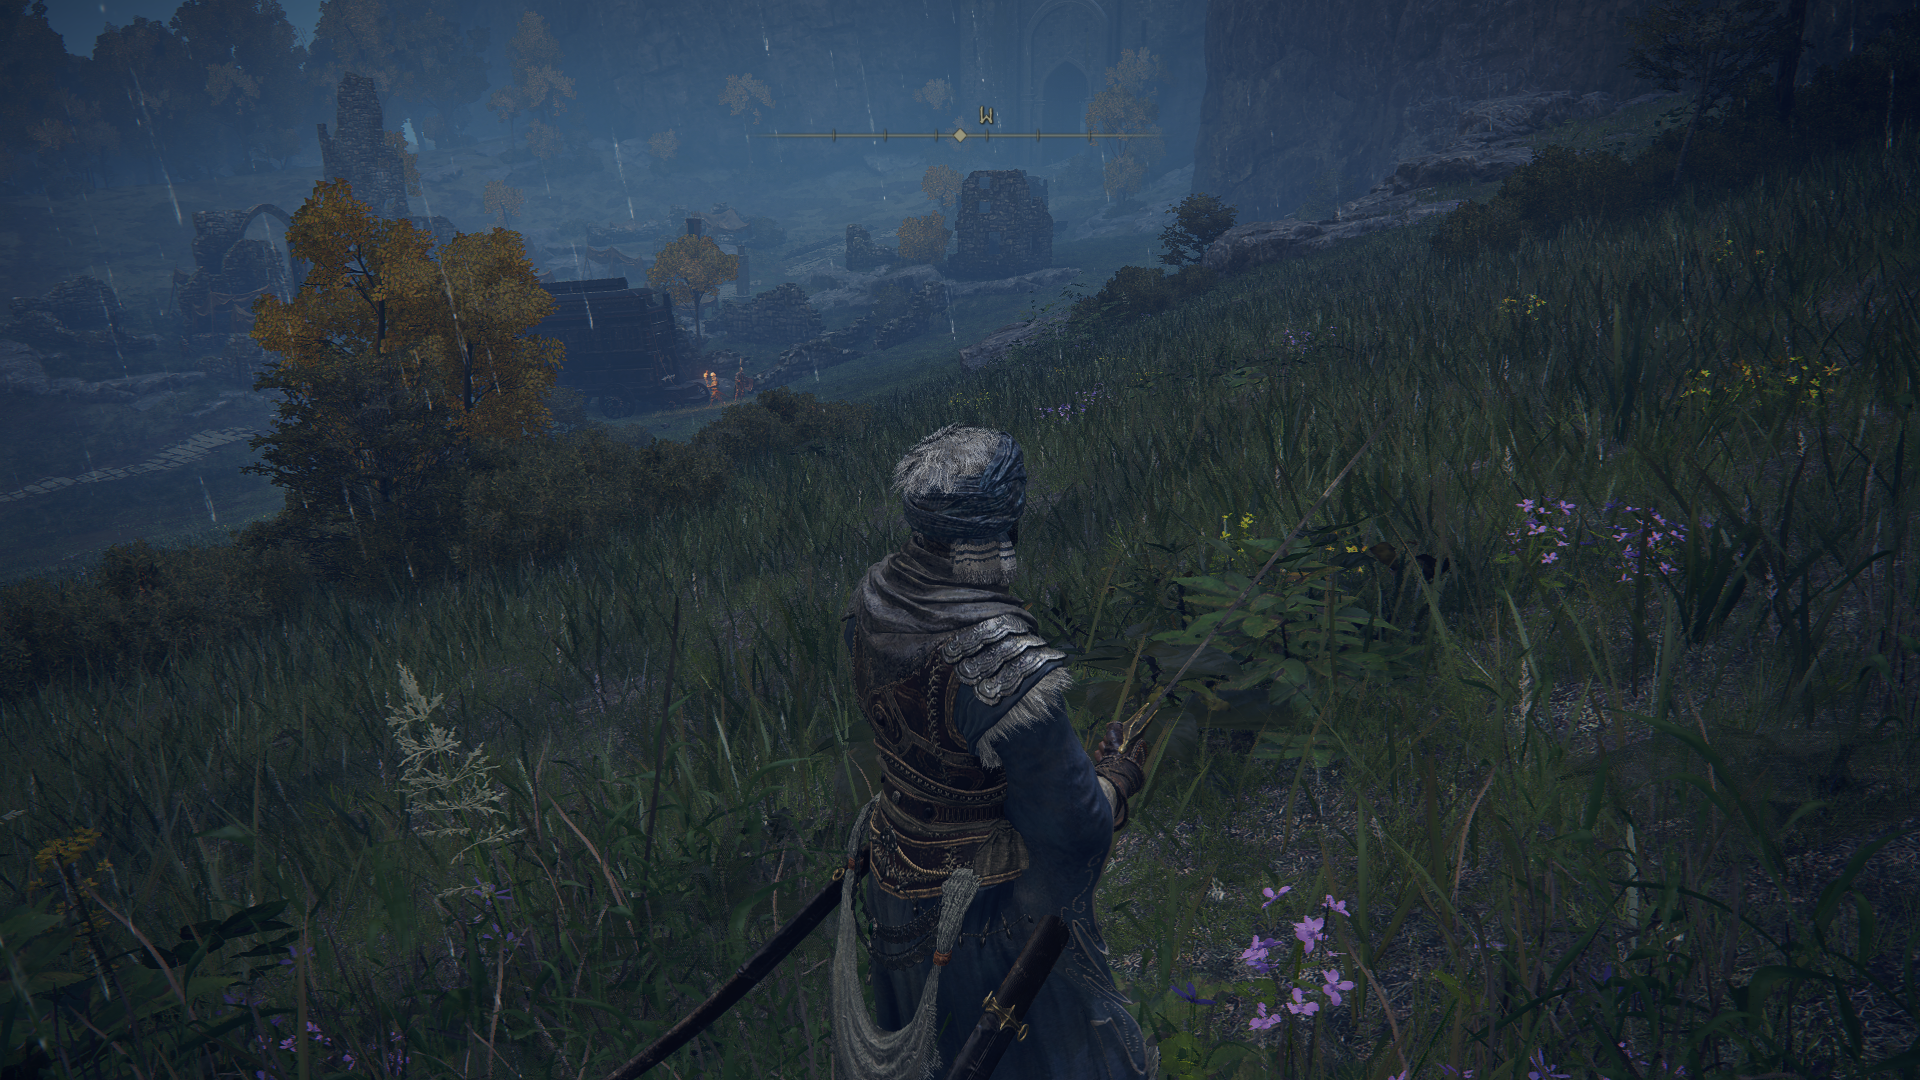
Now come to the most interesting part for the decals of Elden Ring. Decals are used (usually) to handle many detailing things around the scene/world, one of those (as you might have seen before) is defiantly the “foot steps”, and Elden Ring is no difference than any other game. So considering that final frame below, and that given decals of foot steps, can you spot if there is some feet decals in the world, and if there is, where are those feet are projected, and most importantly can you estimate (if possible) from the final given frame, how many foot steps been drawn as decals? Consider it as a Quiz, reveal the answer below whenever you want!


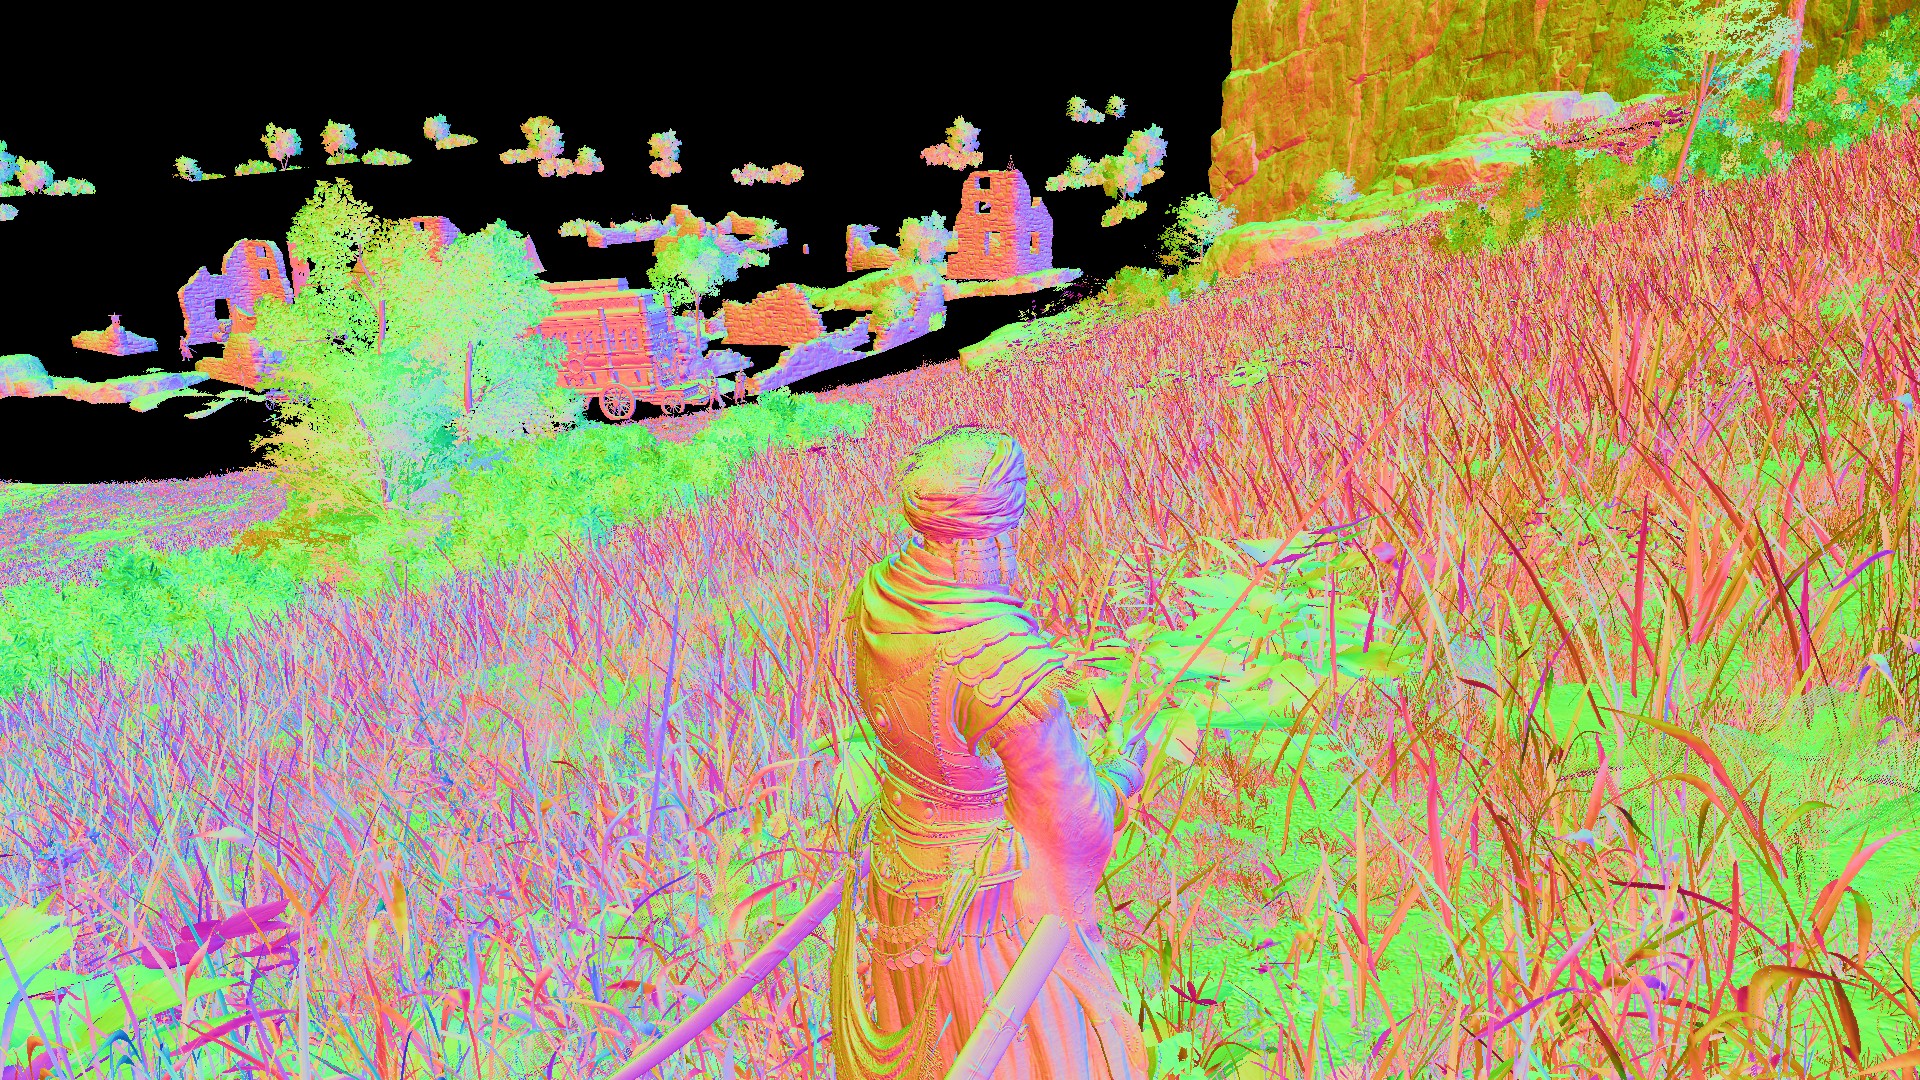
Reveal the Answer
So, you are wrong if you think there is NO foot steps, as a matter of fact, there is more than 60 different foot steps been projected and drawn in that frame, and none of them is visible neither to the player nor in the final frame, they’re all occluded somewhere behind those far trees! The only actual decal you can see in near 70 decals drawing commands, is the blood splatter next to the bird…Decals are not that cheap, and i believe Elden Ring could’ve done better in that regard!
And because i love decals and i love foot steps, and because wherever the mud is, the cool many decals are exist. Below is the life of a Decals GBuffer while in a nice muddy area full of footsteps.
Irradiance & Specular Accumulation
With the GBuffer fully ready in hand, it can be used to do a whole lot of things. At the meantime it will be passed to a shader, alongside the cubemap or IBL texture as the game would refer to it, and the baked IrradianceVolume(XYZW) that will do the required lighting calculations in order to give us the Irradiance RT as well as the Specular Accumulation RT.
Cubemap(IBL) + GBuffer’s ( Normals + Depth + Surface) + Irradiance Volume XYZW = Irradiance RT + Specular Acc RT
Where some areas would have a single cubemap, other areas would have 2 or more cubemaps influencing it.


The animations above showing the baked Irradiance Volume for one area, for this example the volume was 72 slices, but that number varies based on the volume size, it can be more (over 100 slices) and can go less (20 slices or less), it depends on the volume size. Those Irradiance bakes usually BC7_UNORM, but the dimensions also vary as the slices count, for this example case it was 120*124.
And of course same case as cubemaps, where some areas will have a single volume, other areas would have more than one volume, it depends on the “space” you looking at.


So, those two things, (IBL + Irradiance Bakes) in addition to the GBuffer, results on the Irradiance RT as well as the Specular Accumulation RT.
And a Cinematic frame is no difference…All inputs are exactly the same, i was hoping for “higher” resolution cubemap or something for cinematics, but nope, just same exact thing..
Depth Down-Sampling
Depth Down-Sampling takes place two times. Once here (Graphics Queue), and once in the Compute Queue. The one here (yet) is not justified, and the output not used, but it was worth mentioning as it is an exist step here! The other step called “Depth Downsampling” is at compute is the one that is actually used, and will know later.


SSAO
SSAO generation happens in 3 steps. Here are 2 frame examples
1.Generate SSAO + Rotations
Using the 1/2 Depth we got in hand already + the Normal render target as well as a “Random Rotations” helper texture, we get a new SSAO render target.


That new SSAO is packed texture. The actual SSAO is in the R channel, where the A channel is mask for SSAO (think about it as the skybox mask, practically, it’s the only thing that we can’t apply SSAO to it). G channels holds random rotations for sample kernel at each pixel. And the B channel i believe is for the “range check” that helps preventing wrong occlusion occurrences.


2.Previous VS Current frame
Do sort of interpolation (temporal-ing) between previous’ frame’s SSAO and current frame’s

3.Final SSAO Render Target
The current packed SSAO is still in 1/2 target resolution. So in this step the game would generate the final grayscale SSAO render target that will be used by converting format and blitting to scale the new render target to the full screen target resolution.

This entire process is done int he fragment shader (sadly) and using the following set of params
SSAO Param
struct SSAOParam
{
	float4 g_vDepthComputeParam;
	float4 g_vAOScaleOffset;
	float4 g_vBlendScale;
}
SSAO Param 2
struct SSAOParam2
{
	float4x4 g_mInvProj;
	float4 g_vScreenSize;
	float4x4 g_mView;
	float4 g_vAOScaleOffset2;
	float4 g_vSampleRangeParam;
	float4x4 g_mCurToPrevScreen;
	float4 g_vPrevFrameStrengh;
	float4 g_vMiscParam;                //loved the name!!!
	float4 g_vDepthRangeParam;
}
Post Process Common
struct PostProcessCommon
{
	float2 g_dynamicScreenPercentage;
	float2 g_texSizeReciprocal;
	float2 g_dynamicScreenPercentage_Primary;
	float2 g_primaryTexSizeReciprocal;
	float2 g_dynamicScreenPercentage_Prev;
	float2 g_prevTexSizeReciprocal;
	float2 g_dynamicScreenPercentage_PrevPrimary;
	float2 g_prevPrimaryTexSizeReciprocal;
}
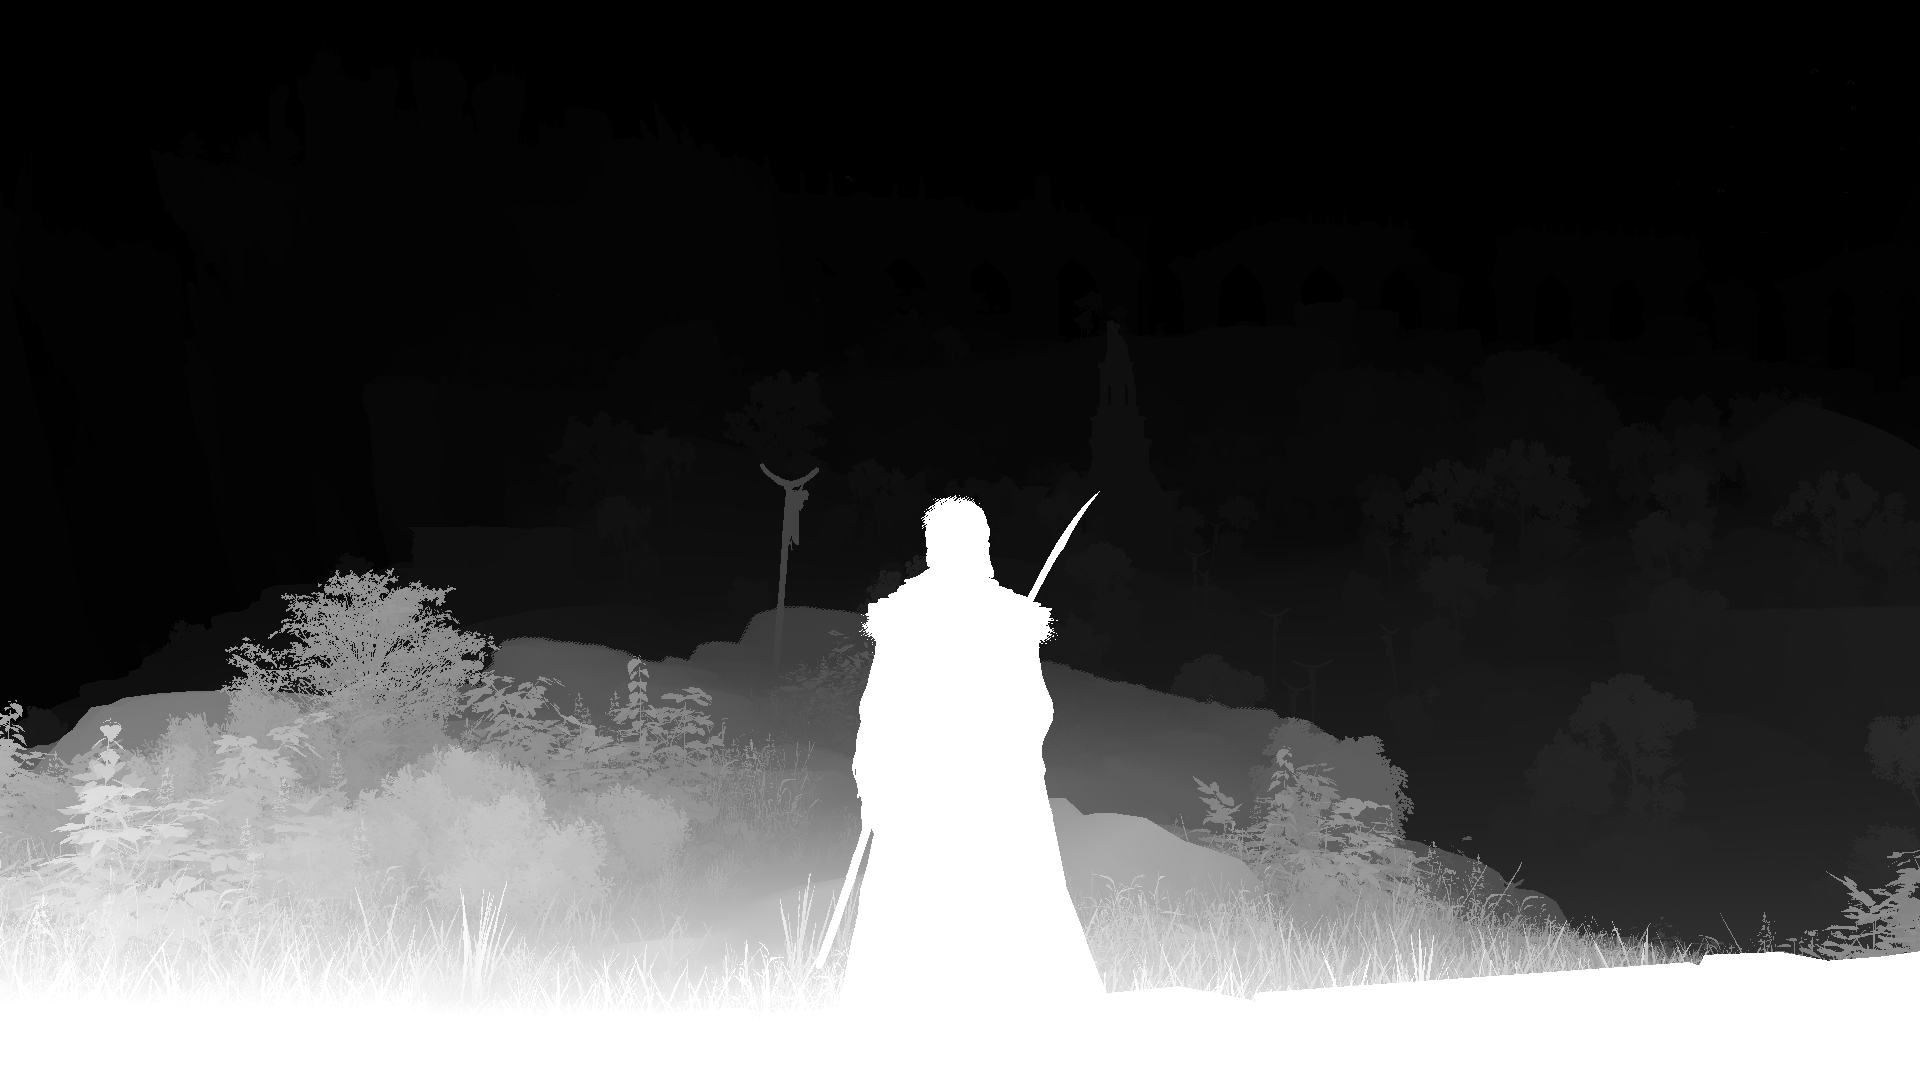
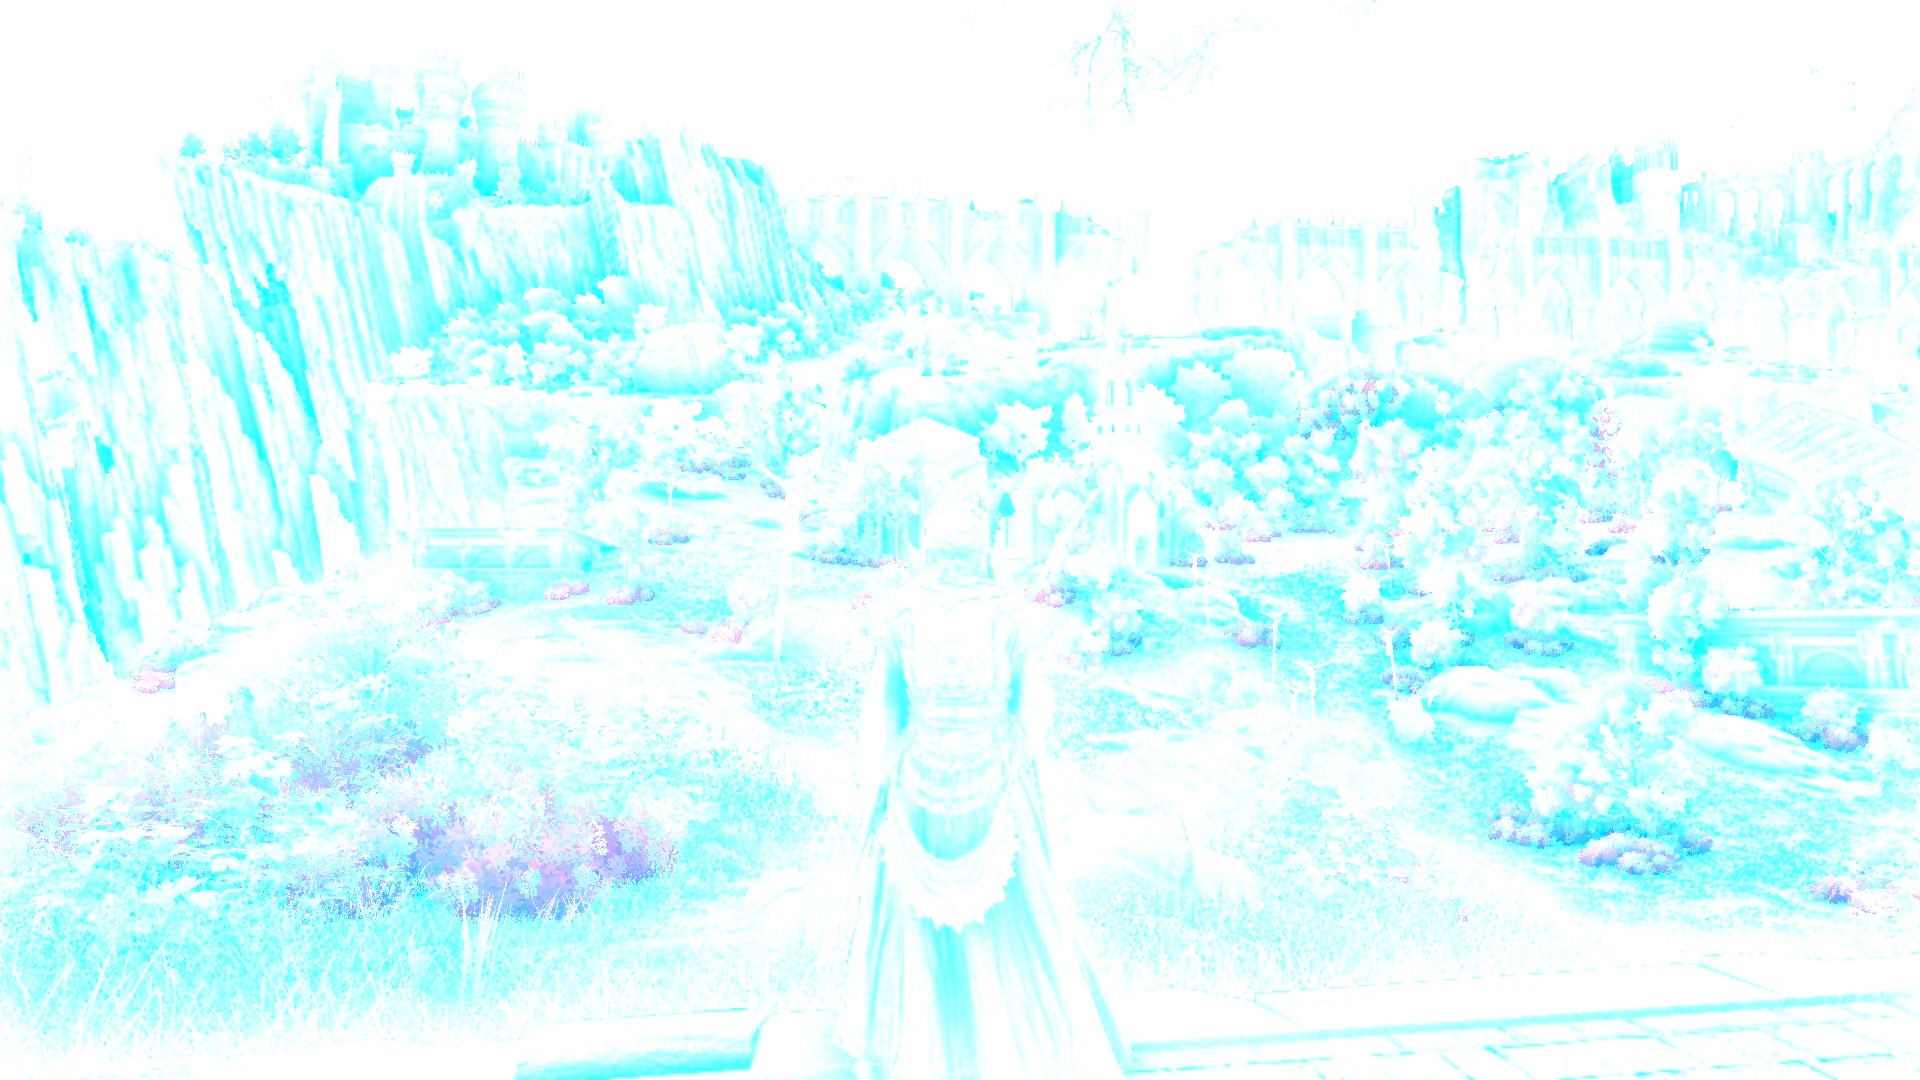
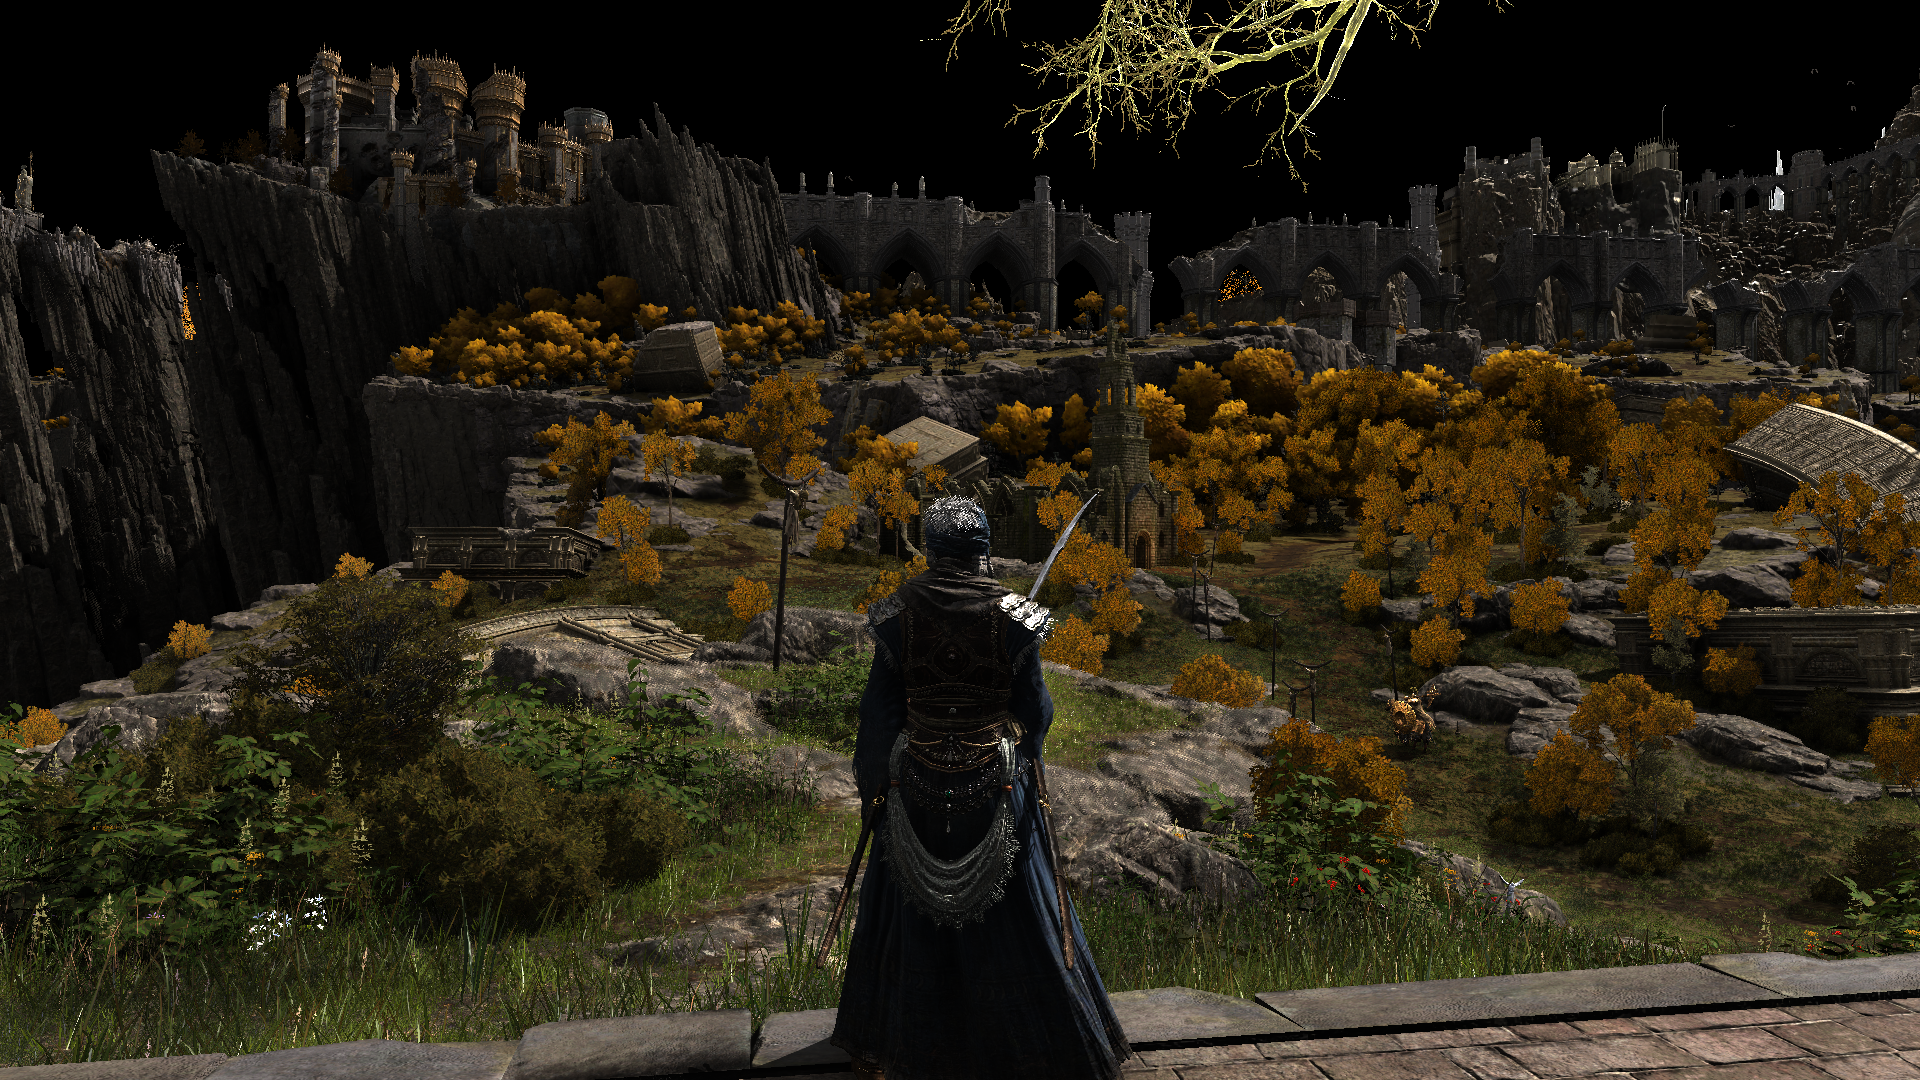
Composite Shadow
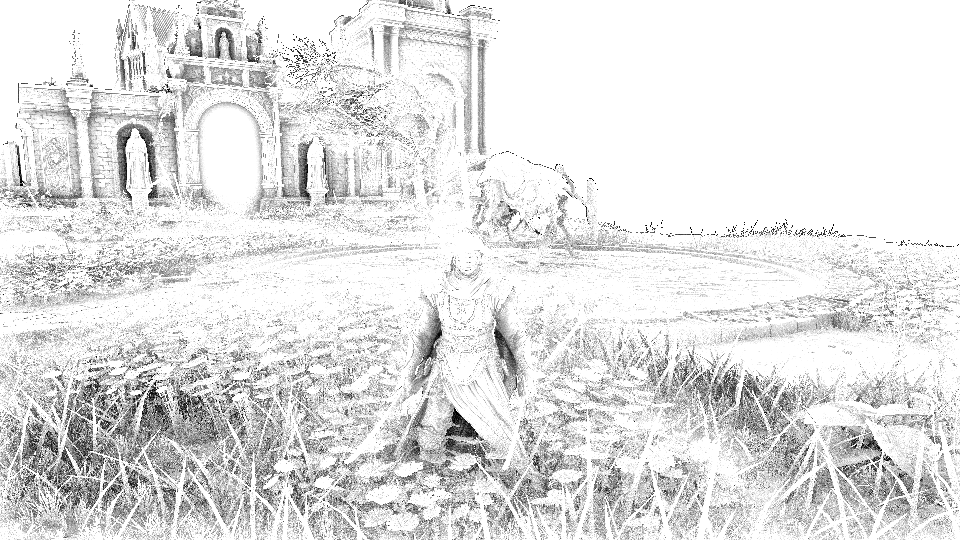
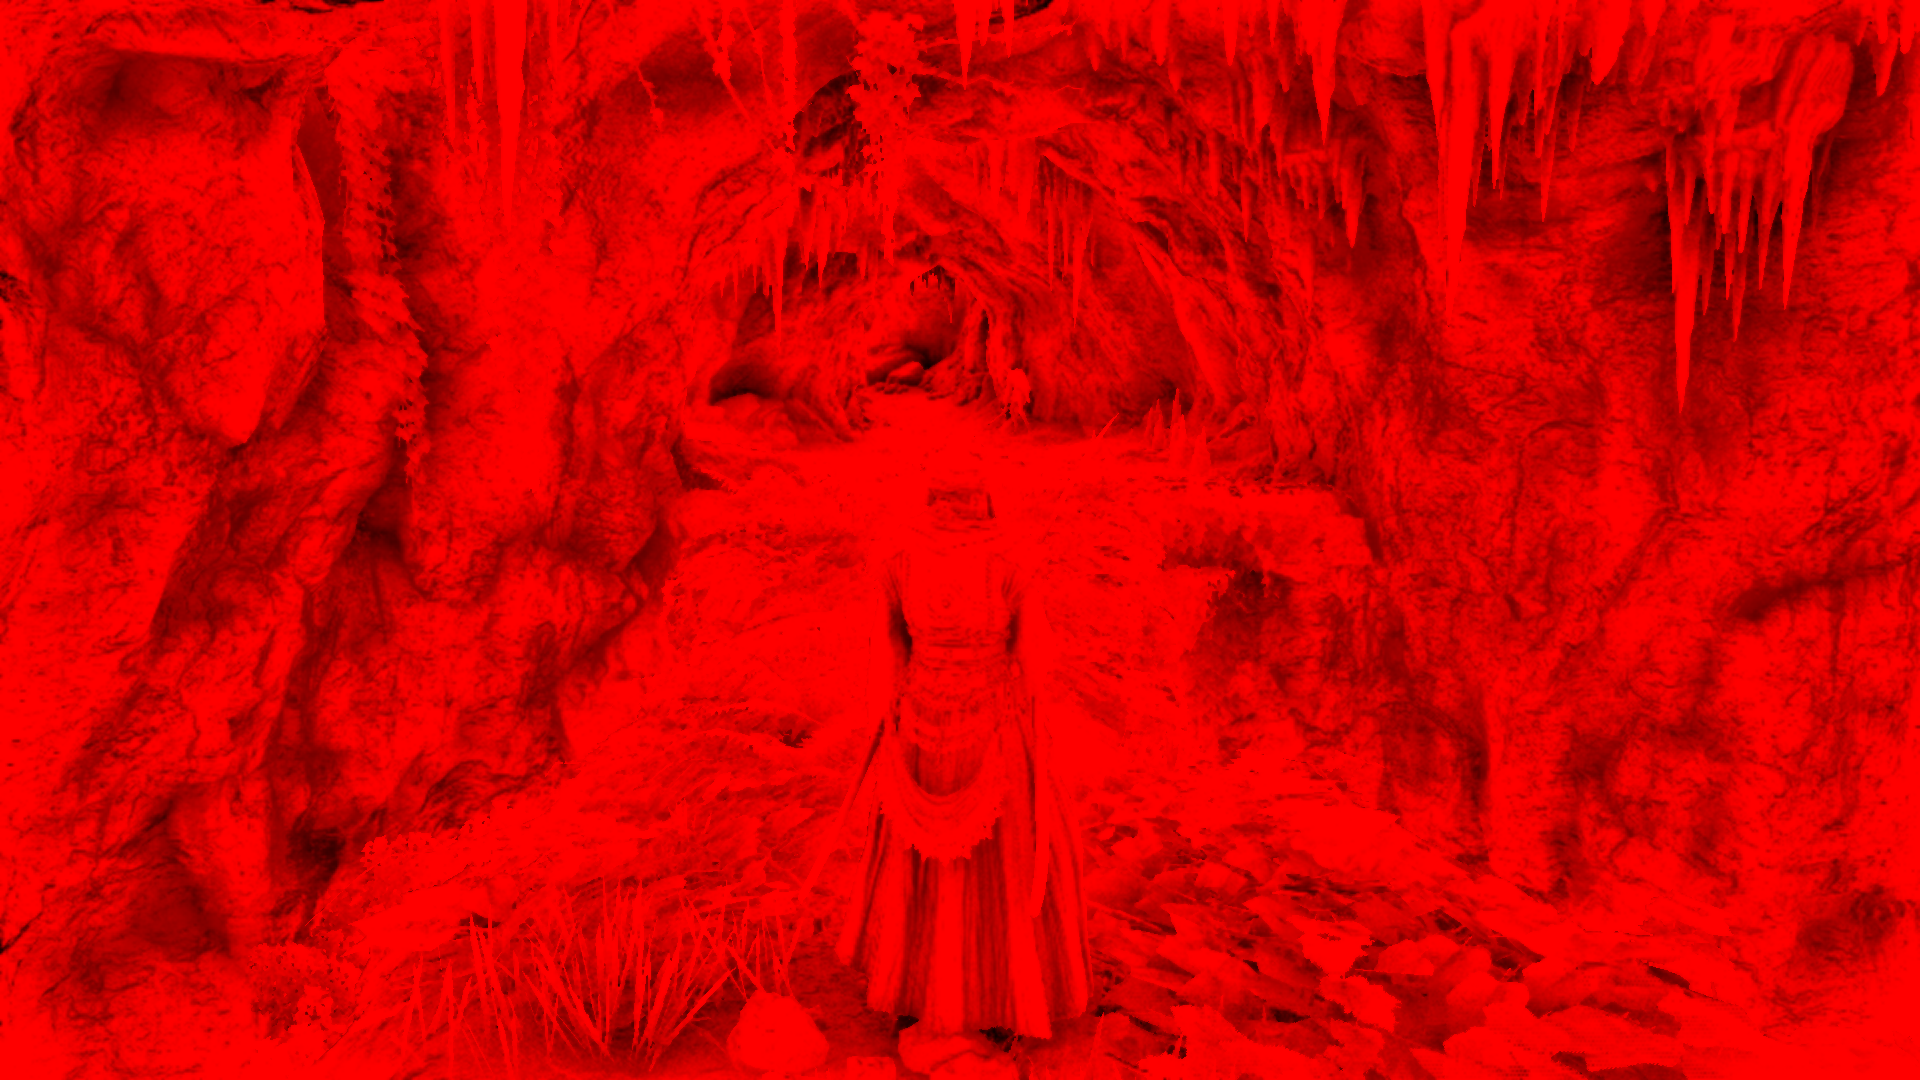
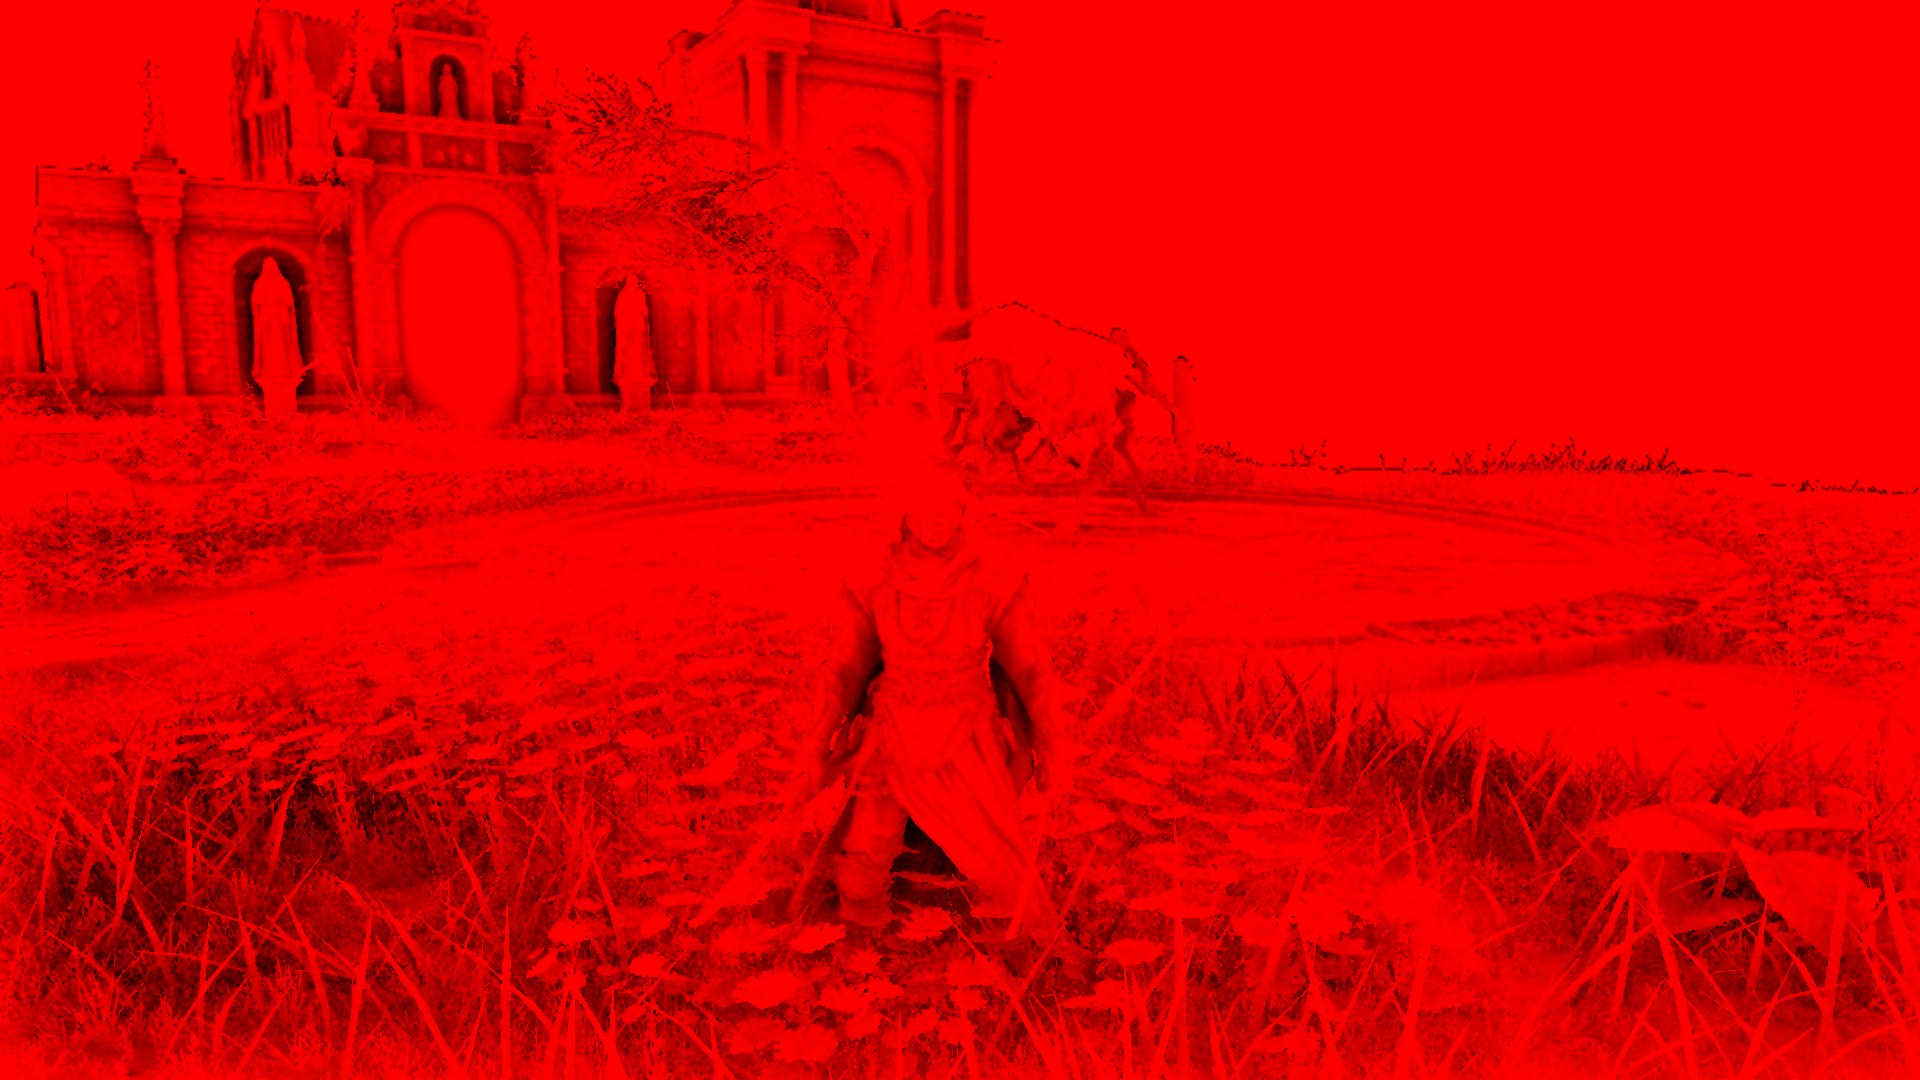
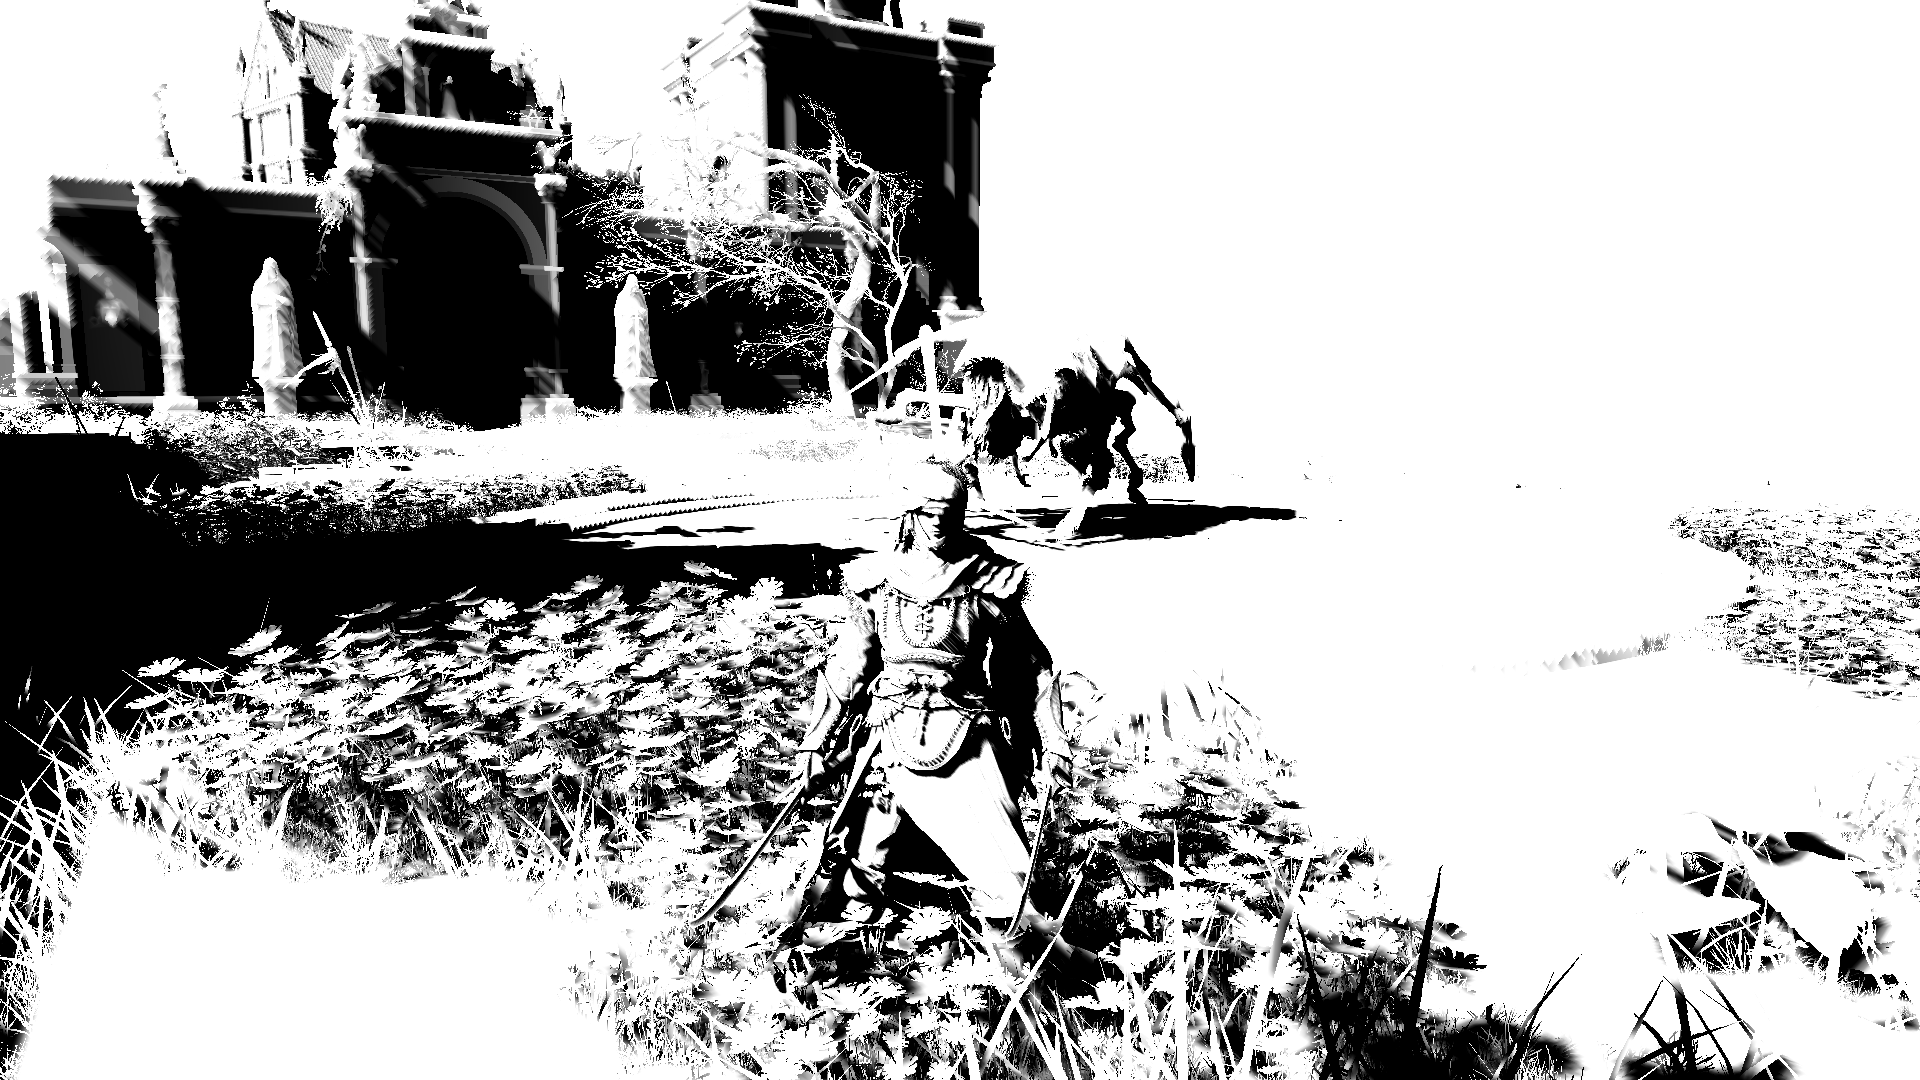
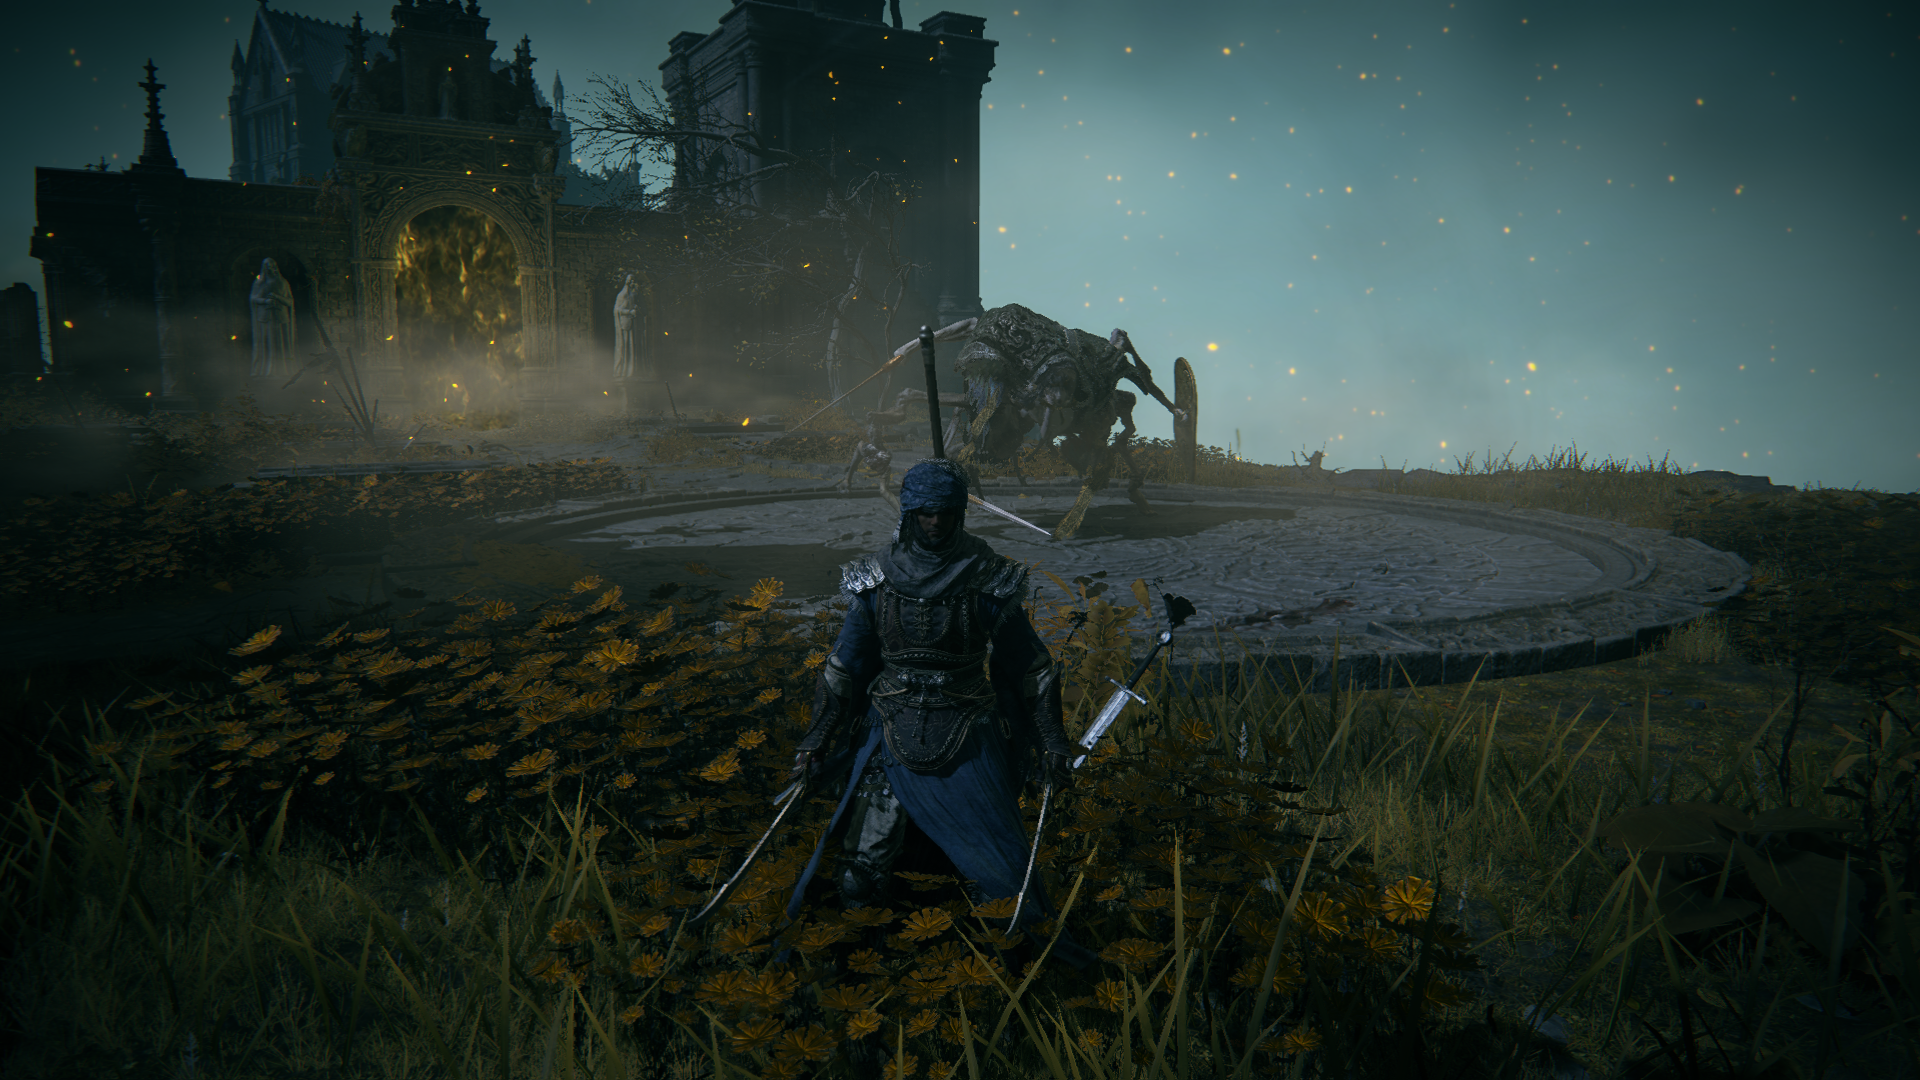
Given the SSAO we’ve in hand with the GBuffer’s surface definition we had previously (remember, it was holding Metallic, roughness as well as SHADOWS in the RGB channels), a composite shader runs to give us a new render target used as the Composite Shadow Mask


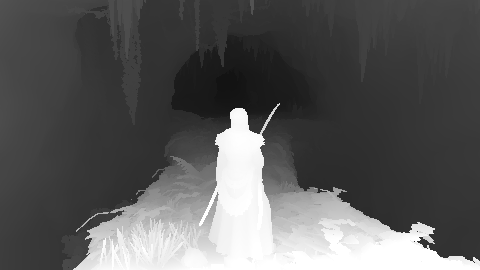
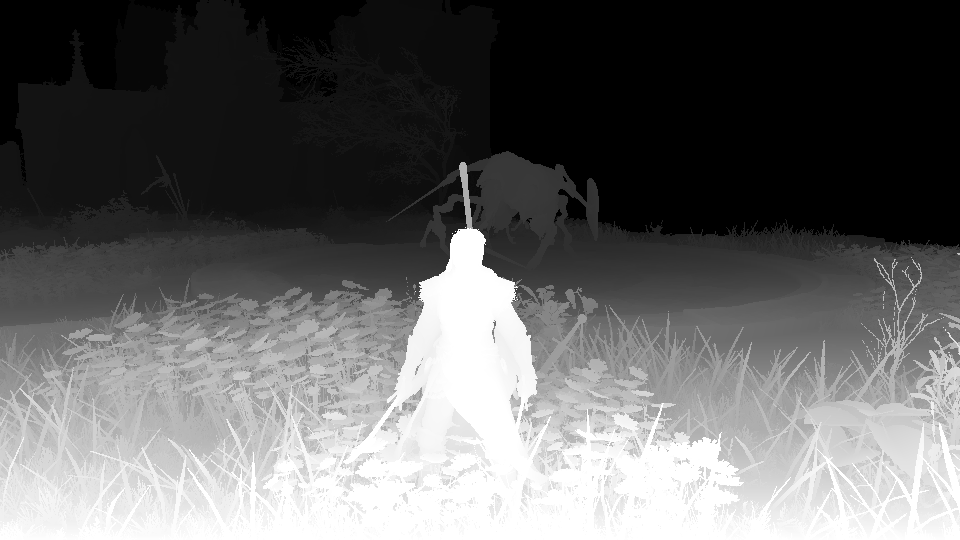
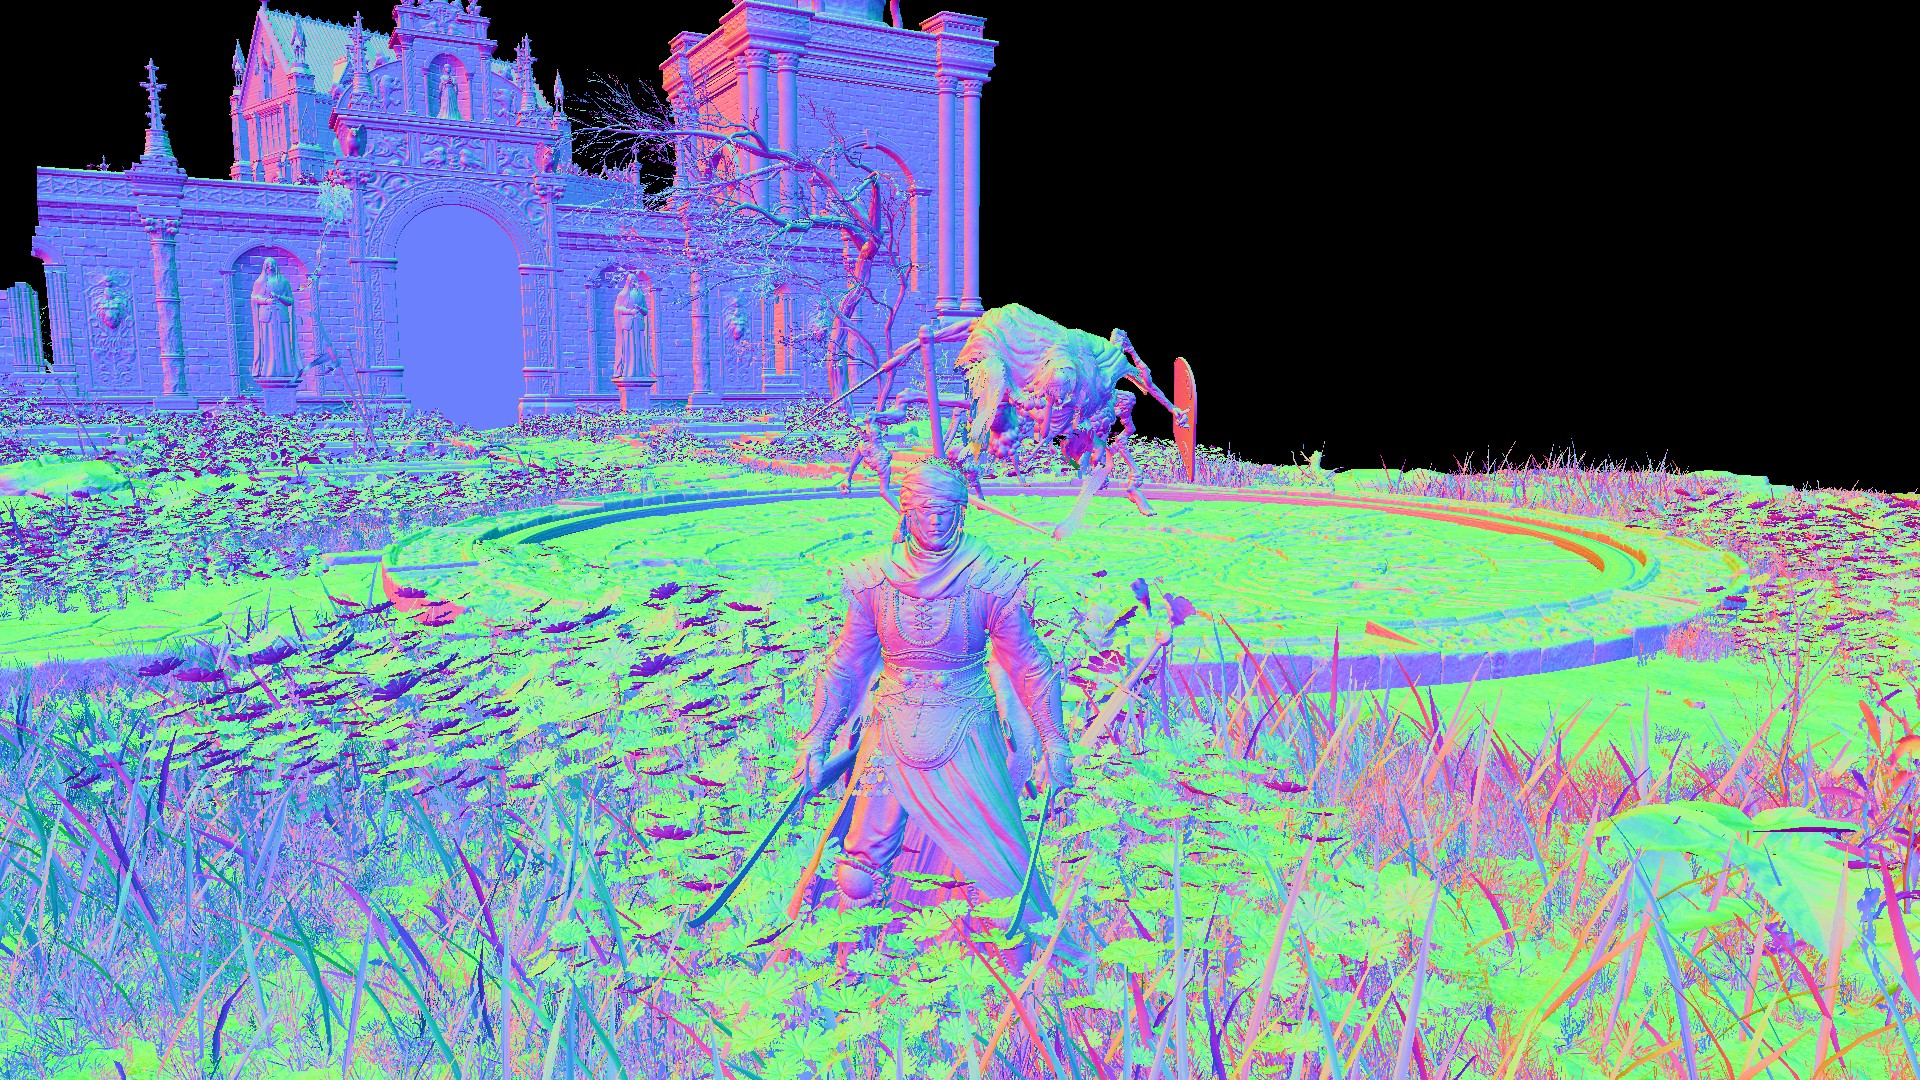
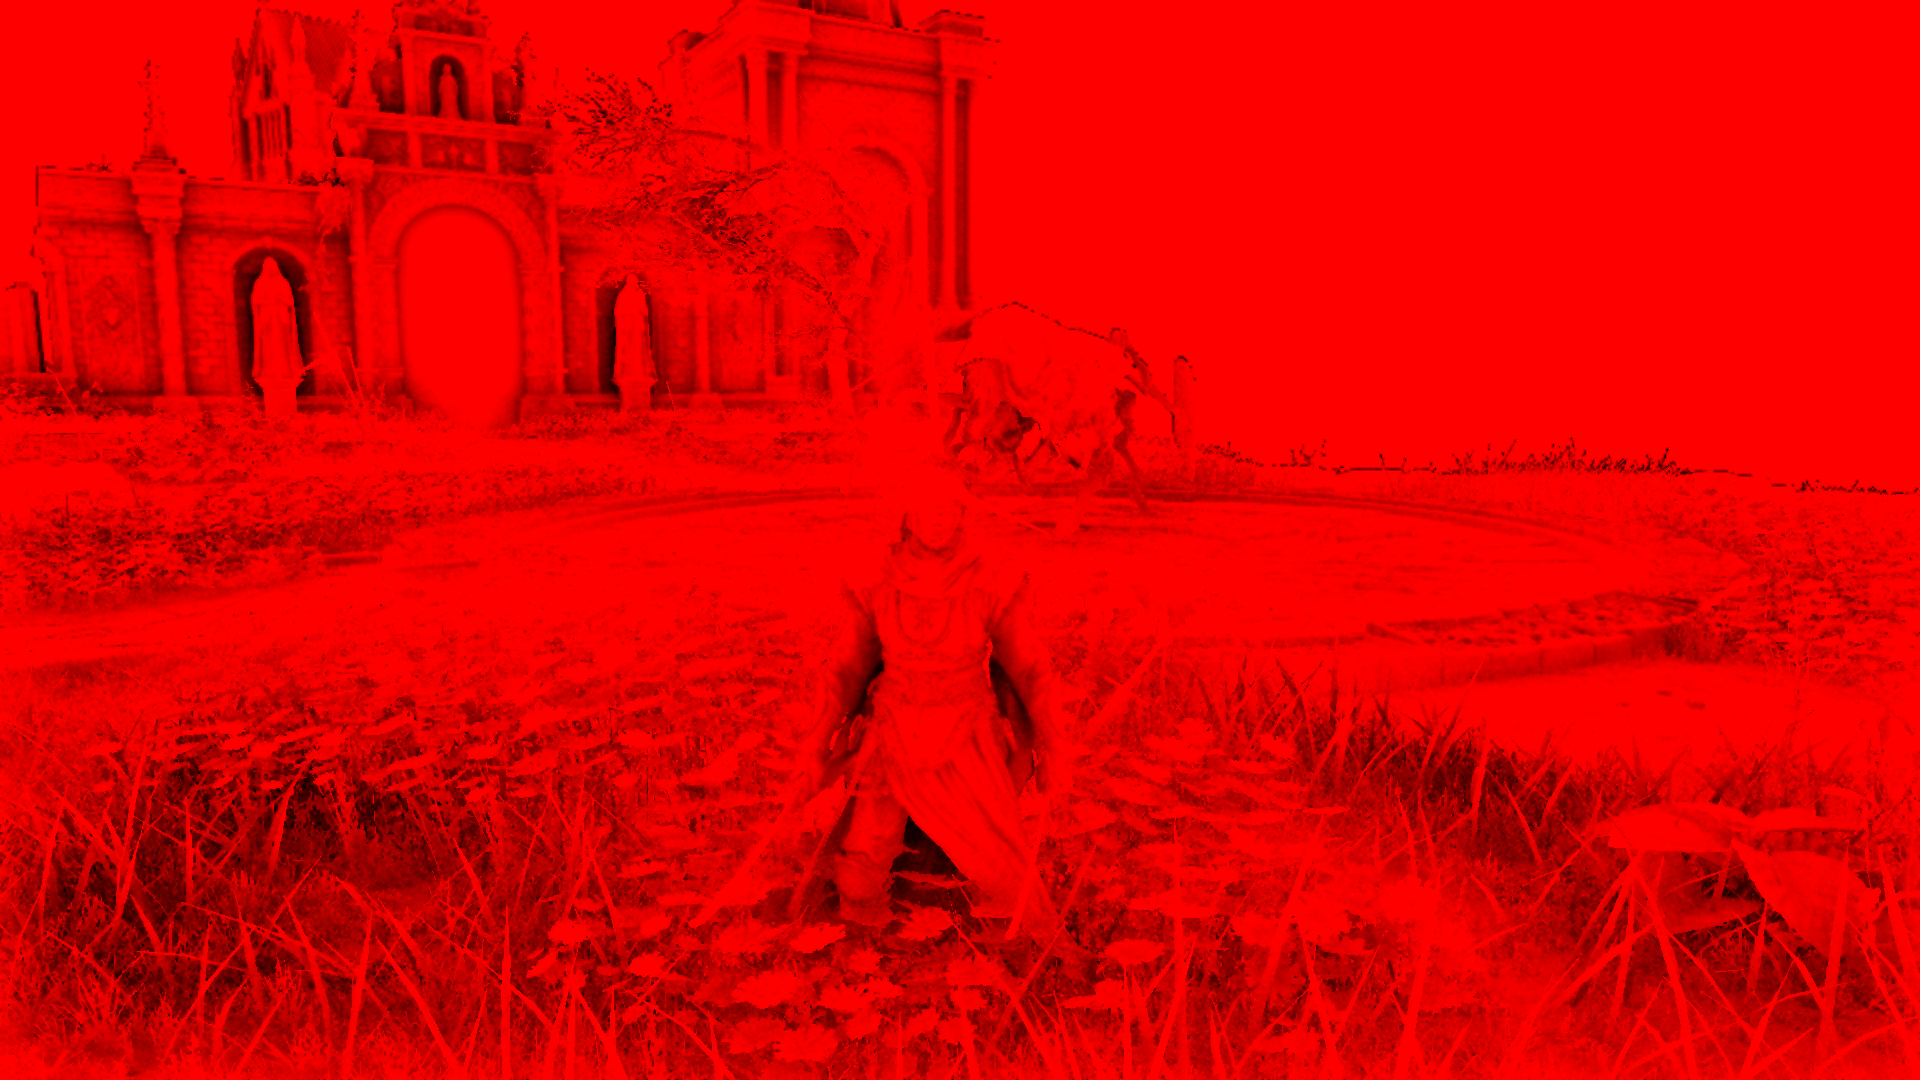
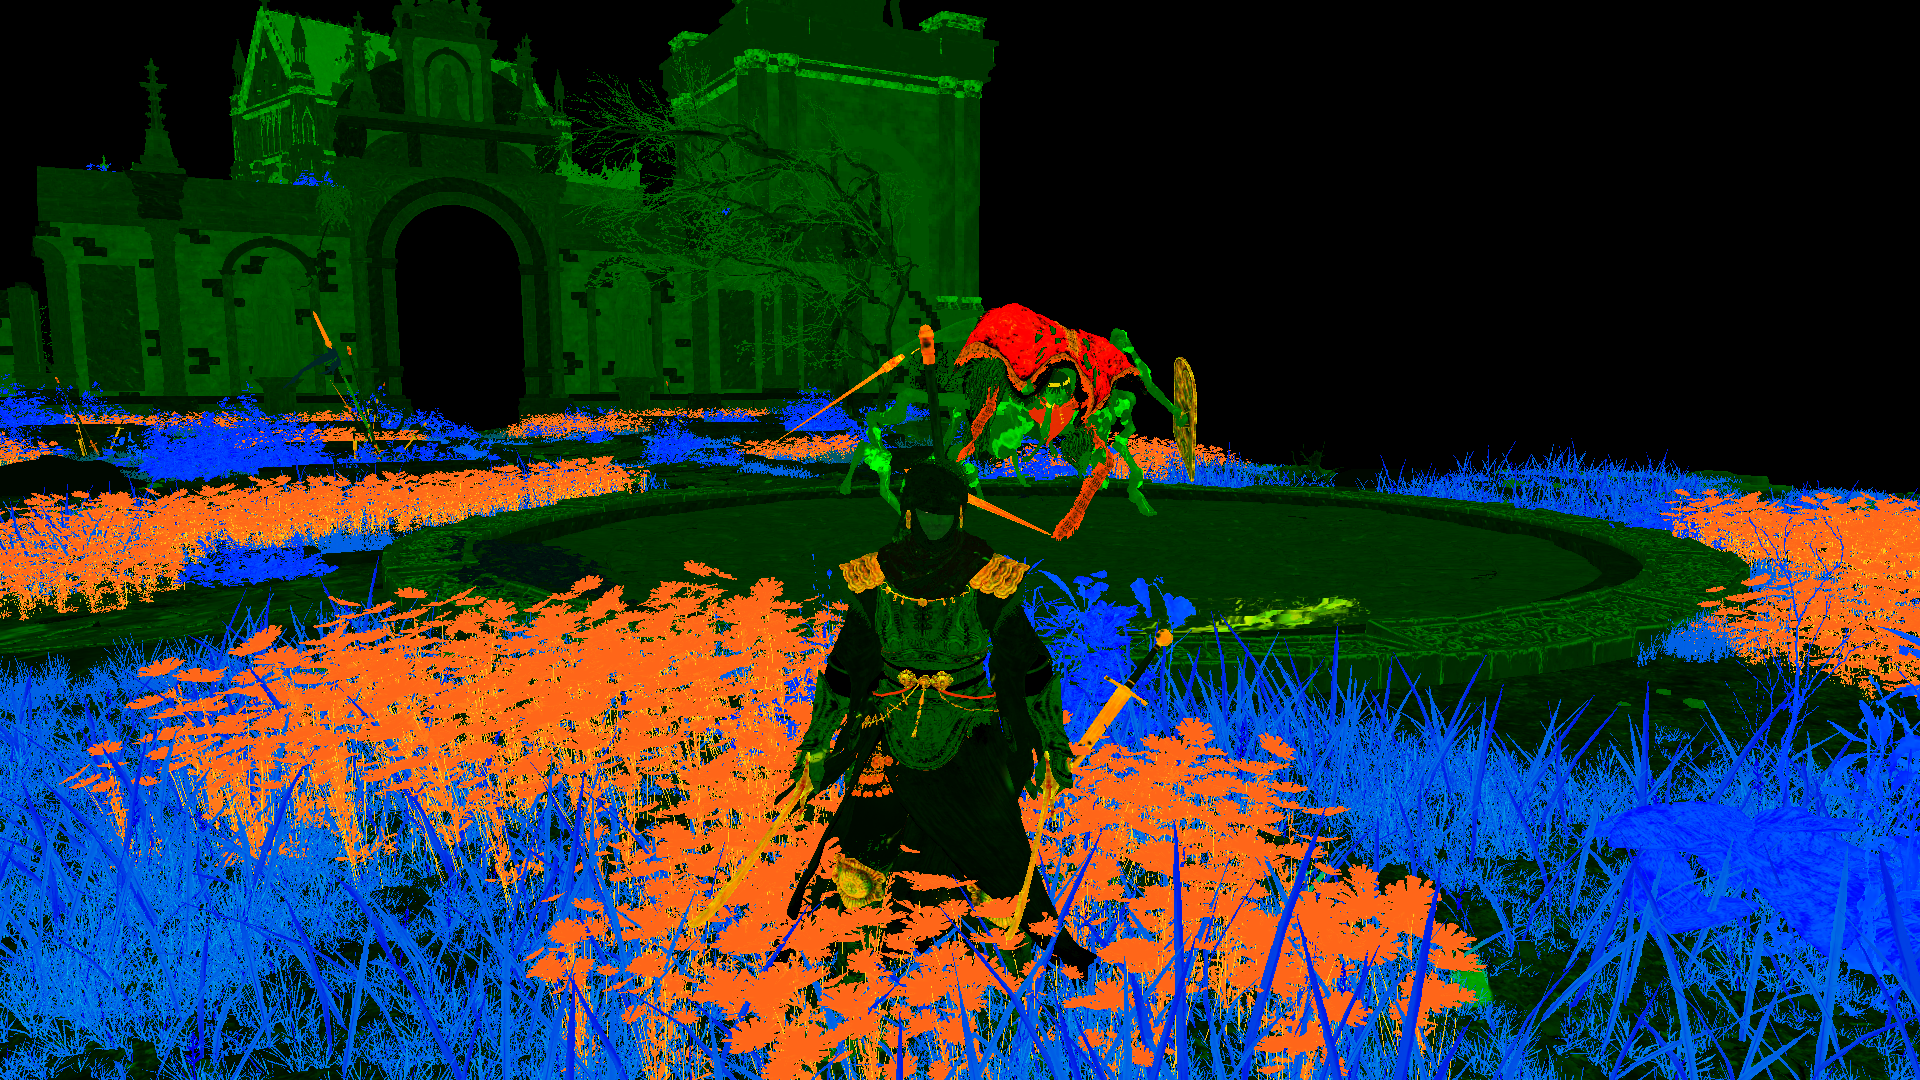
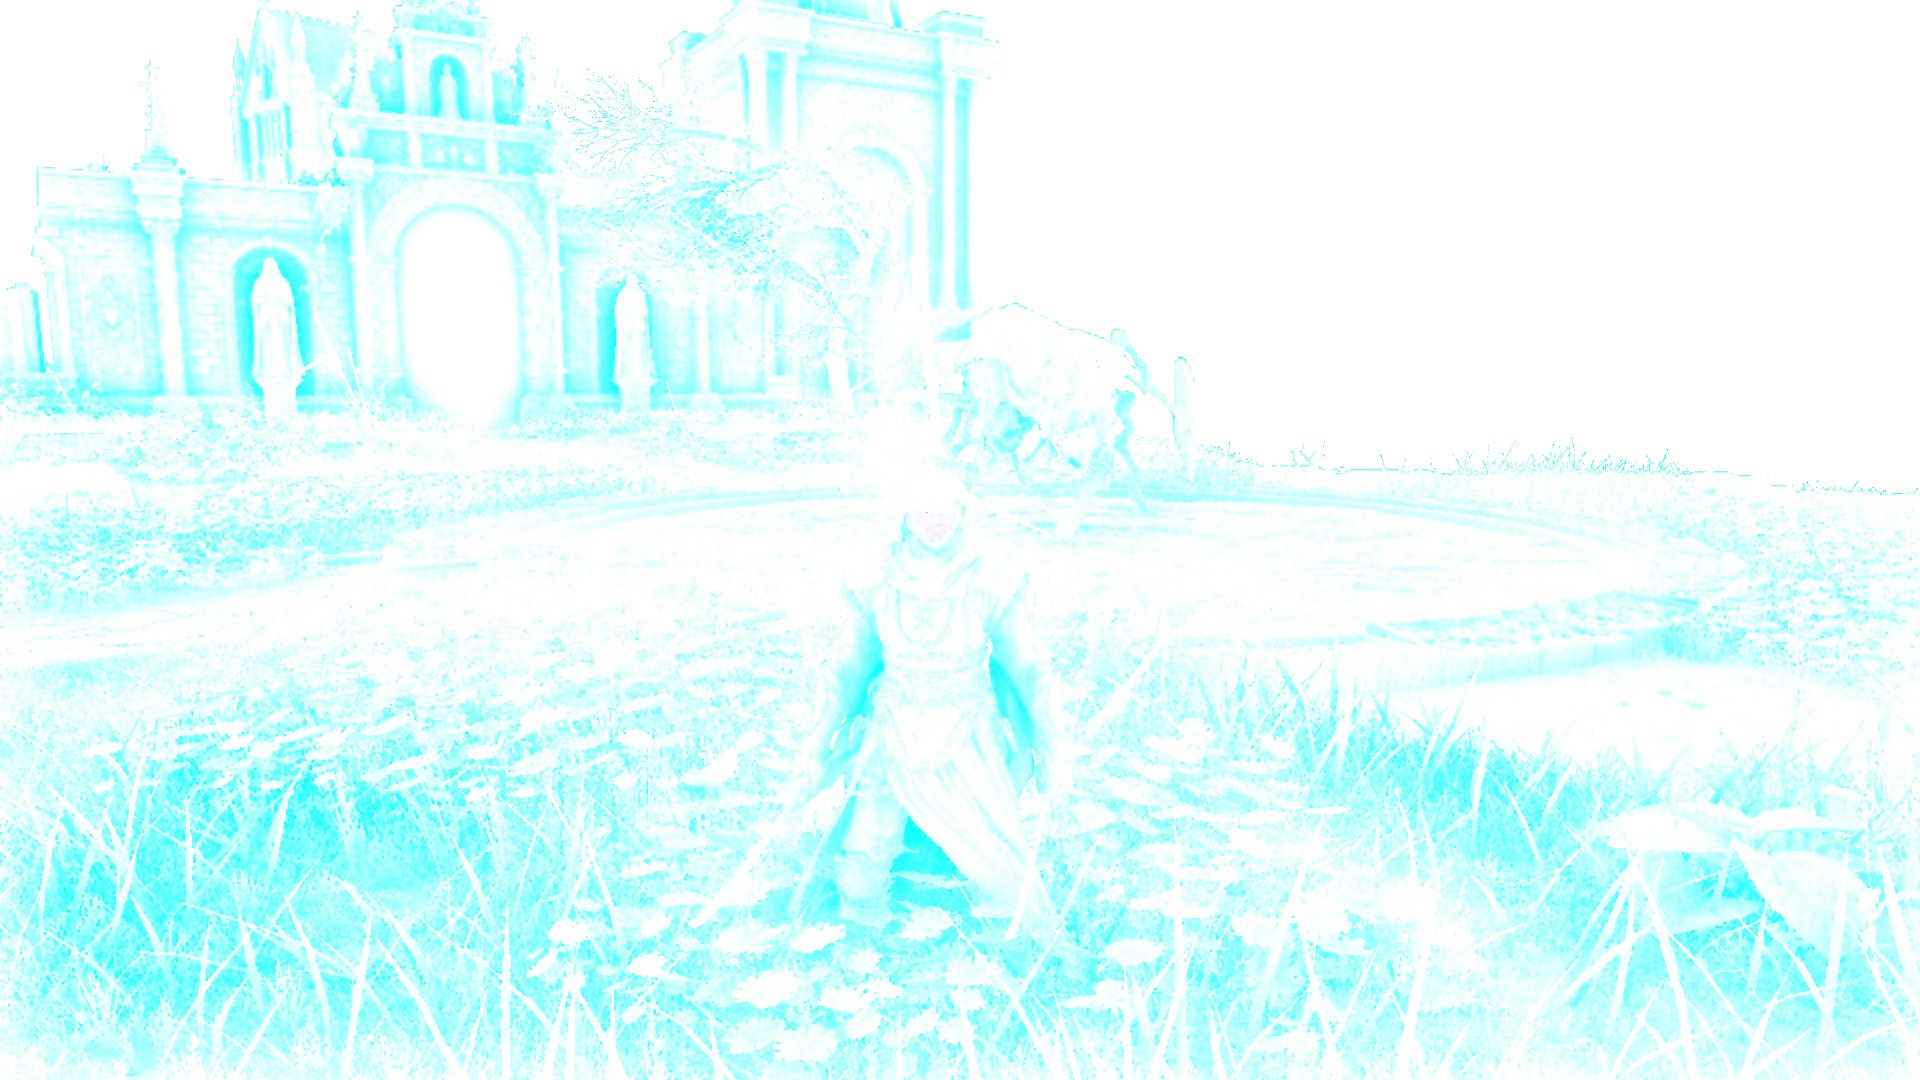
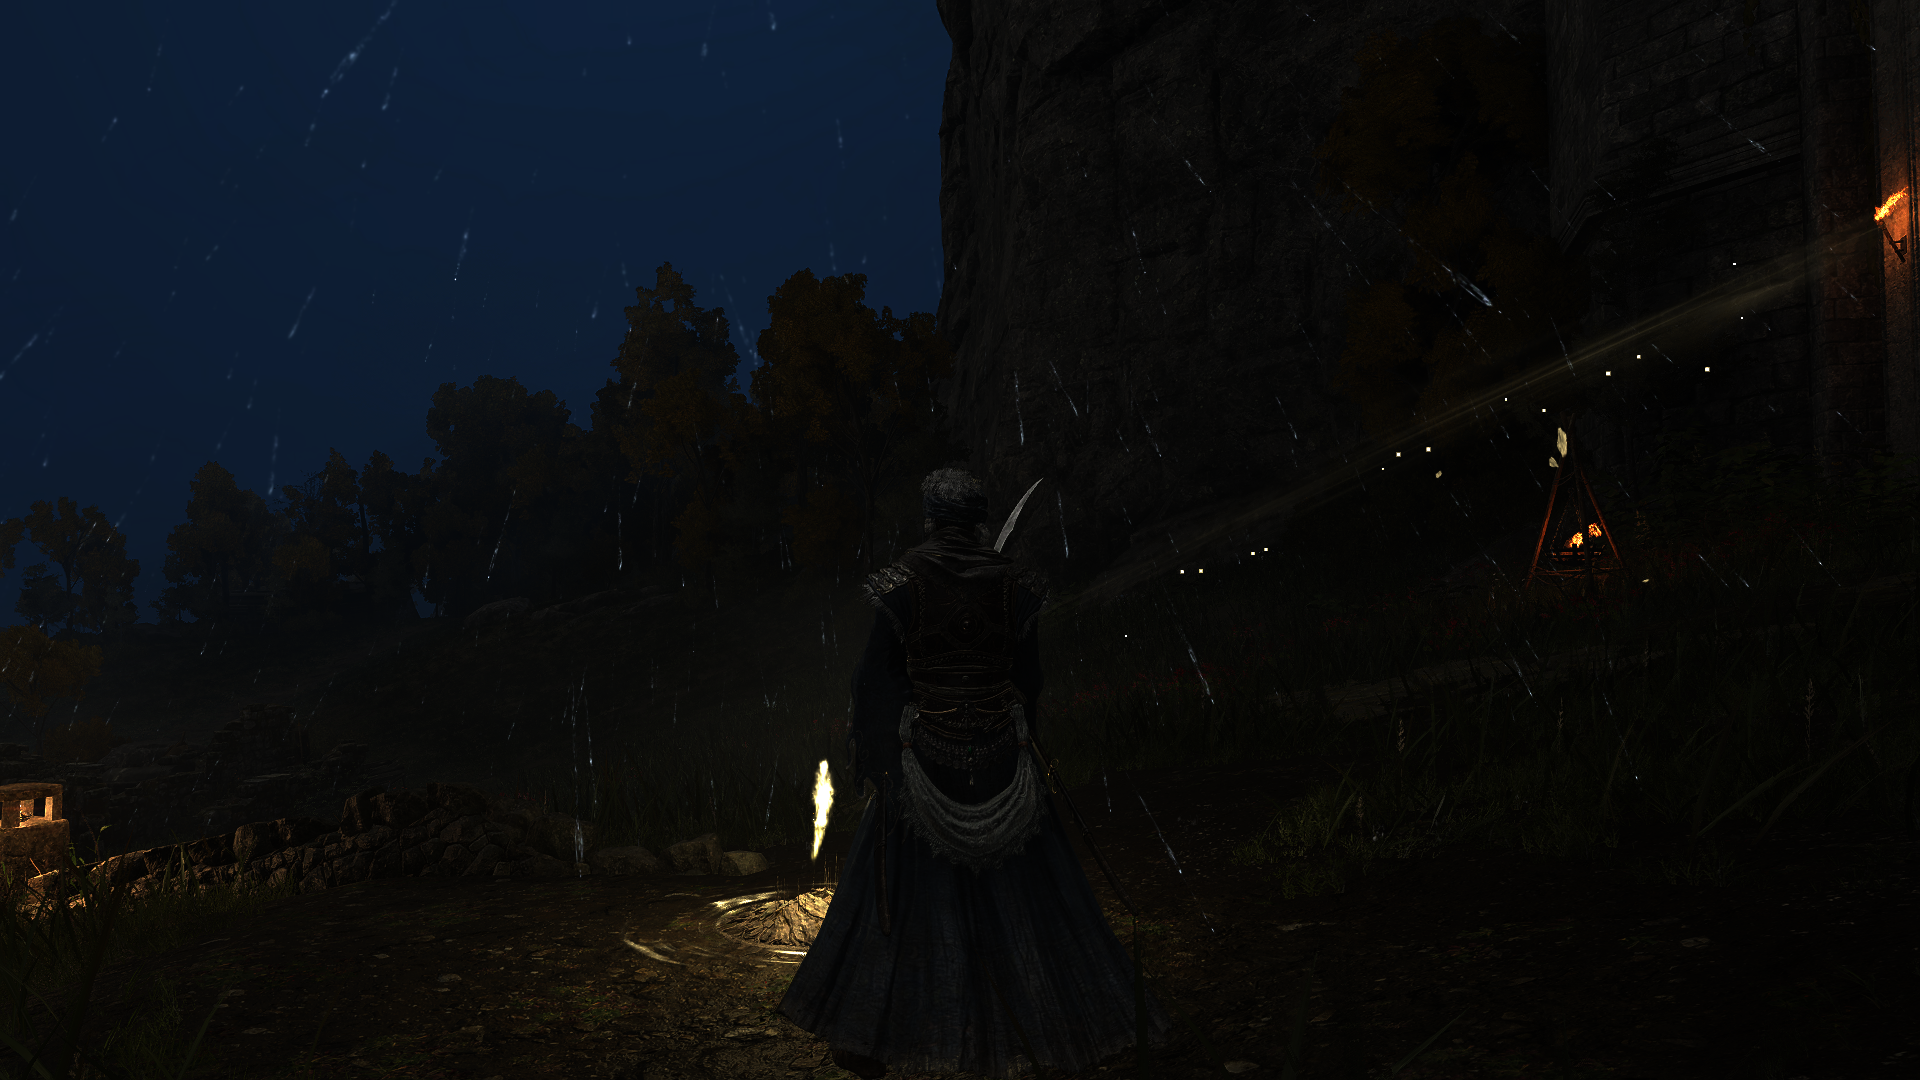
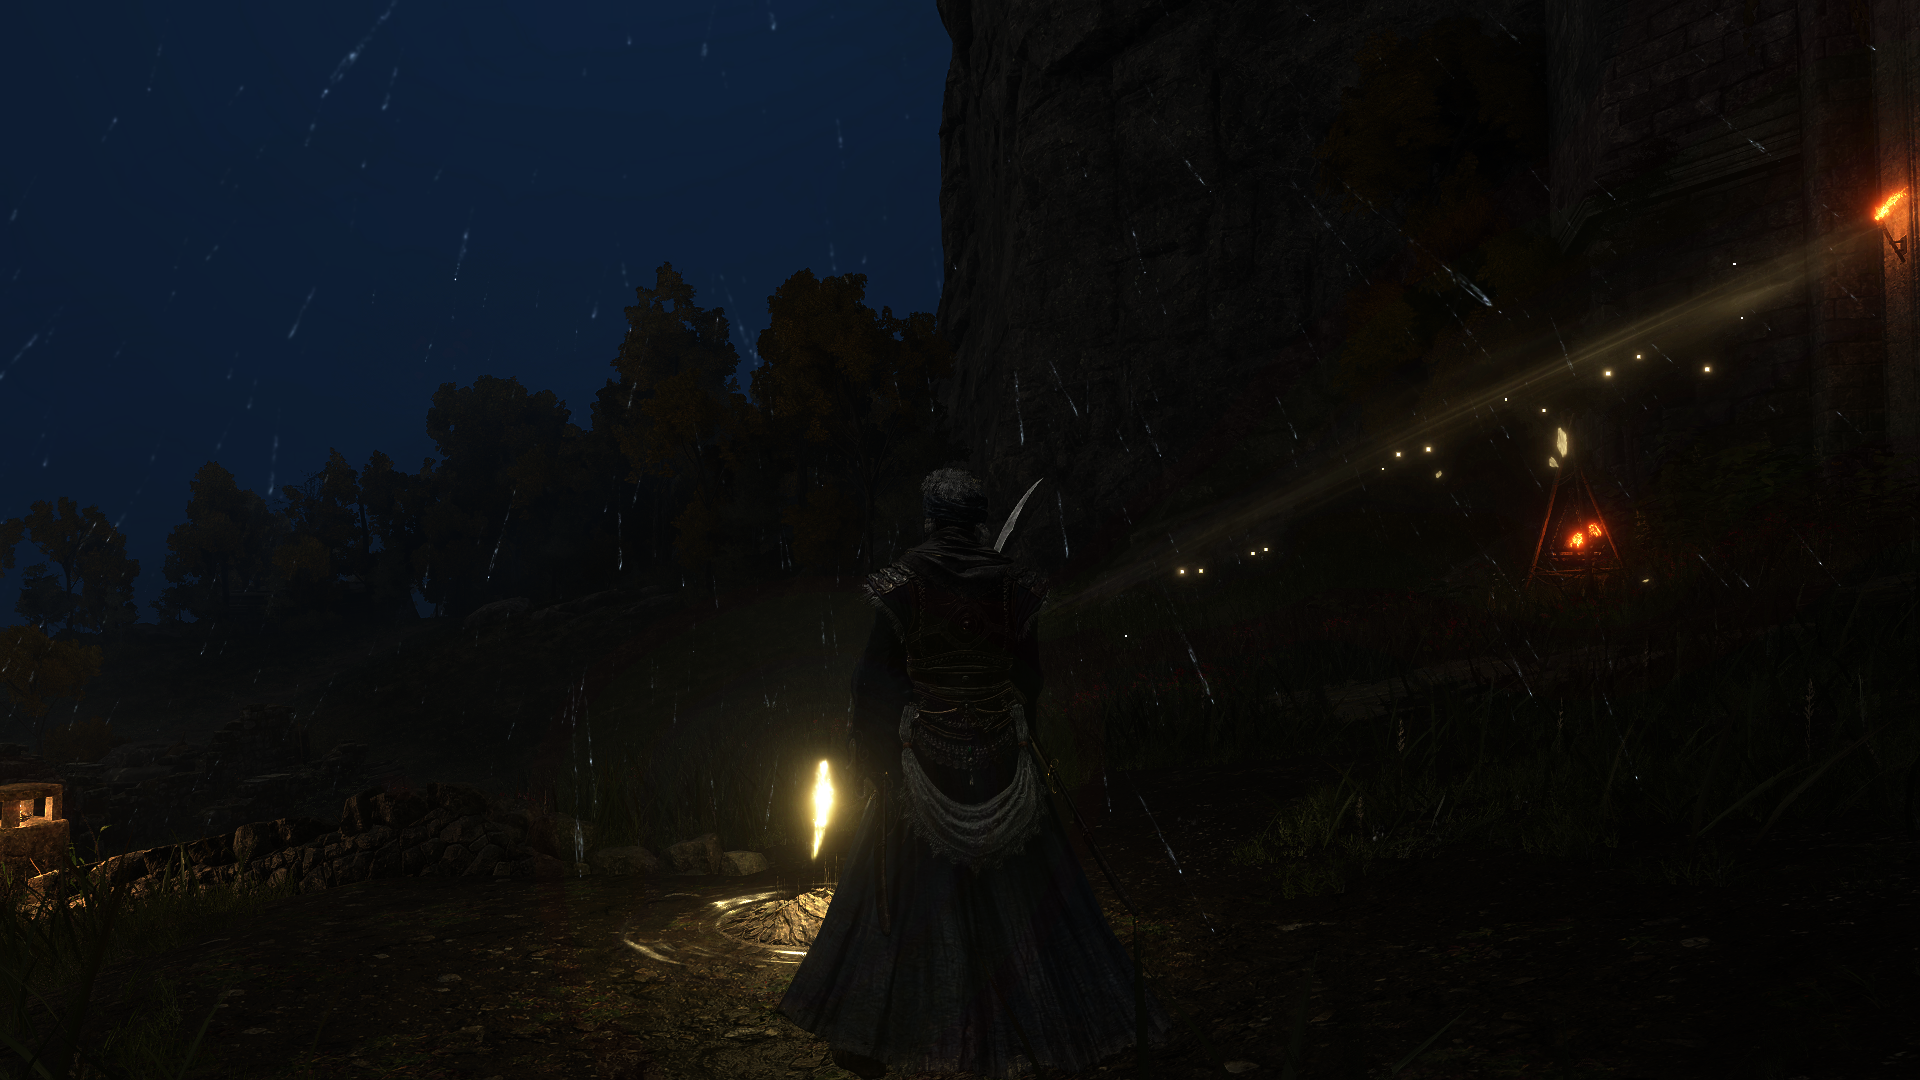
Now here is the trick, i wanted to show the A channel of the final Shadow Composite output, because this is where actually the data about shadow are stored. You see that the A channel is fully solid black, and this make sense, if you look to the final frame in details, you would notice that it is lacking for any type of direct sunlight shadows, it only rely on the SSAO to darken and shade areas. Where if you look to another example (below) of an exterior frame that is in the direct sun light, you can find that the A channel of the Shadow Composite output is holding all the shadow details that are present in the final swapchain frame (under Godrick, on the building, under the flowers, on the arena floor itself,…etc.).
Regarding the composite shader input params, it’s very simple…
Composite Shadow Mask
struct CompositeShadowMask
{
	float4 FC_Mult;
	float4 FC_Add;
}
Put All Together
Using the Irradiance + Specular render targets on top of the GBuffer (4 Render Targets + Depth) + Shadow Mask+ the Light Lookup + Light Buffers (Spot + Point) with some usual PBR and math in the fragment shader, we can get something colorful and ready for post processing.

Environment Map Mesh
Cubemap Gen (Multiple Times)
Nothing important here, more details in Compute’s section “Cubemap Generation”.
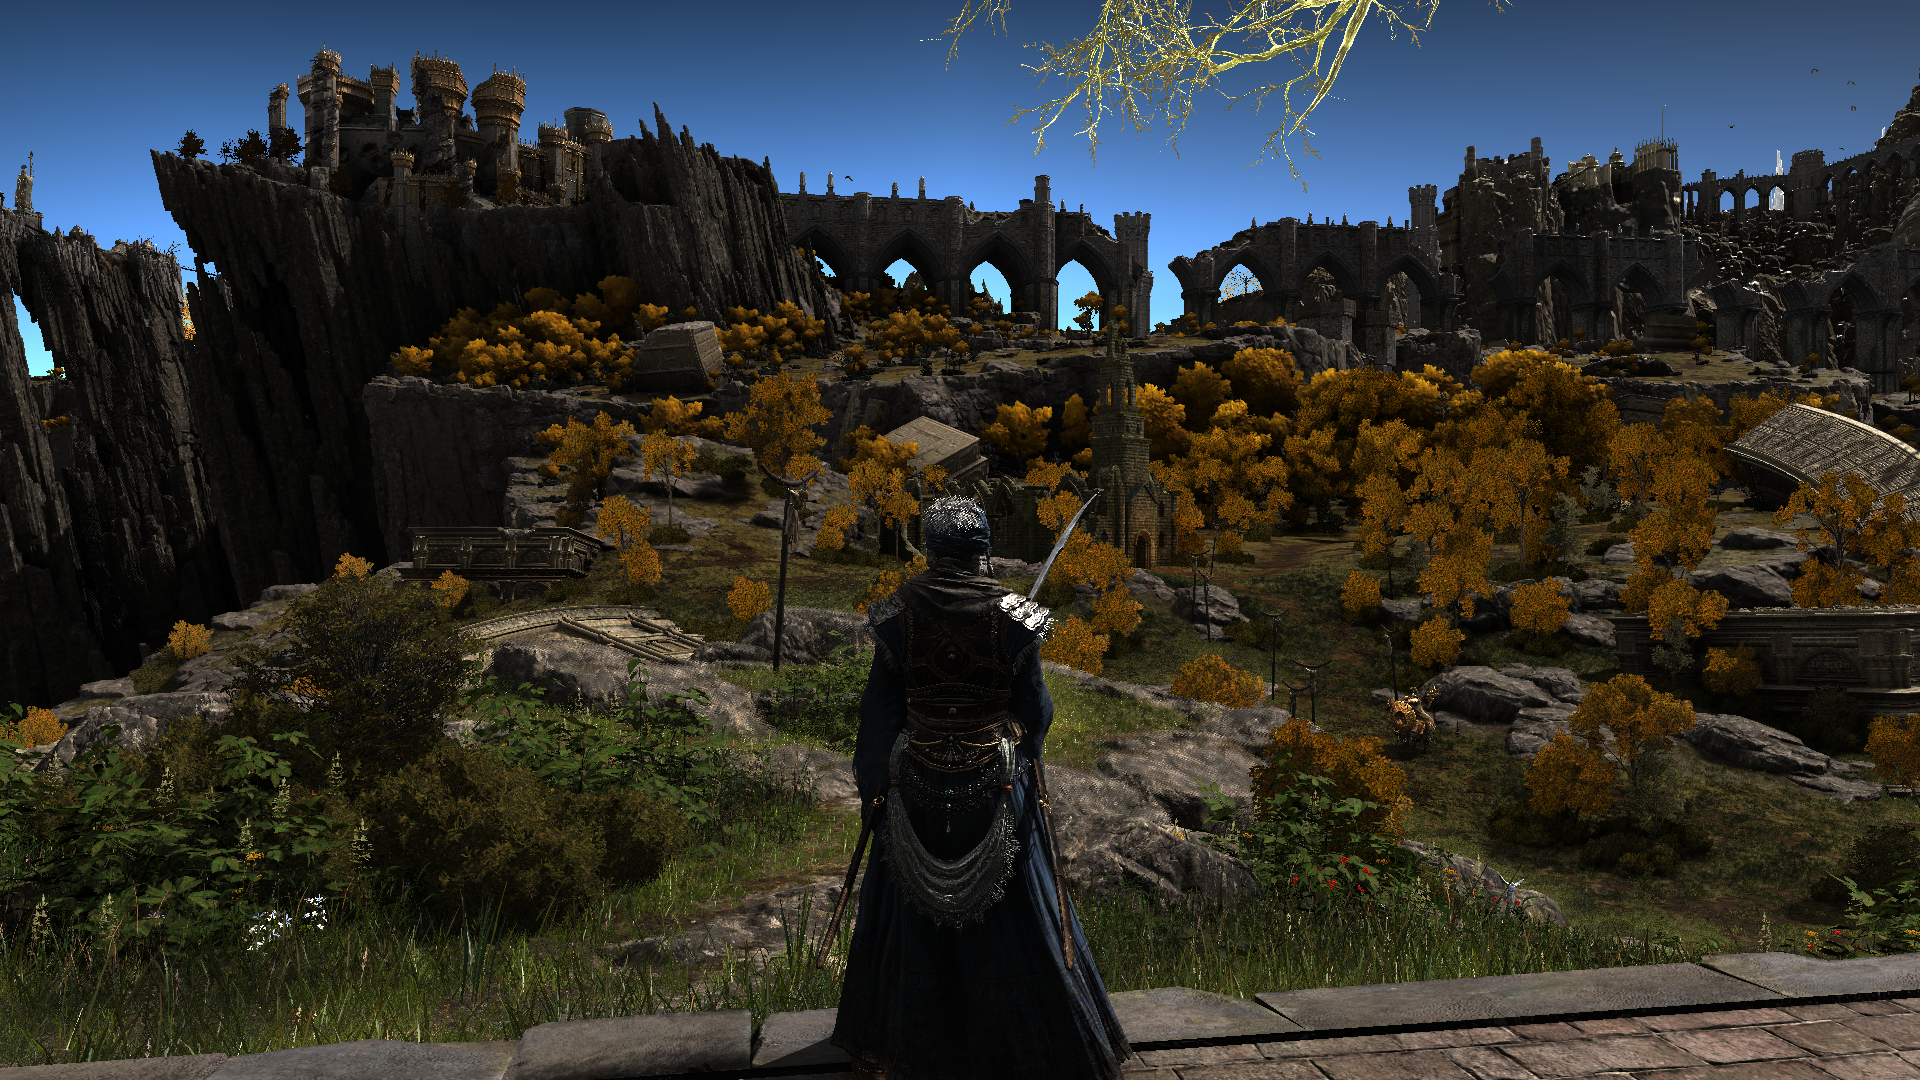
Atmosphere
But as you can see, while the frame is ready to go into post processing’s eye-candy, it still missing they sky! And here comes the time to Draw and composite it with the current frame in a separate color pass.
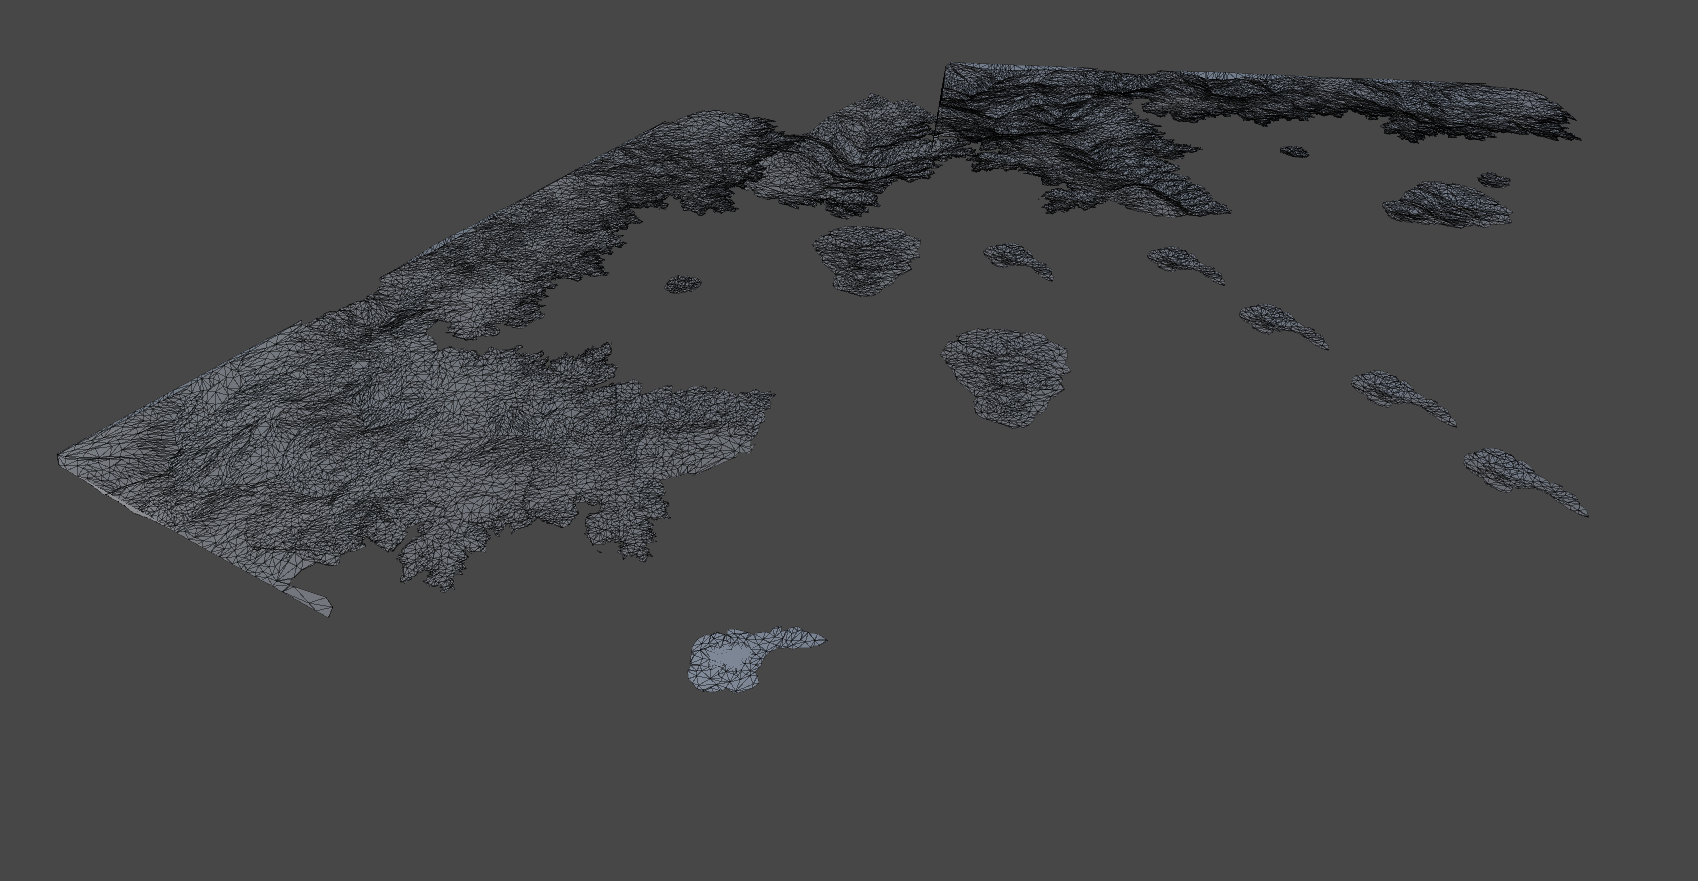
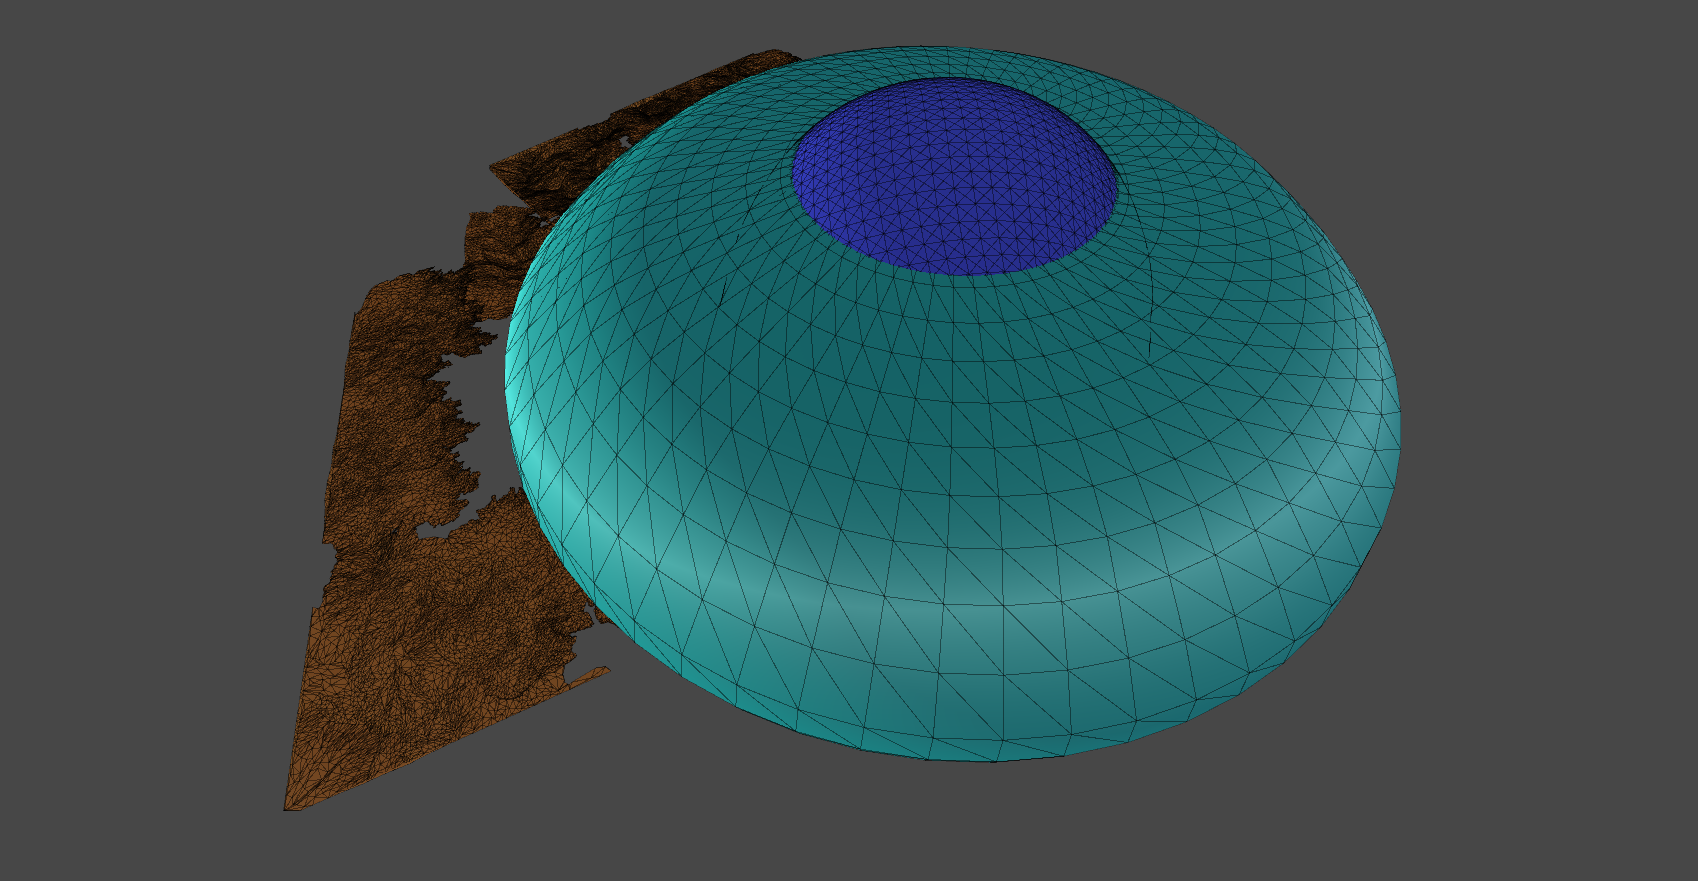
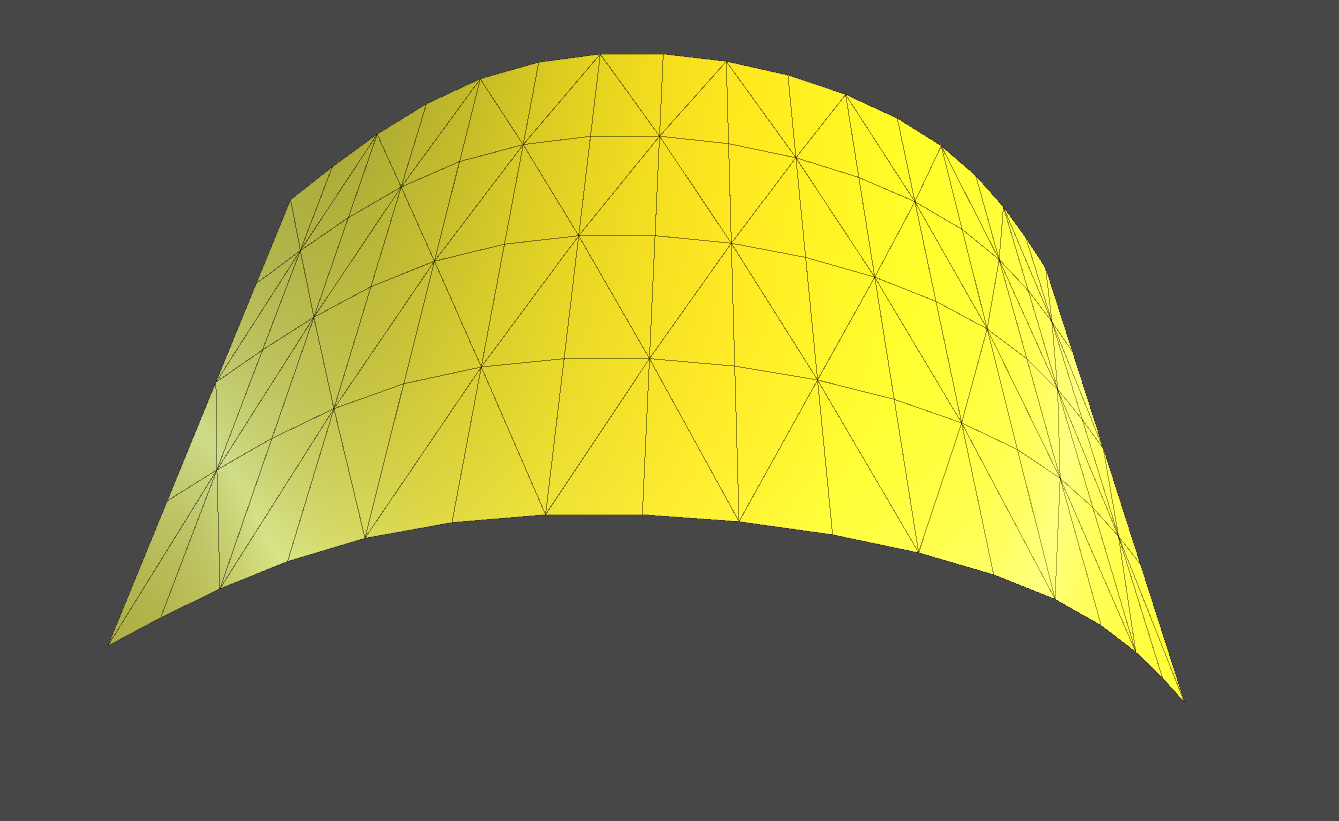
Atmosphere & Sky go through several of steps, at first a sky dome mesh with a blue sky texture is drawn, then a clouds mesh and finally a “terrain”, not sure why it’s par of the “sky/atmosphere” but may be due to “atmosphere” and fog..
So, when all those 3 meshes are put together (considering they are centered to the world), they would look like something like that..But I still, not sure why that terrain thing if almost never visible!
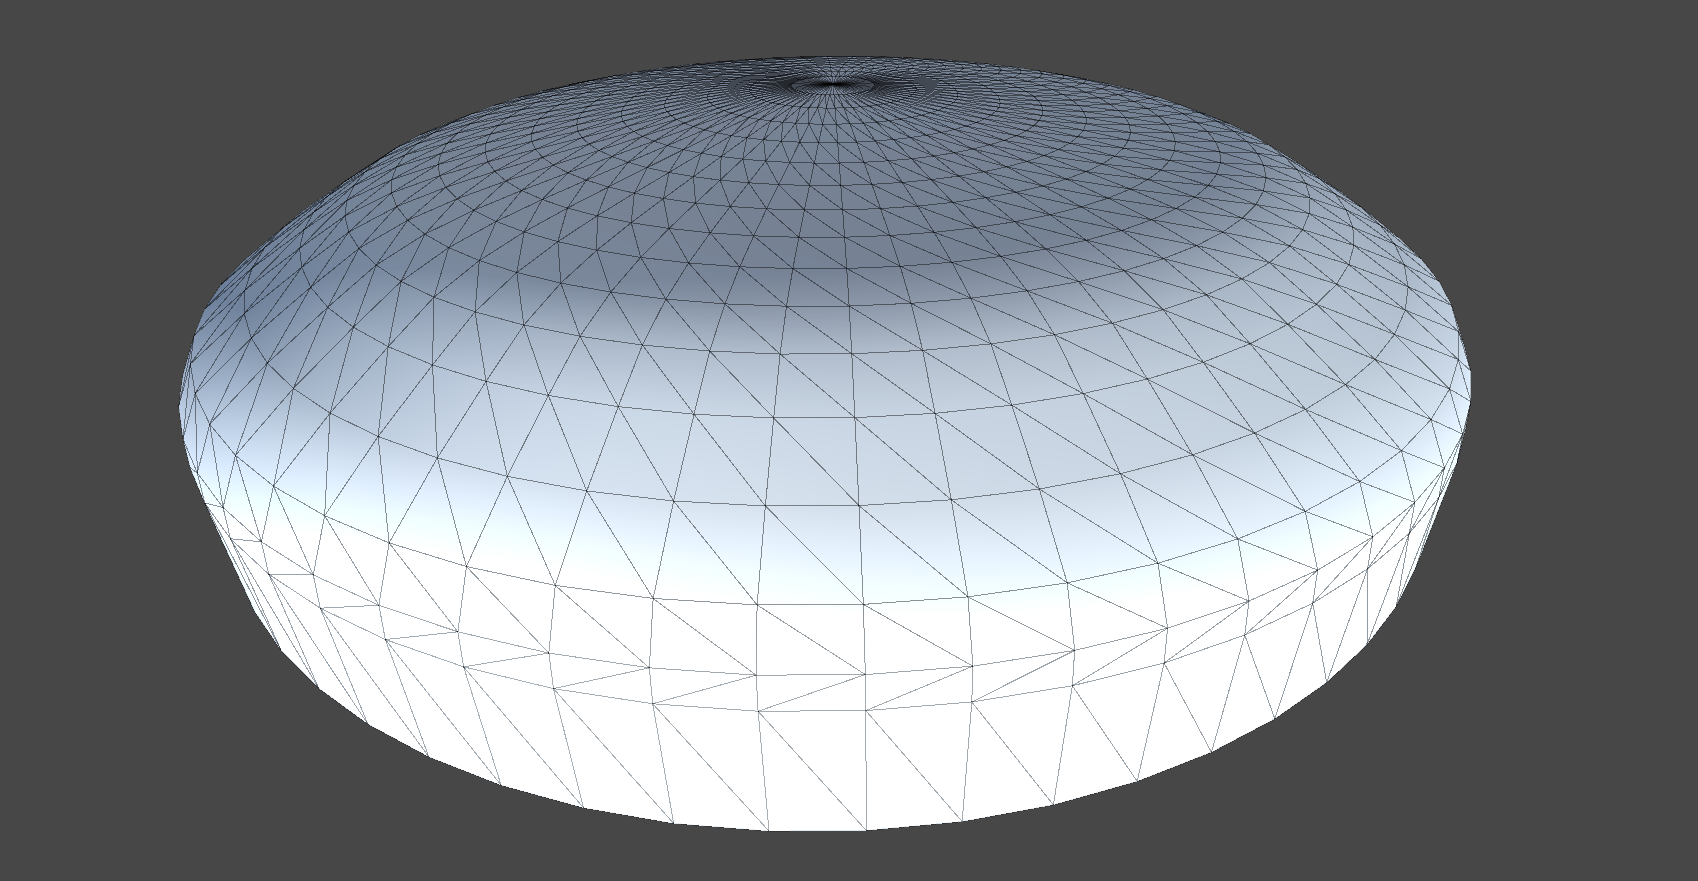
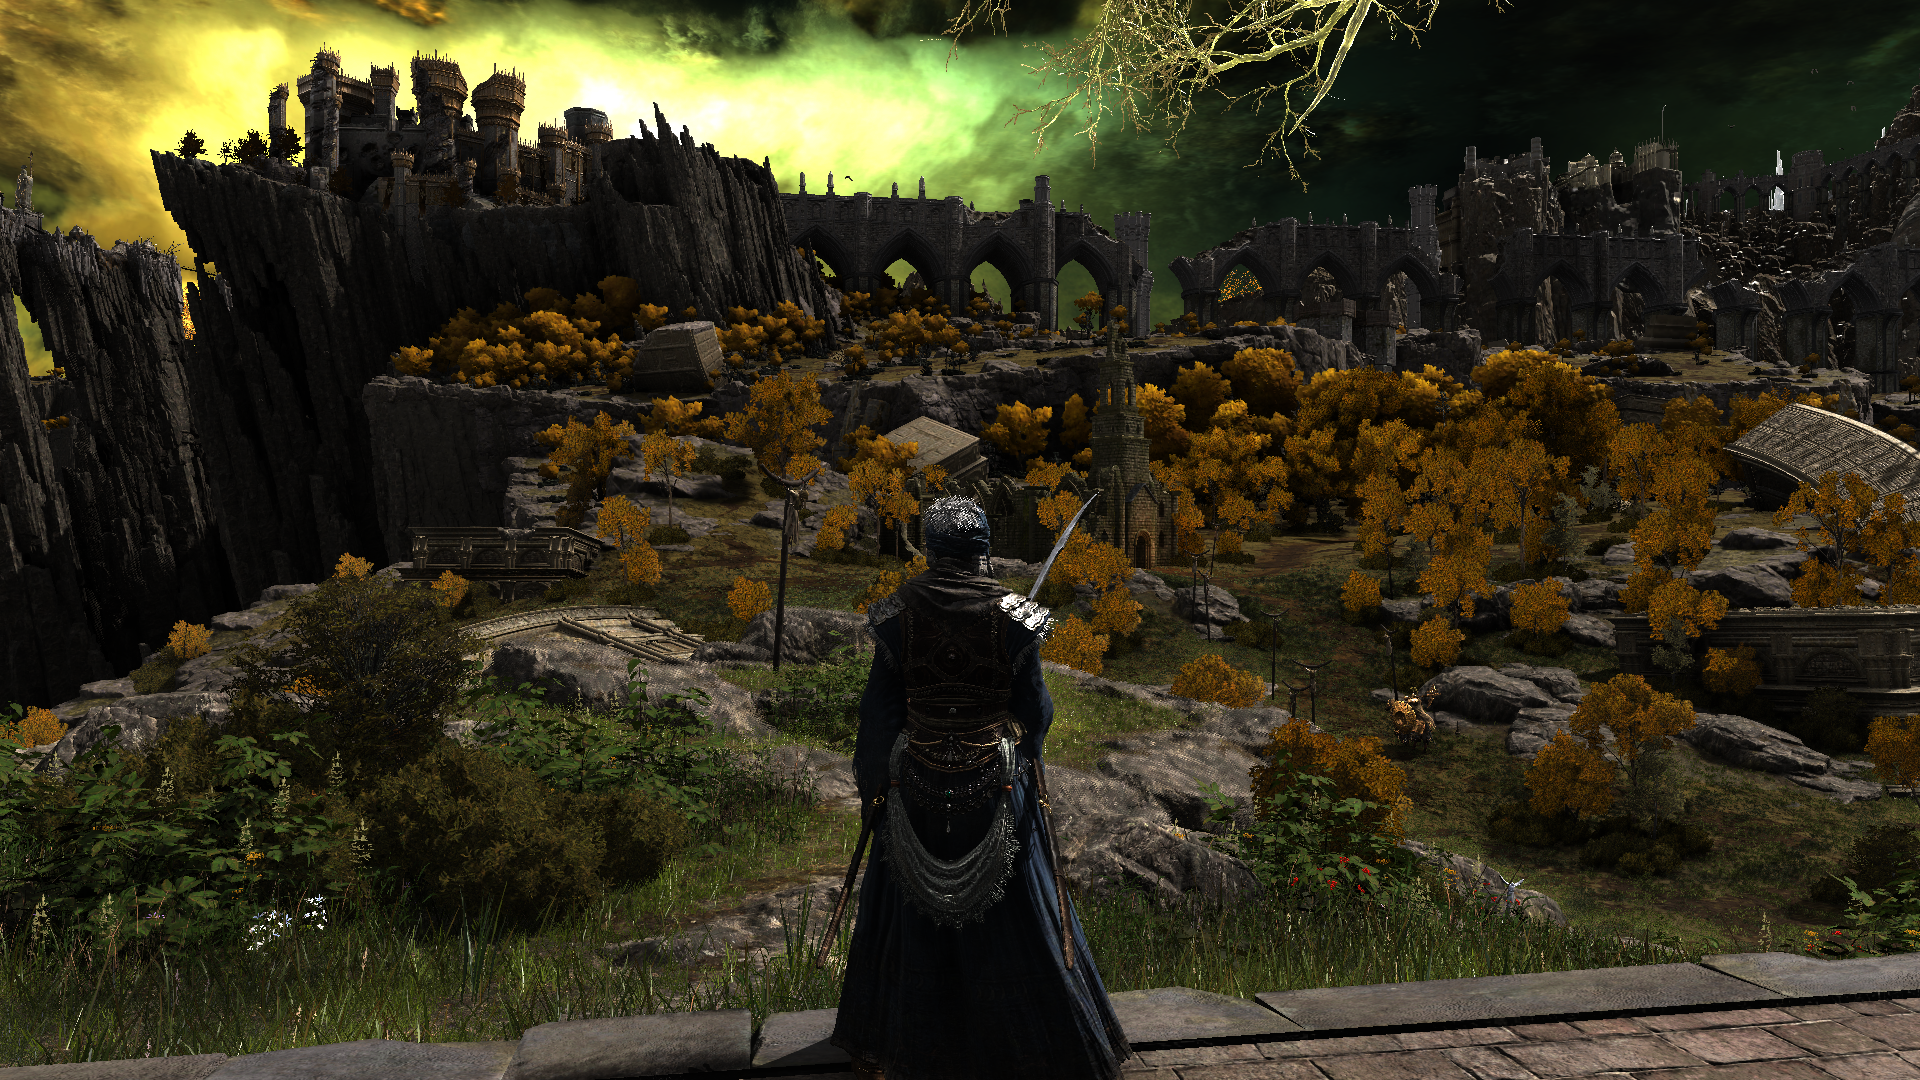
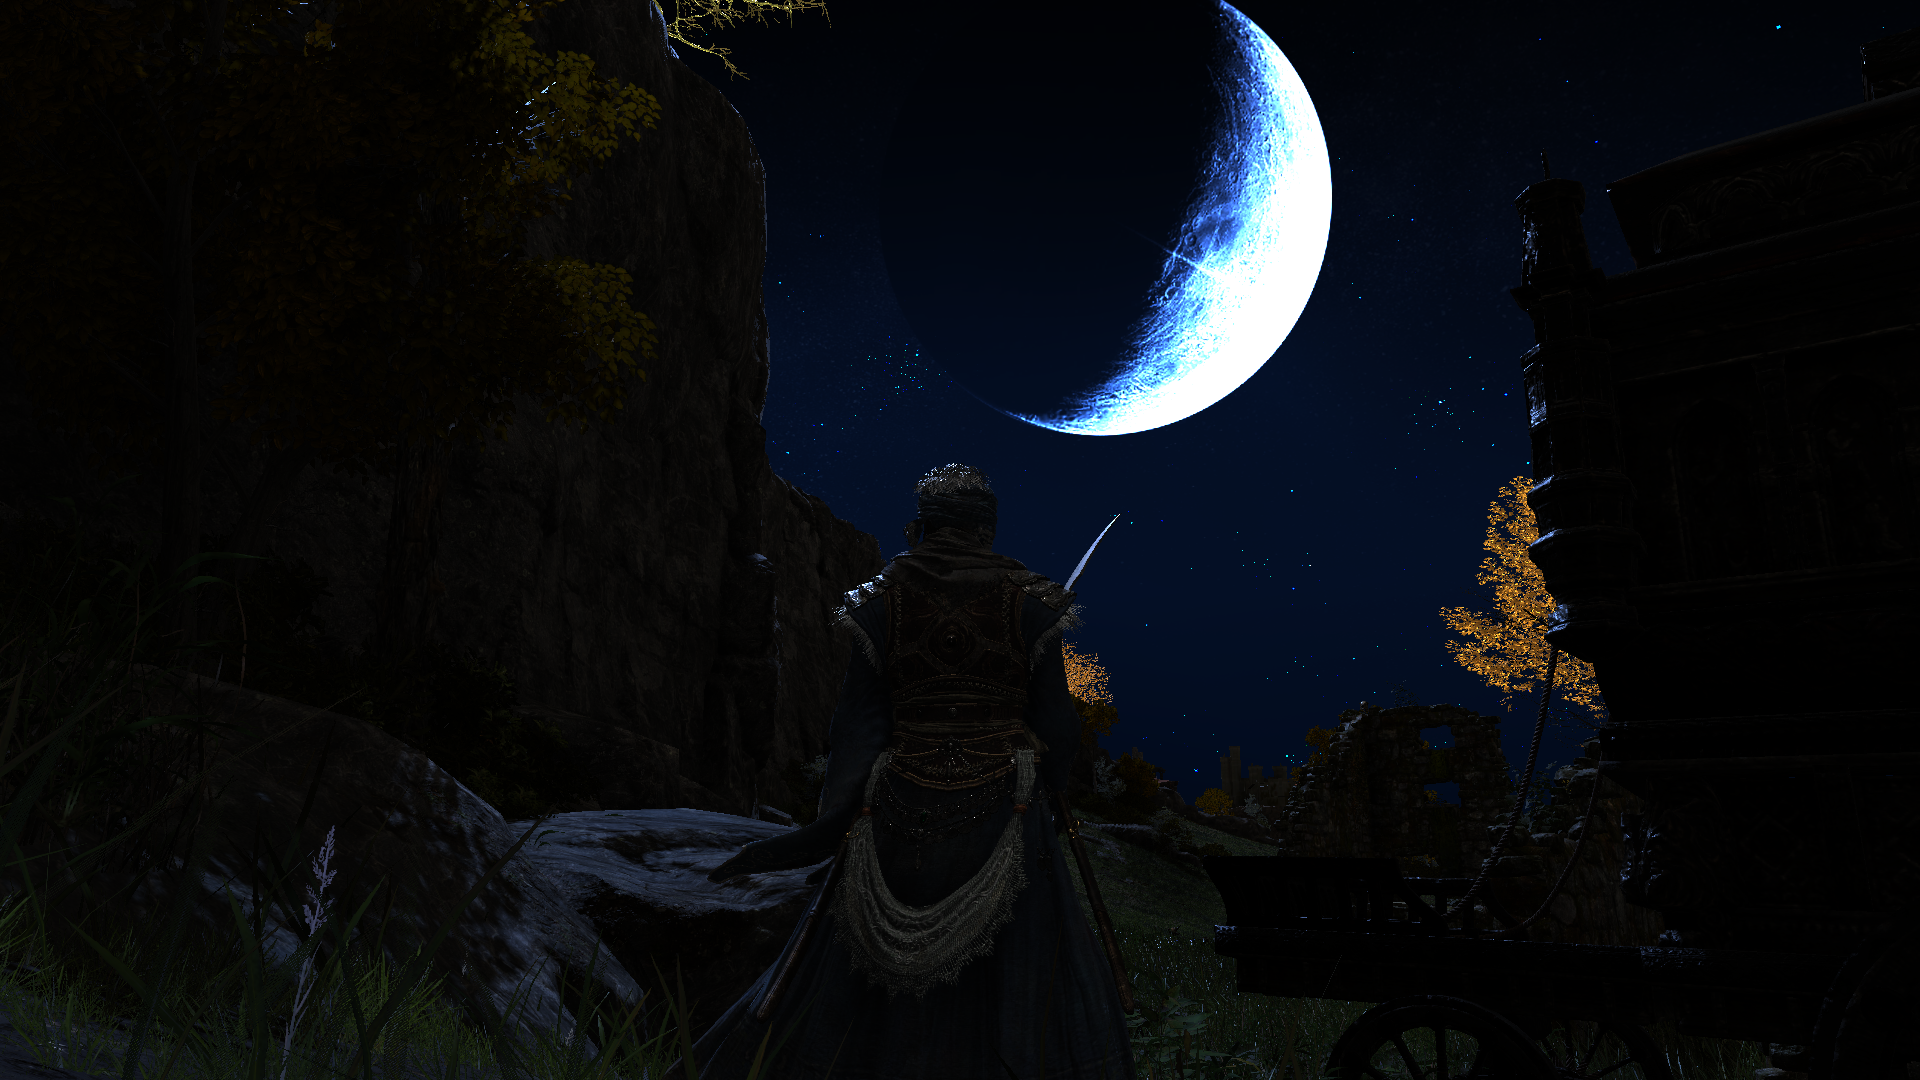
Sky Dome/Hemisphere
At this first step, atmospheric features such as the Moon or Stars, are draw (if needed). Stars (yet) have two major textures


Where the moon have a texture that utilize the RGB channels for different purposes

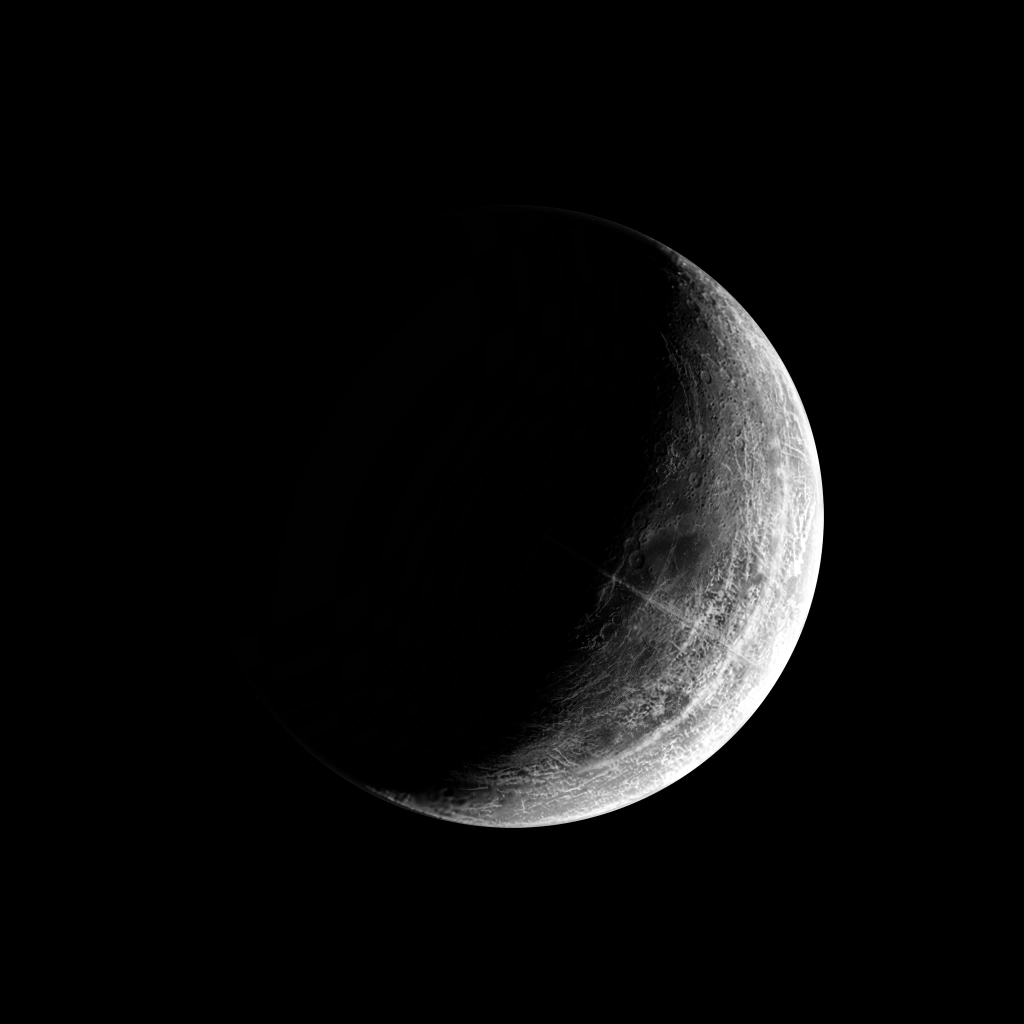
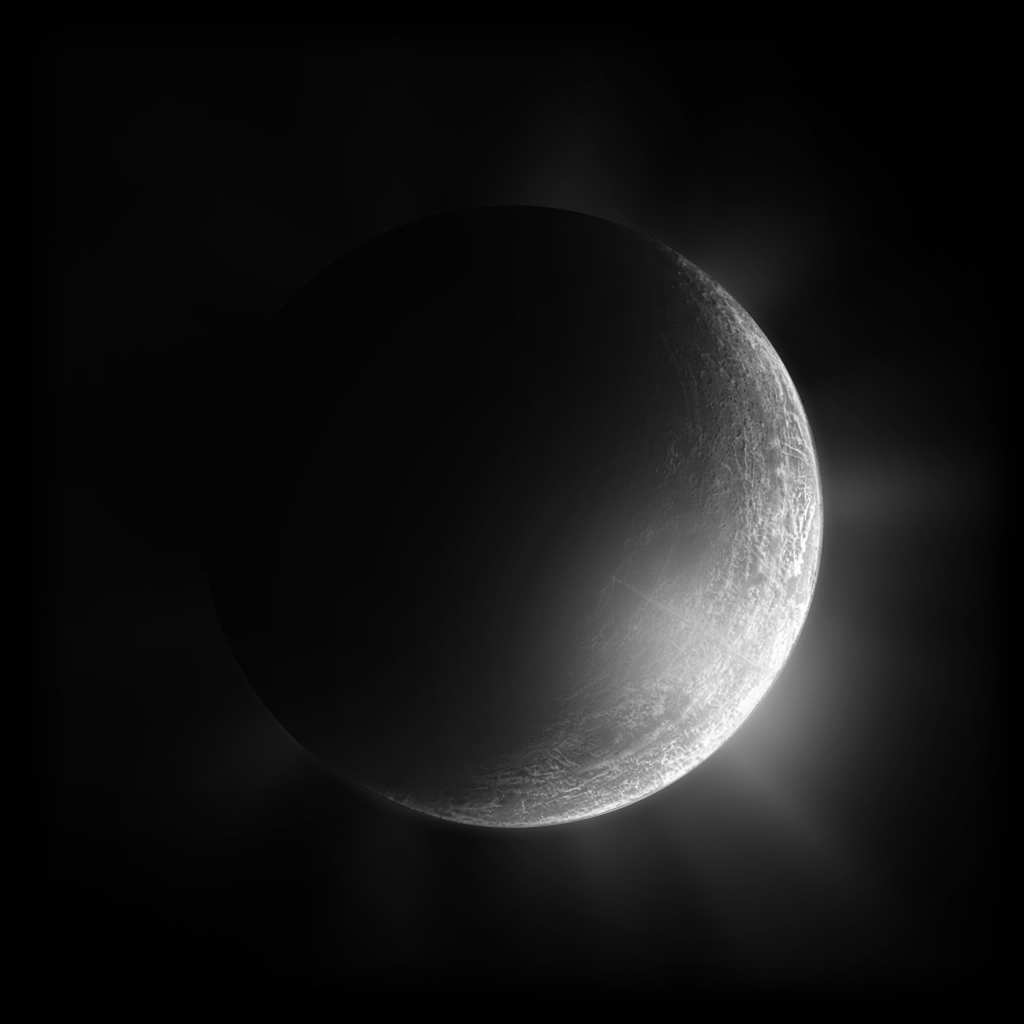

After this first step, we move from empty space behind the frame (usually grayed out after the PBR) to what would feel like a clear sky (with stars if needed)

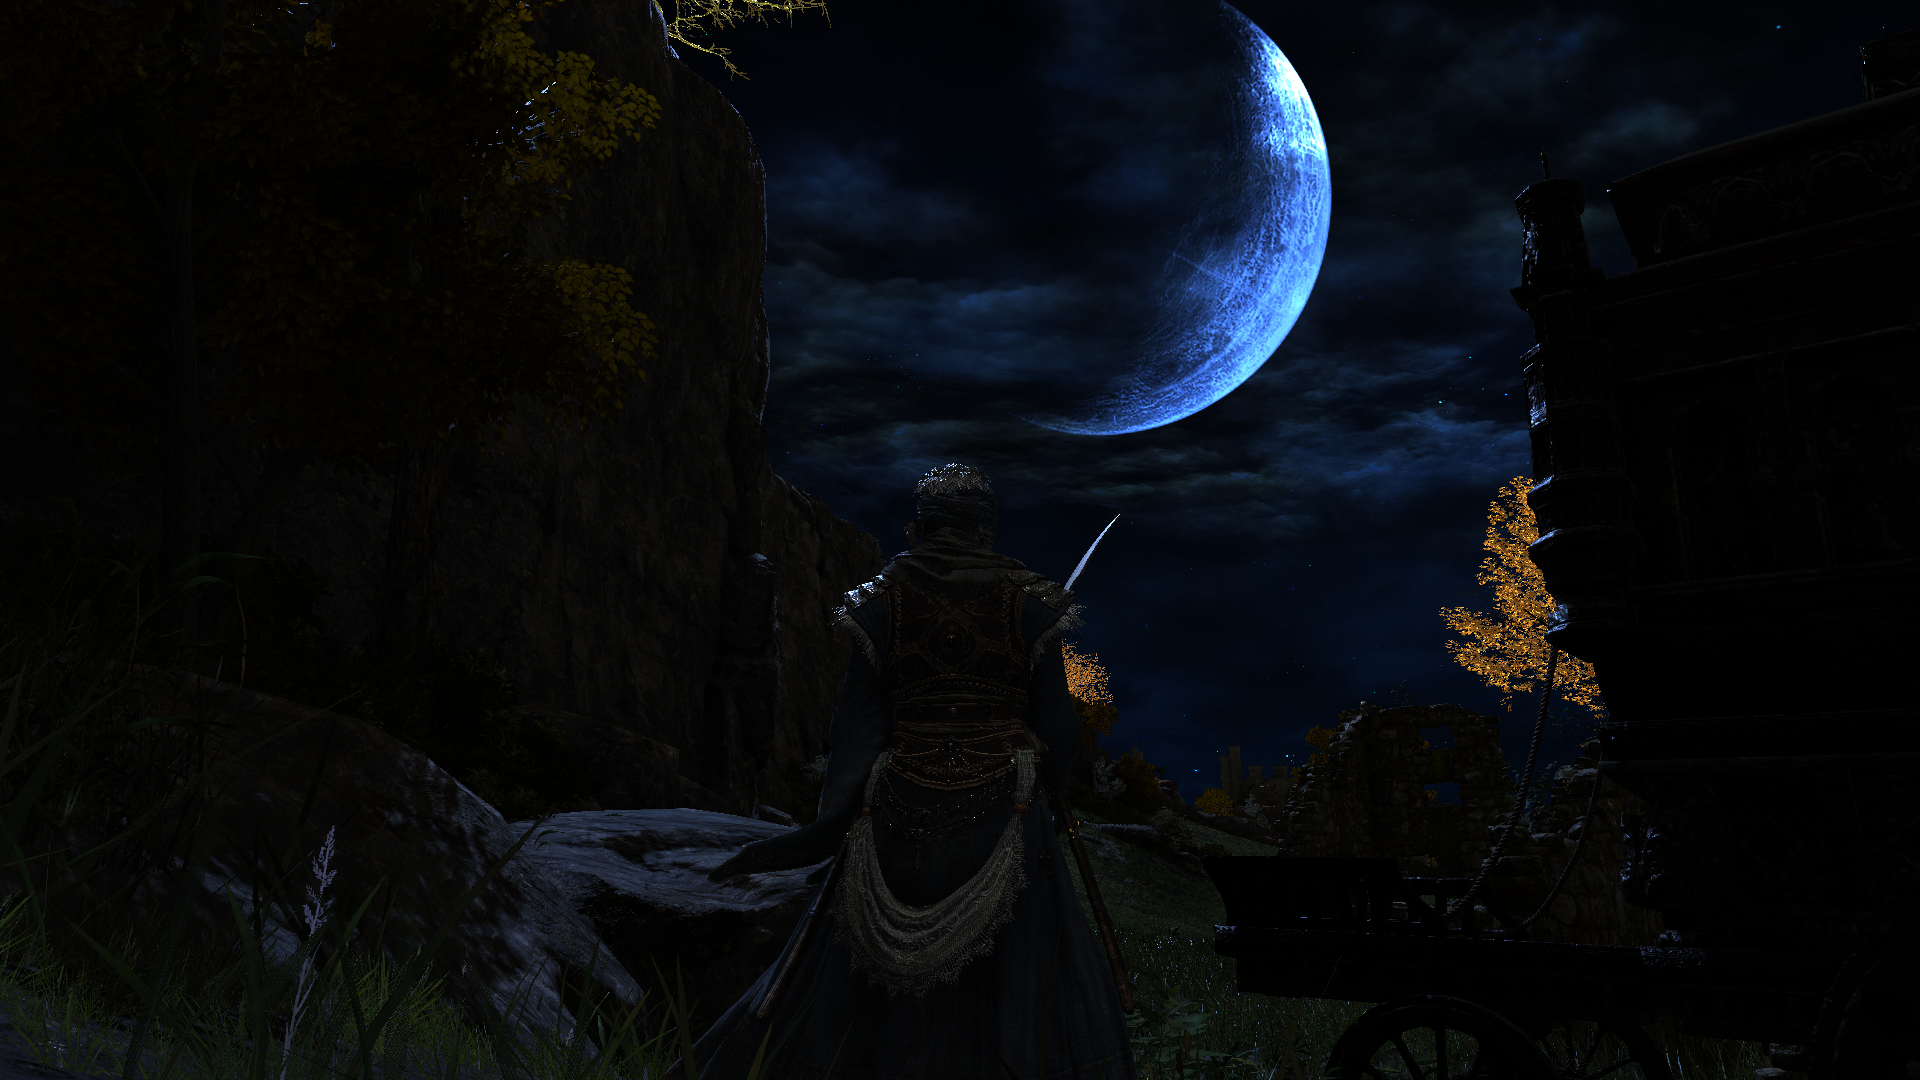
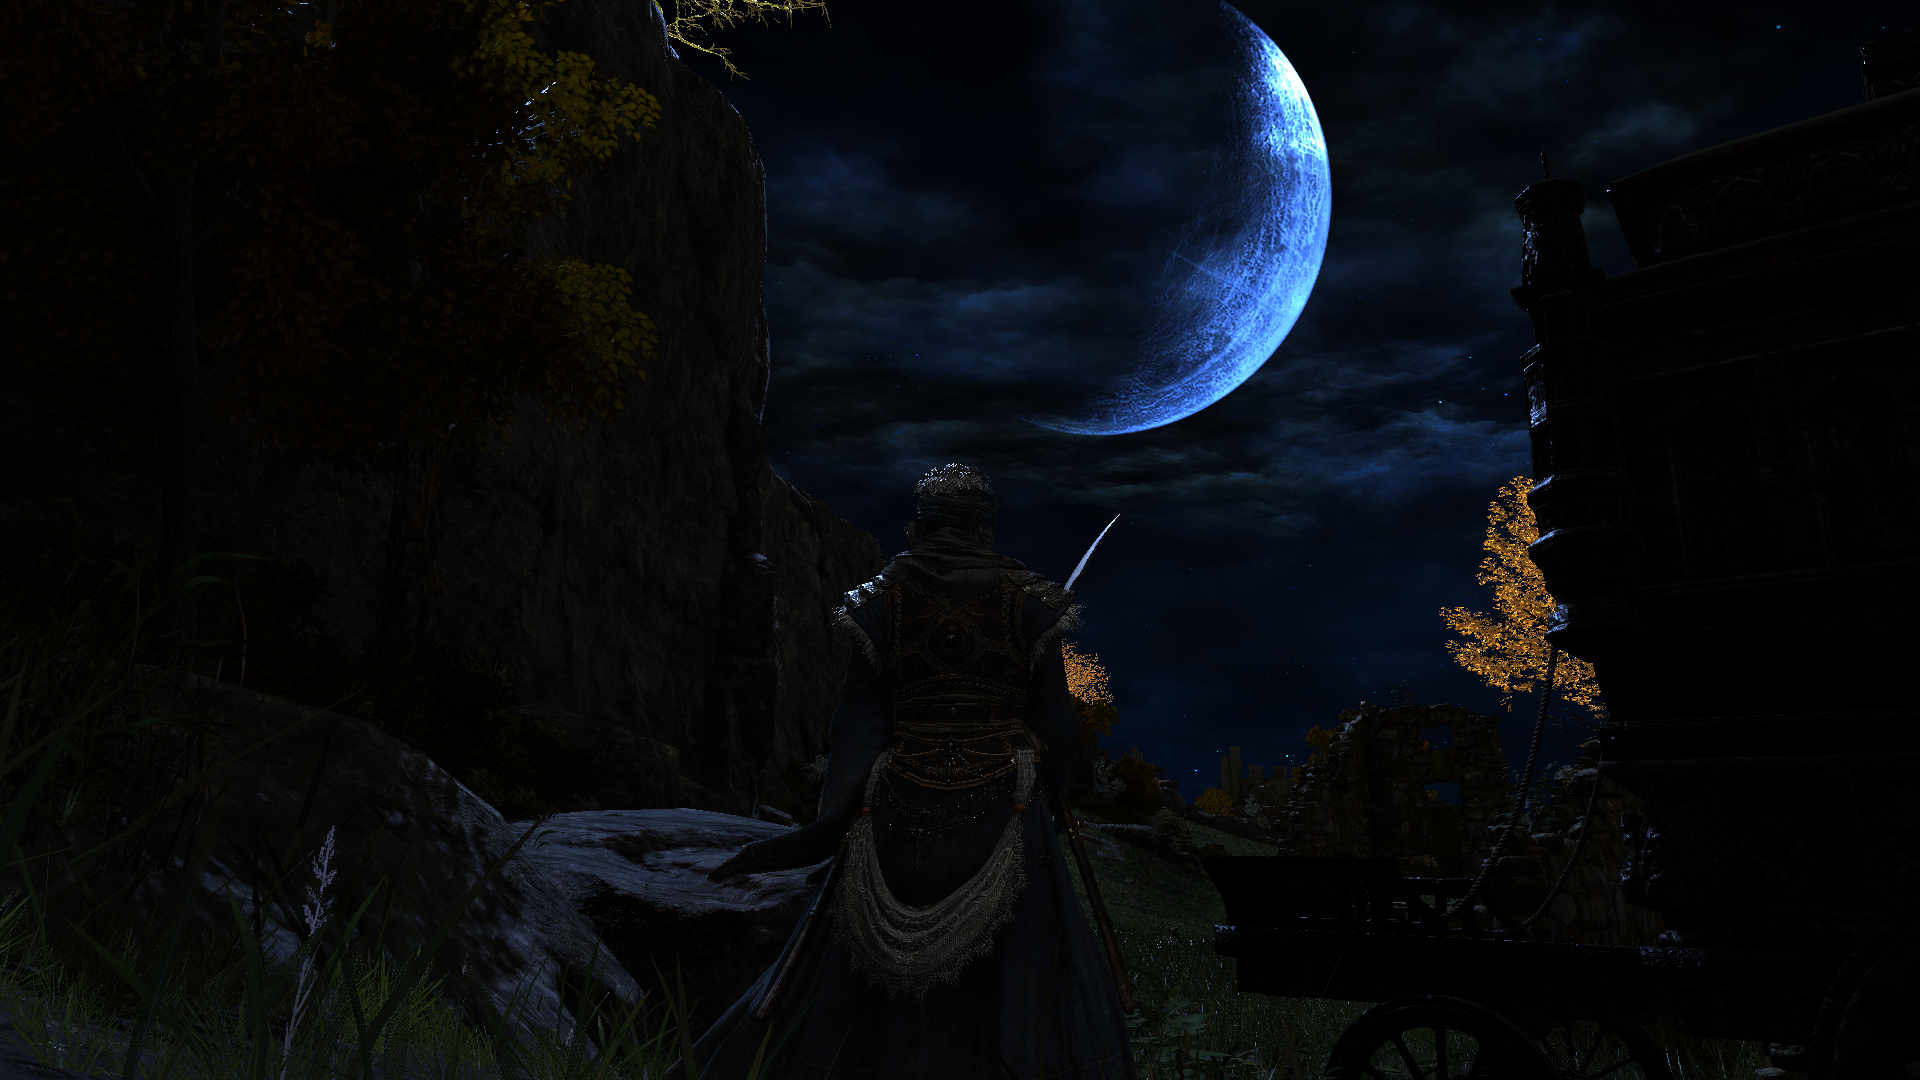
Clouds
Then a semi-deformed secondary dome (not 100% dome it’s flattened as you saw above) is drawn inside the first (bigger) dome, this one is for clouds, and it use a mix of group of clouds textures. It’s hard to tell which ones exactly used, but it’s worth mentioning that every clouds draw get all this set of textures below passed to it, regardless it use one, two or more of them, the shader gets all of them passed to it.

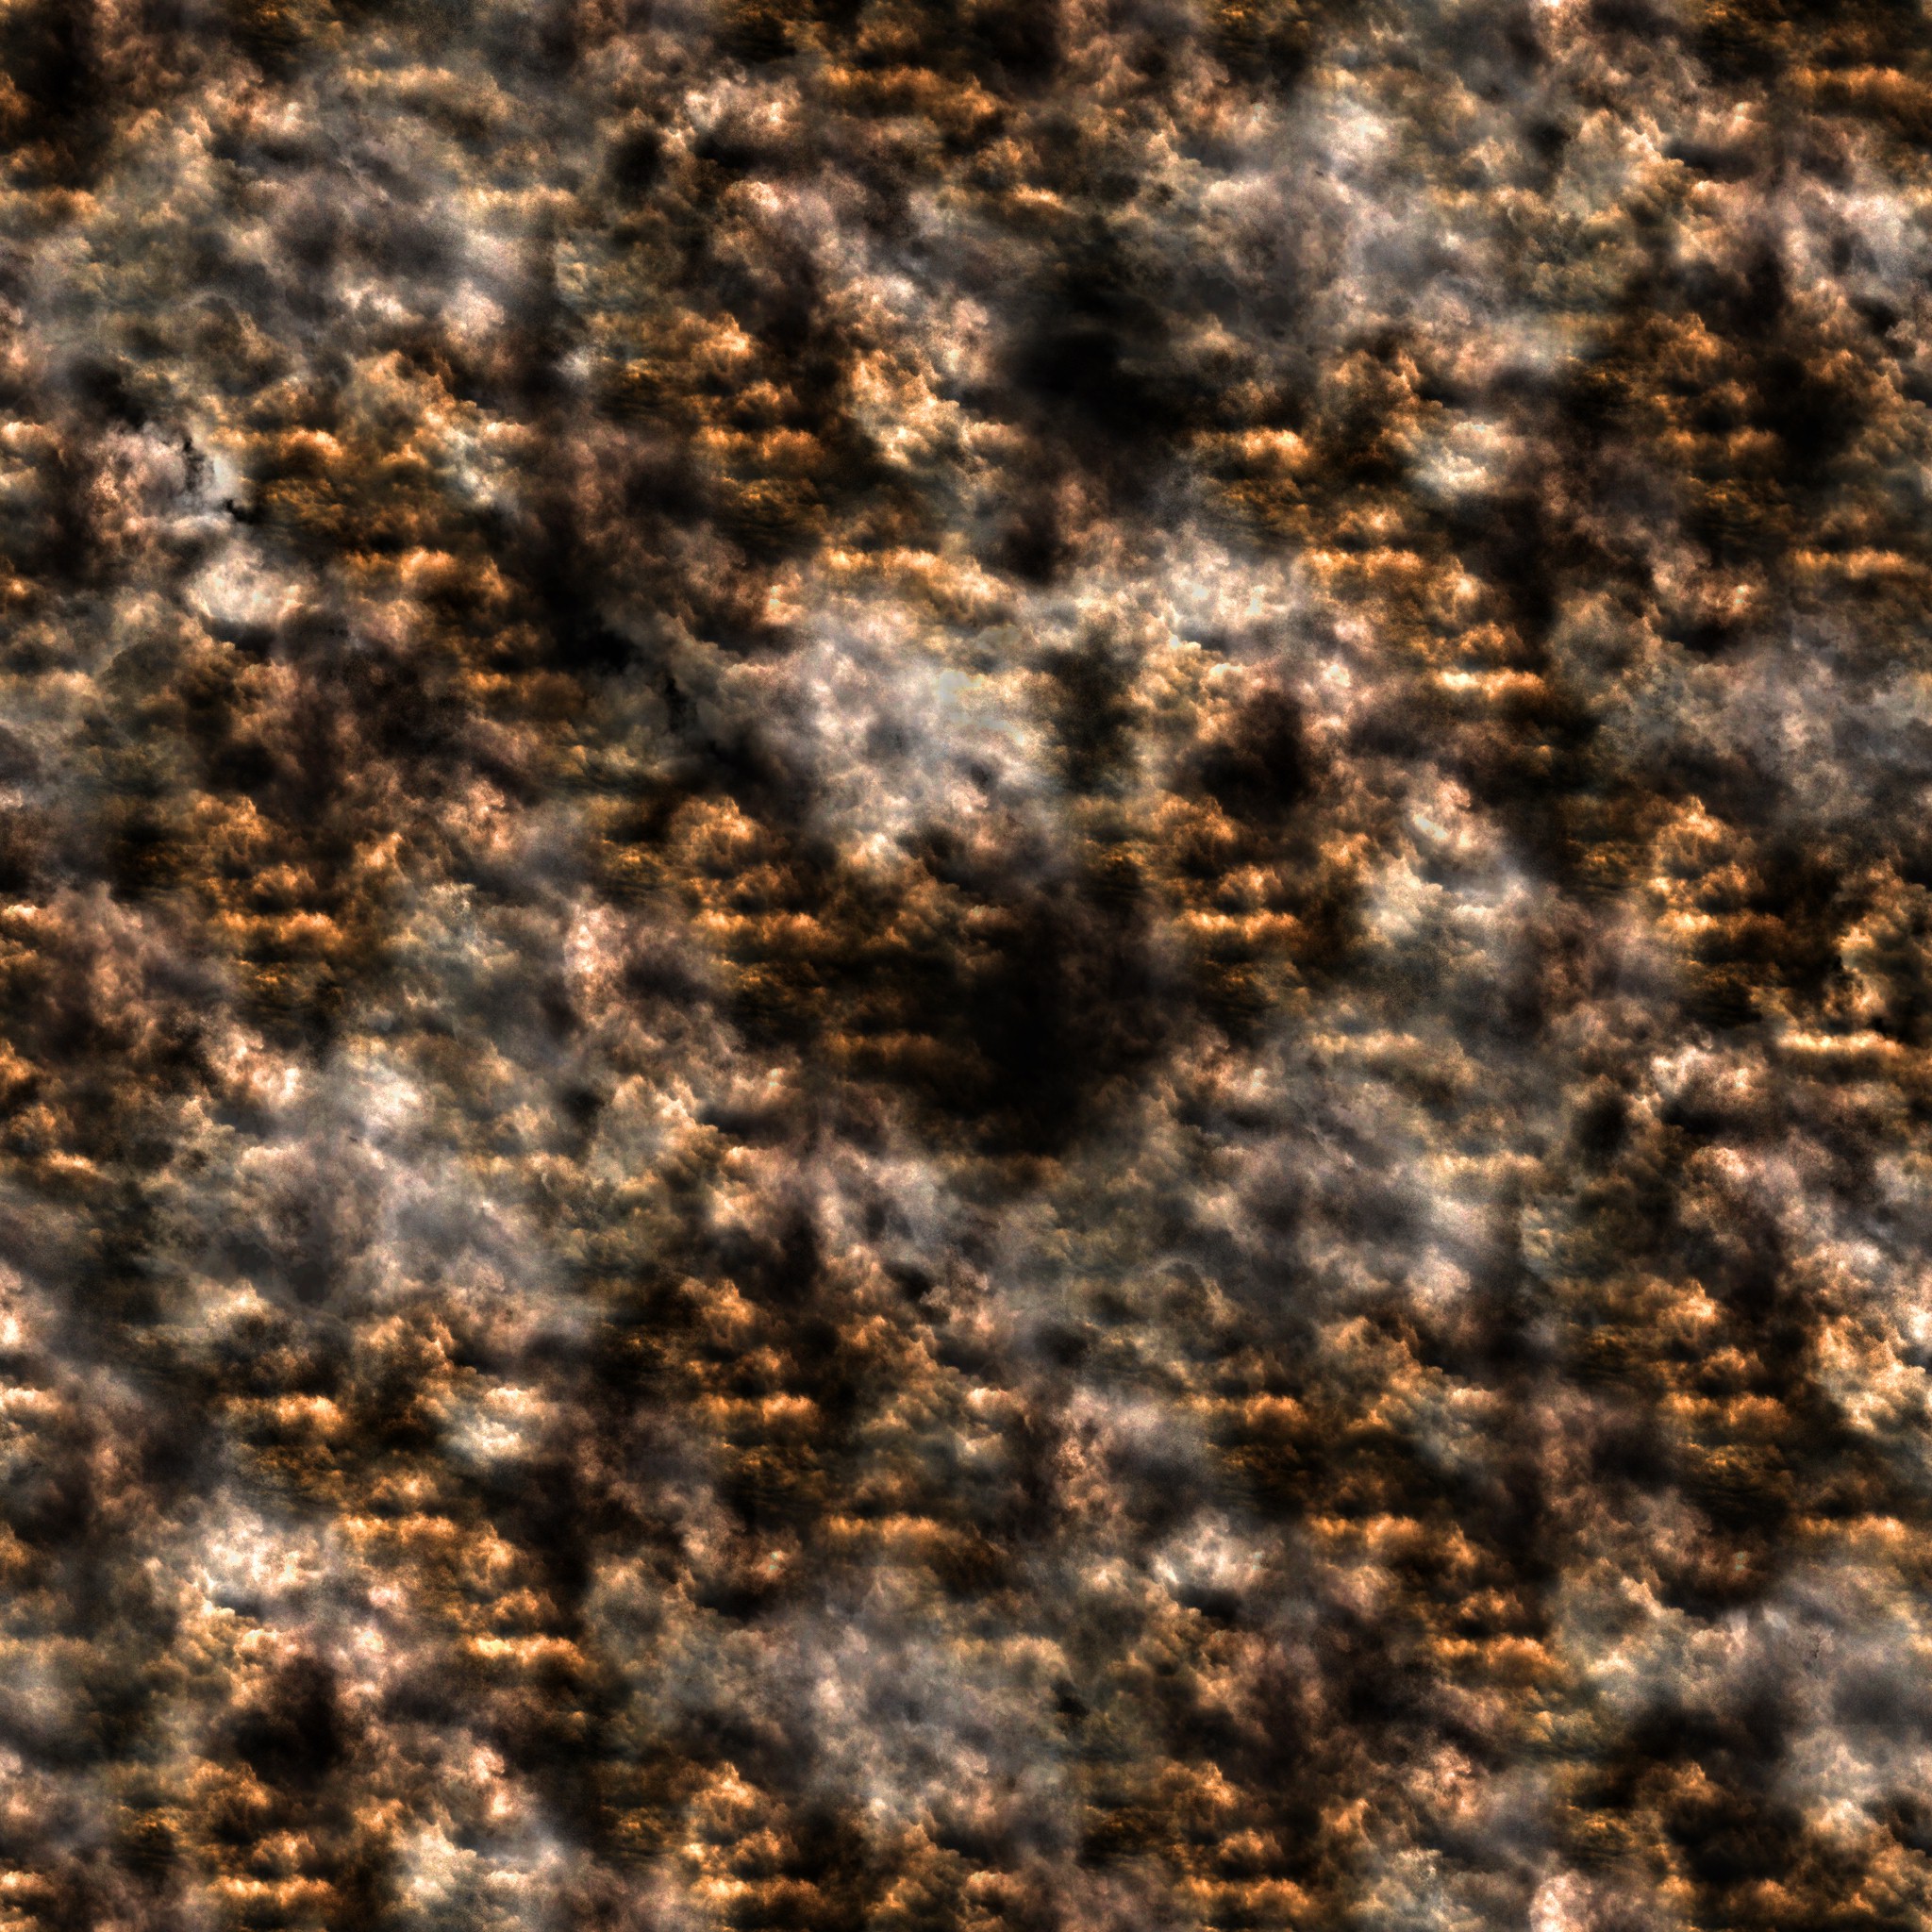


And of course, there is a group of utility textures that are used to do some fake clouds simulation (aka flowmap)


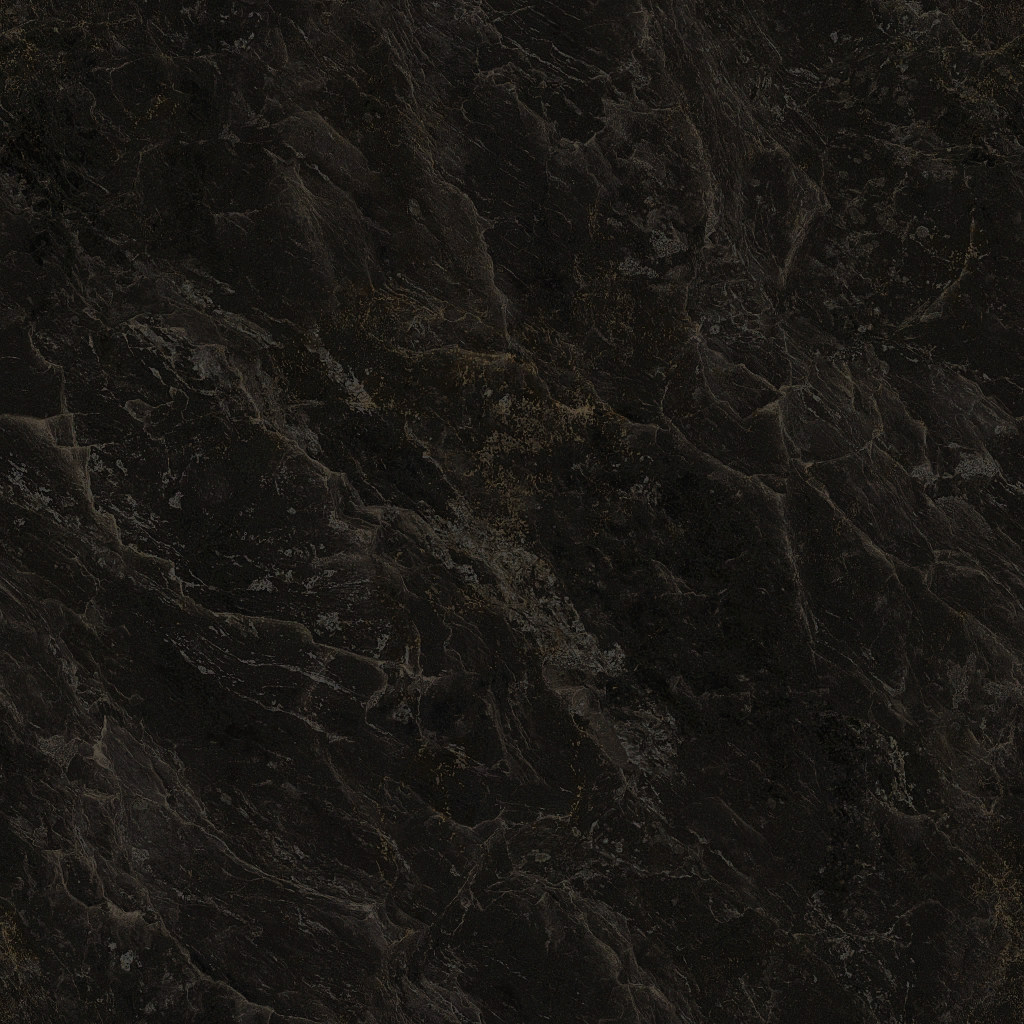
Terrain
Last but not least, a terrain mesh is drawn. This mesh is very hard to see, in fact, in almost all my captures, i failed to spot a single part of the terrain in the final render. Here below are the In & Out of that step, can you see any difference!!


The mesh is huge and is very very dense, but you still won’t be able to see it easily. Most of the terrain you see and walk over is separate terrain/rocks meshes from that “atmospheric” terrain. The terrain in this step go through a usual terrain tiling drawing process that is full of many layers in form of textures (grass, stone, dirt,..etc) and masks. Here are the list of the common terrain layers & masks used for this type of draw..


And you’re right if you guessed that the 1st texture in the previous set is packed… I love packed textures, they sometimes feel like “aliens” for me!
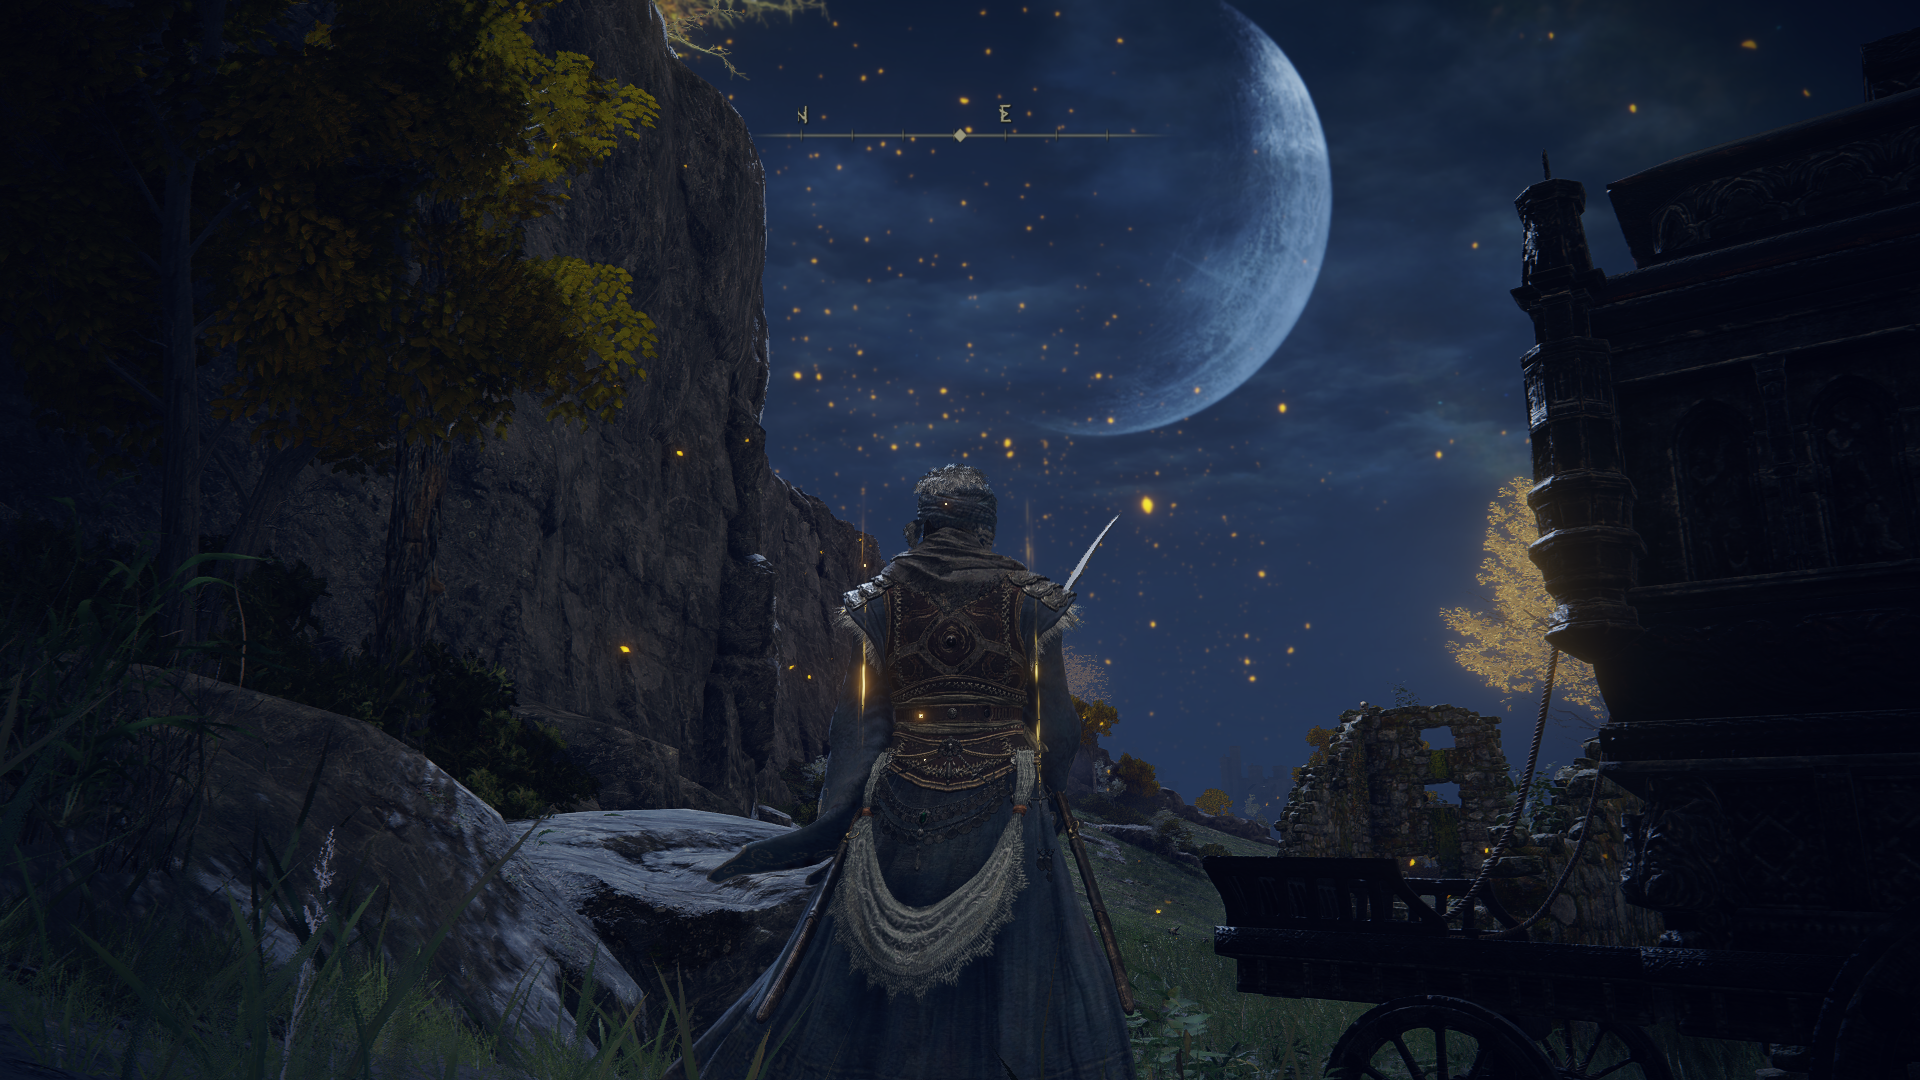
So, to put all together, in a good example of an area where you can see sky, stars, moon, clouds and every atmospheric things, this will be the correct drawing order
Post Processing
Most of the post processing in Elden Ring takes place in Fragment Shaders, and it is quite rare to find a post processor at compute level. Which was another disappointment for a D3D12 title in the year of 2022! But all in all, I liked the final quality of the post processors, as well as how “lite” the data seemed from my point of view, and overall how tidy and organized the post processing flow.
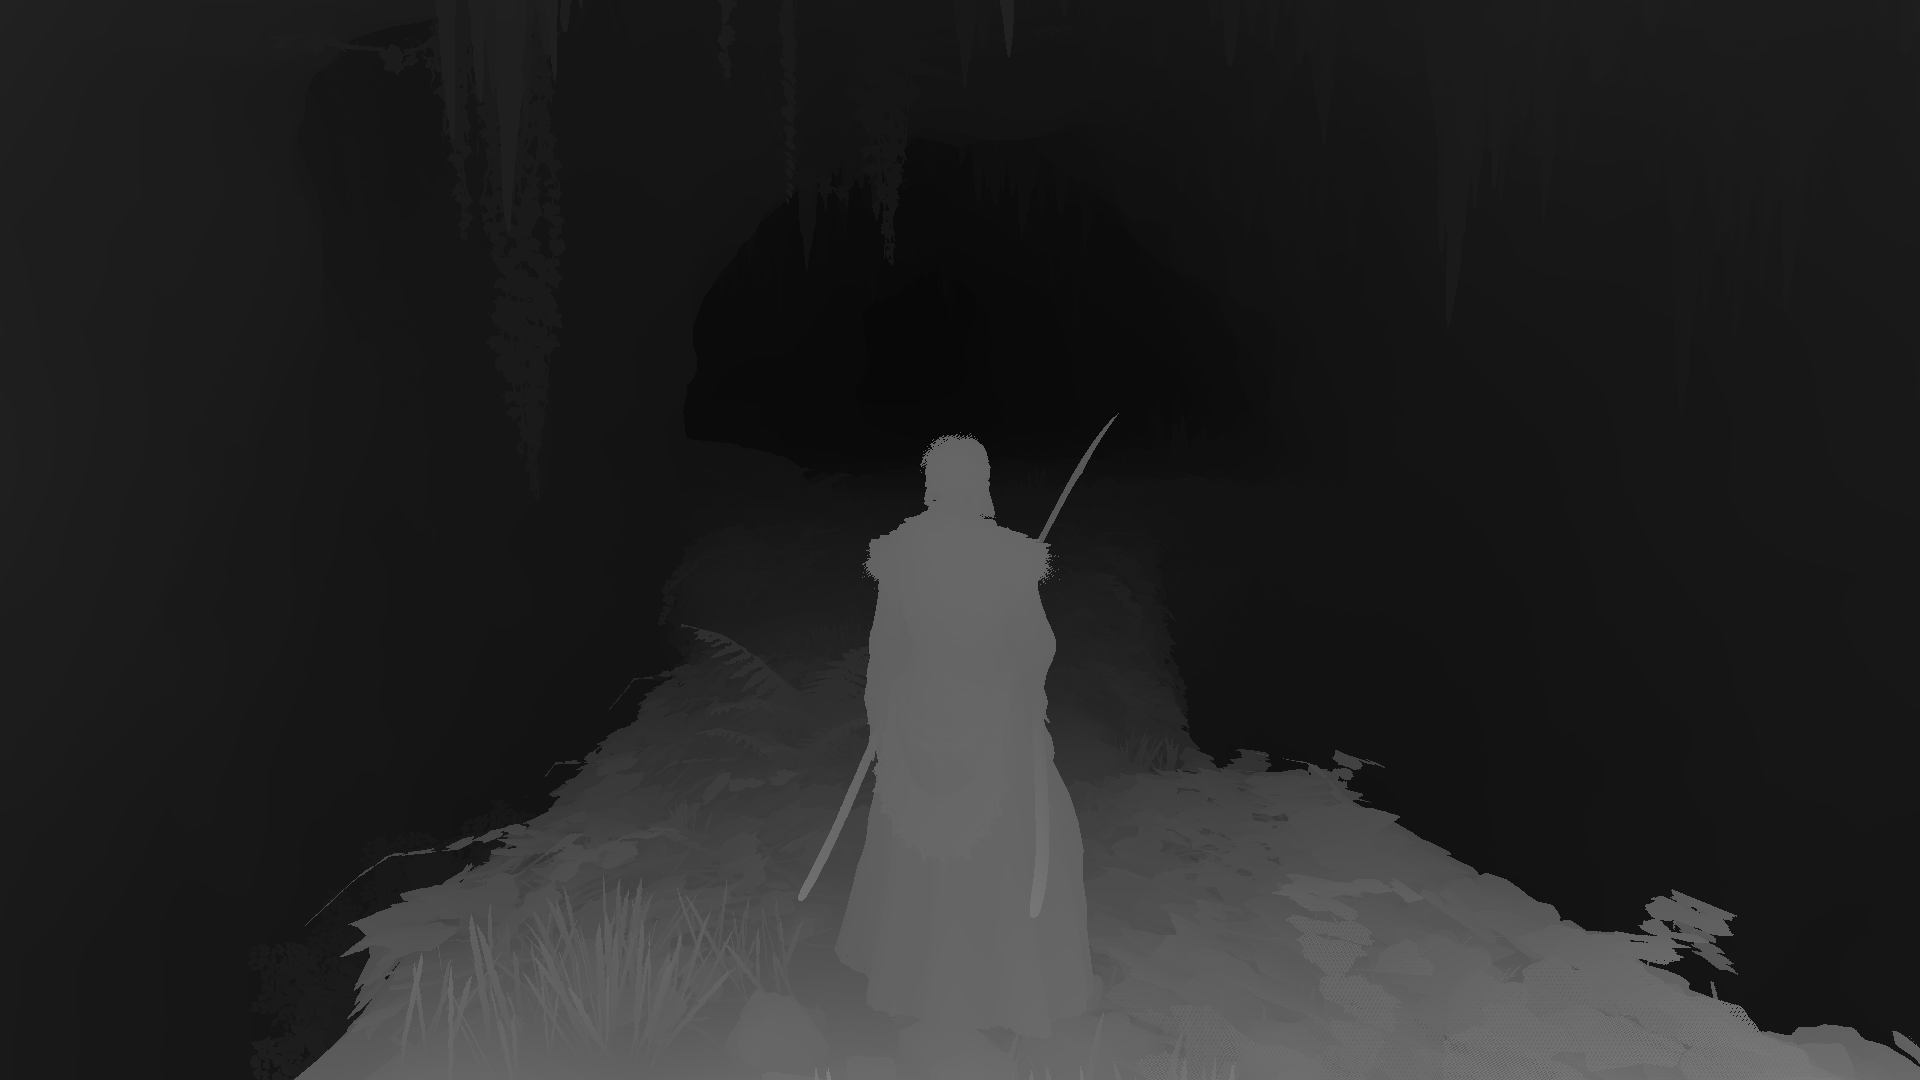
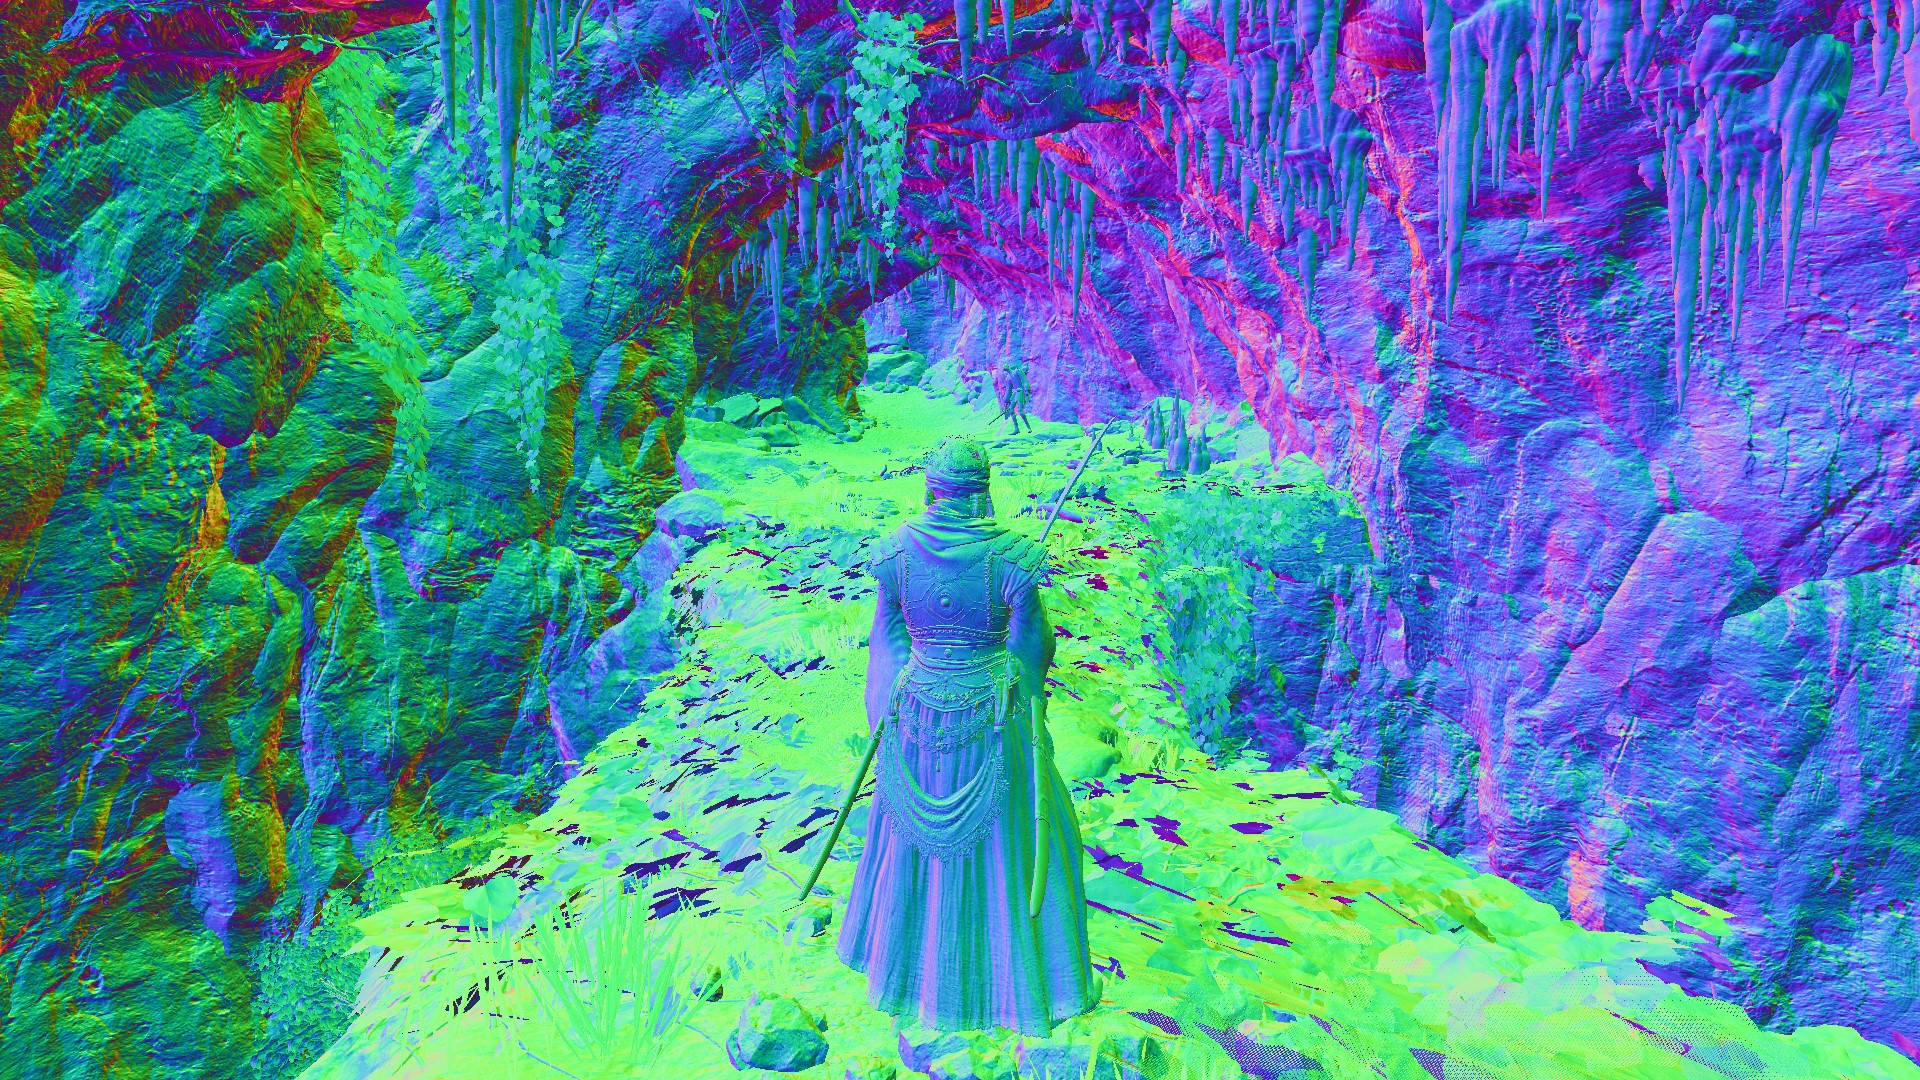
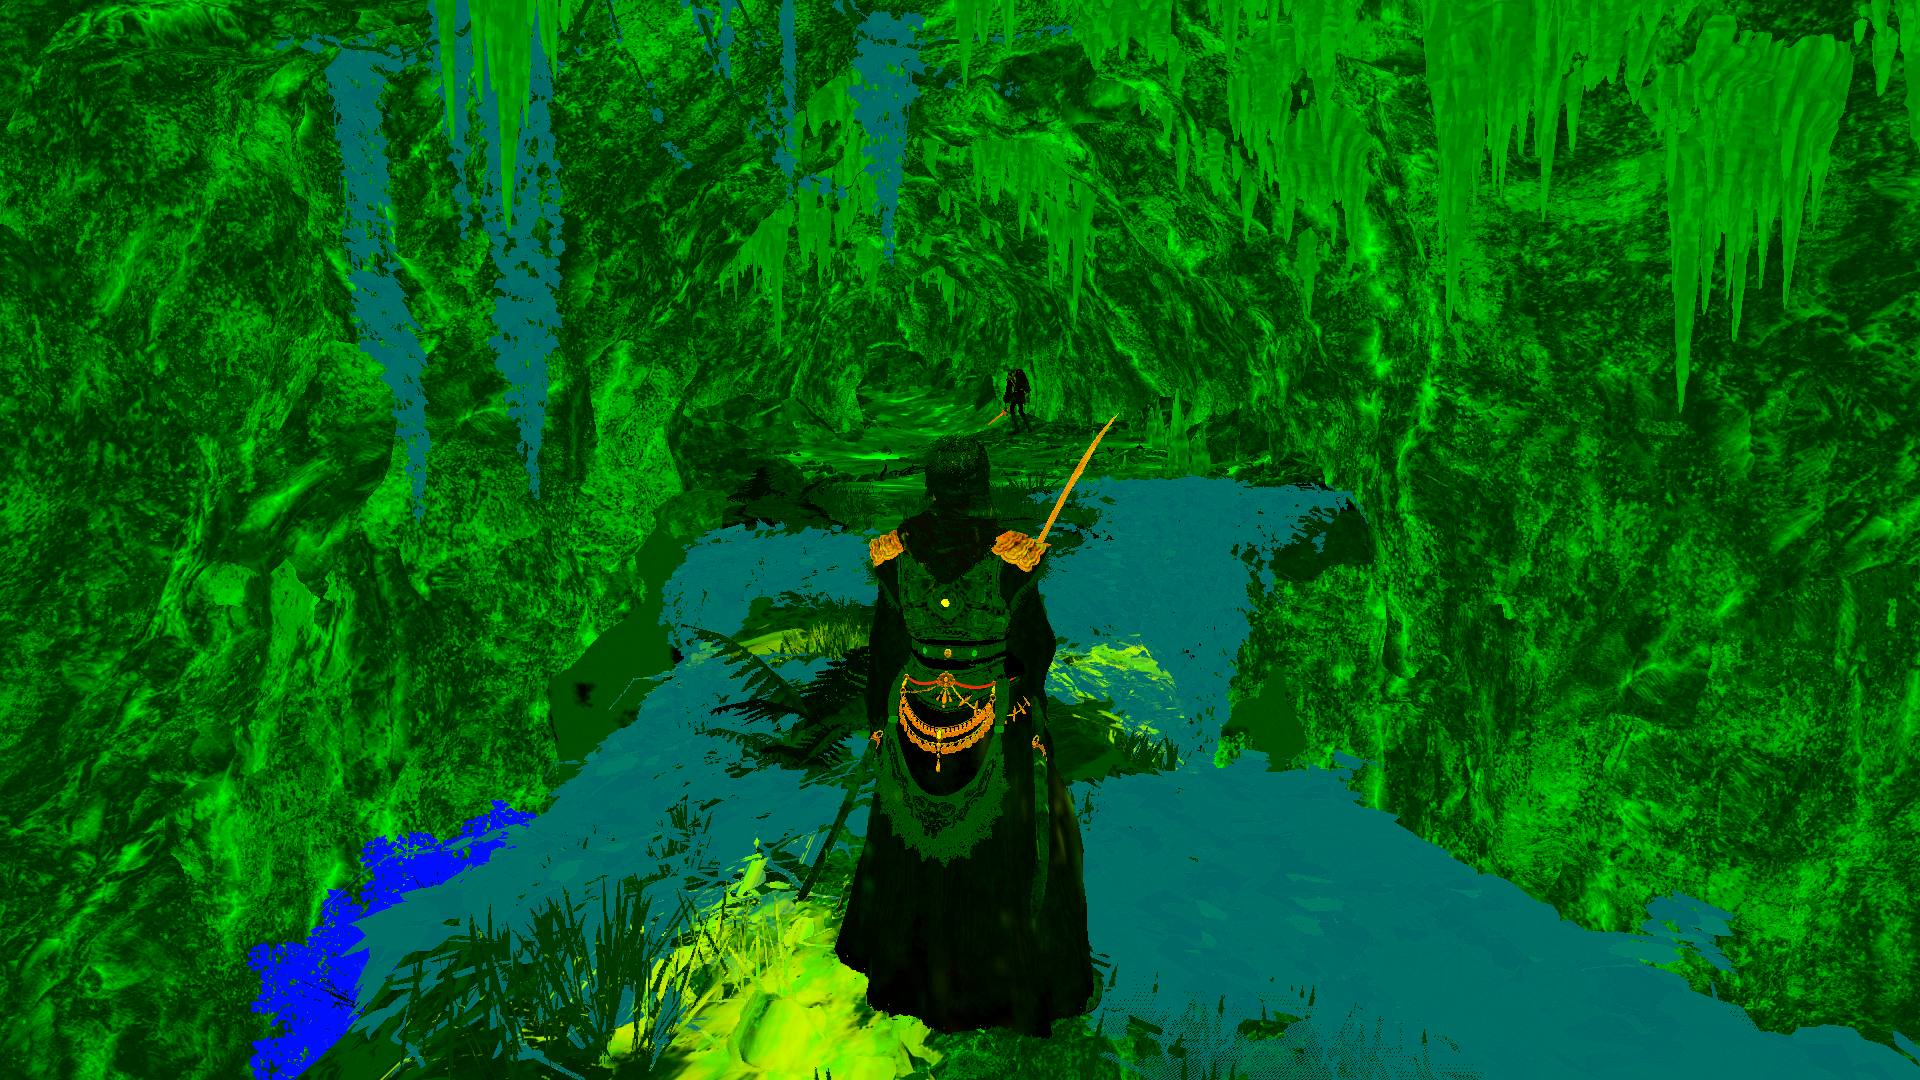
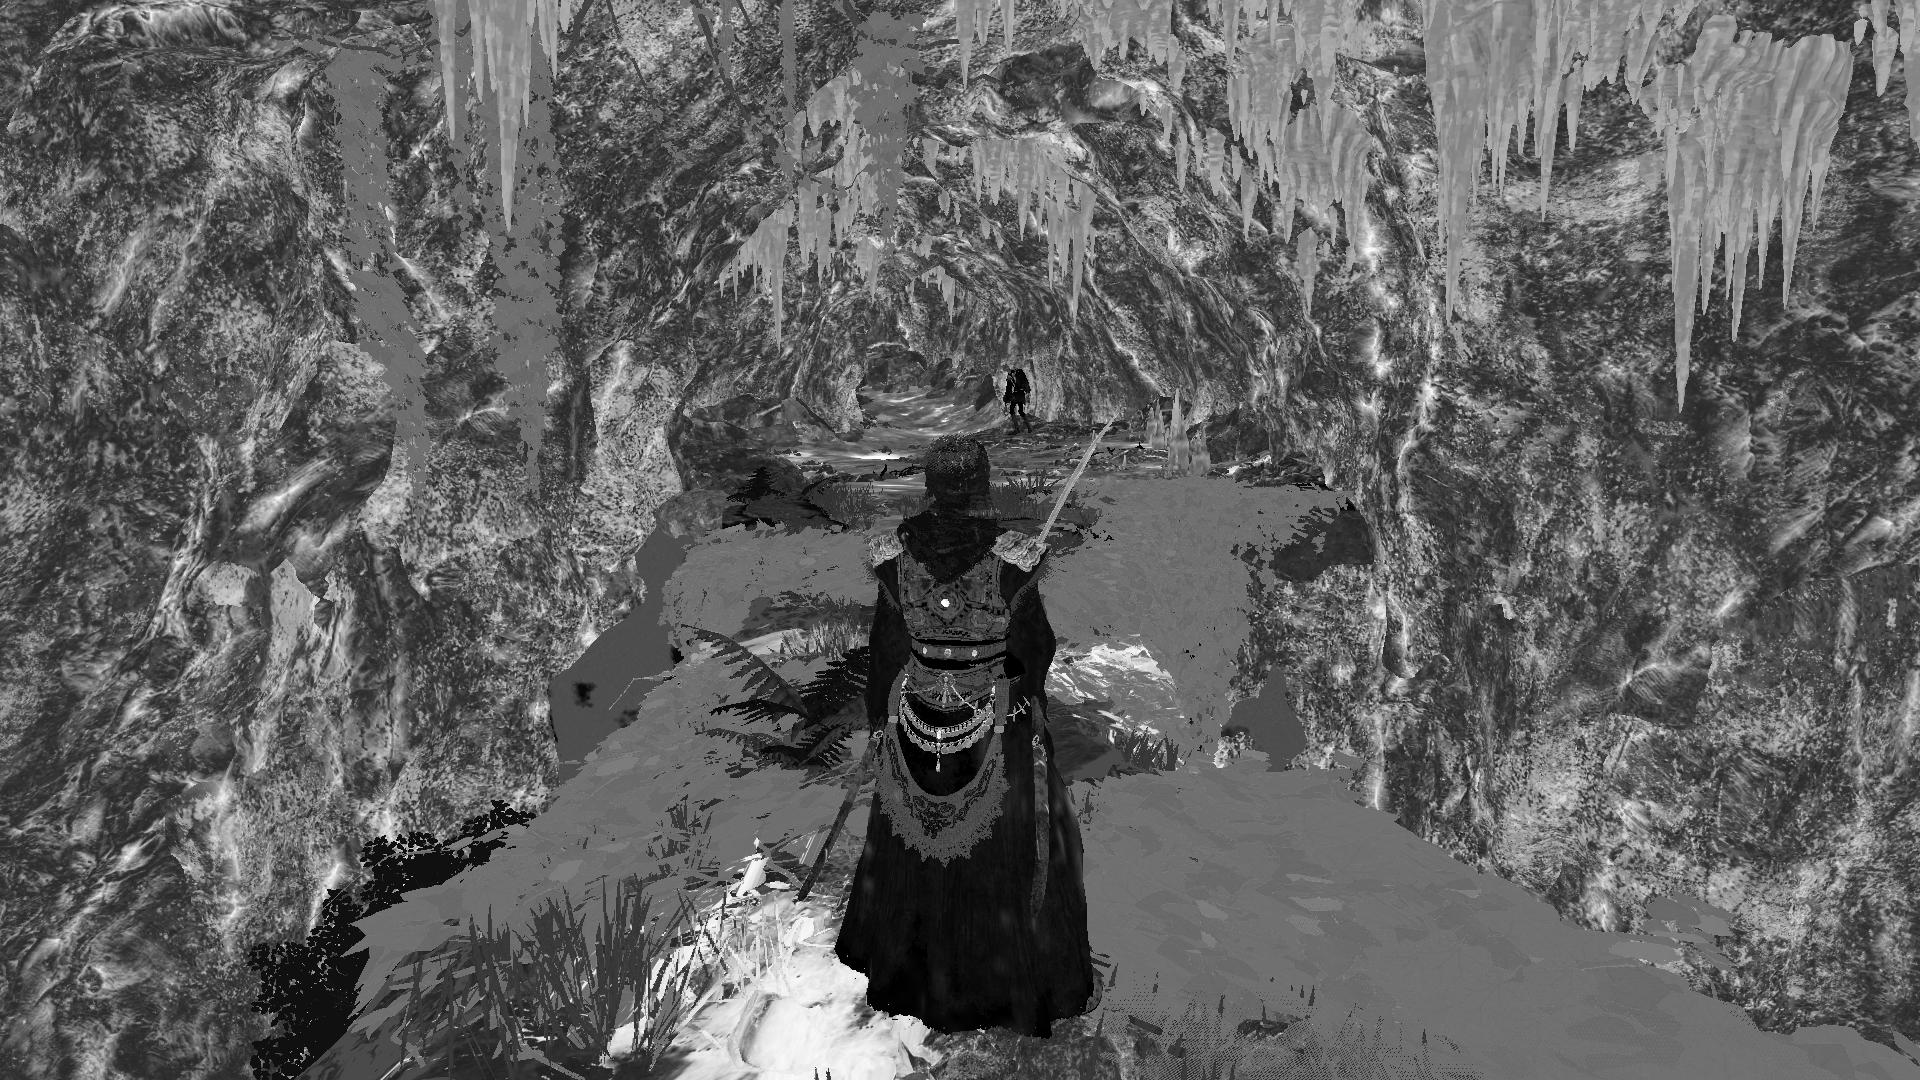
Depth of Field
Depth of Field in Elden Ring is cinematic/cut-scenes effect only, and it has no presence so far in the game. it could make sense at some aspect to not have any sort of DOF during gameplay, but many games have successfully utilized it as sort of gameplay mechanic that help driving the player or limiting their vision due to story elements. Anyways, I can’t judge the decision, and possibly DOF could be altered later in the game (i doubt is -_-) but in general this is how it looks.


The CoC for DOF is a R10G10B10A2_UNORM that is rendered in half resolution, so for my experimentation at 1080p, those blue-ish CoC were rendered at 540p (960*540).
Now that 1/2 resolution CoC is downscaled one more time (well, can’t blame DOF for being DOF!) to reach 480*270, then that 270p is taken through multiple execution of the same fragment shader, in order to do the DOF magic in different layers of blurriness and approximate the depth vs separation of background, foreground and focused elements.
It is worth mentioning that the number of DOF fragment shader execution is kinda fixed to 5 until it reach the amount of blurriness that is desired by From Software’s team. This overall blurriness is depending on the where the focused element is & how much % of the frame it occupies. Do we have (foreground + focused element + background), or it’s a (focused element + background only). For example:

In that previous case we don’t have any foreground elements, but things would differ a little bit if we’ve a foreground element. because there will be some distinguished separation between the 3 elements. So, let’s look in another frame
Separate


Then, Blur


Might be hard to see the difference, Middle Click on each and open all in tabs, and go through all of them!
Now i wanted to show those details, because of one reason, if the DOF is totally abandoned during gameplay, why it is till included in the graphics pipeline? The resource been created and filled with the fragment shader every frame (solid blue/0), not only that, but it goes through an entire DOF pipeline where the image rendered in 1/2 to 540p and then get halved again to 270p, and then those recourses keep jumping around as shader inputs/outputs. This could be simply bypassed in CPU calls to renderer, and we could have saved some frame time, specially if we really needing it during gameplay (remember, said i never hit 60fps in the open world)!
For curious people, below is the struct with all DOF params that are passed to the fragment shader.
DOF Params
struct DofParam
{
	float4 g_vDepthComputeParam;
	float4 g_vNearFarParam;
	float4 g_vScreenSize;
	float4 g_vLensParam;
	float4 g_vNoBlurDist;
	float4 g_vVelomapParam;
	float4 g_vClipCoC;
	float4 g_vSampleScale;
	float4 g_vDebugMode;
	bool2 g_bCocModeLinear;
	bool g_bNearFarSeparateBlur;
	bool g_b1stDownScale;
	float4 g_vCoCFade;
	float4 g_vTemporalParam;
}
Again, not sure about how do you handle your alignments, but personally I don’t like to align that way!
Depth of Field in general is one of my top favorite techniques/effects in realtime 3d rendering, and with all that said about Elden Ring’s DOF, i just wants to mention that i L💘VED the DOF quality in that game! They’ve nailed it!
Color Grading (Prepare)
Check Step [7] of the Compute queue.
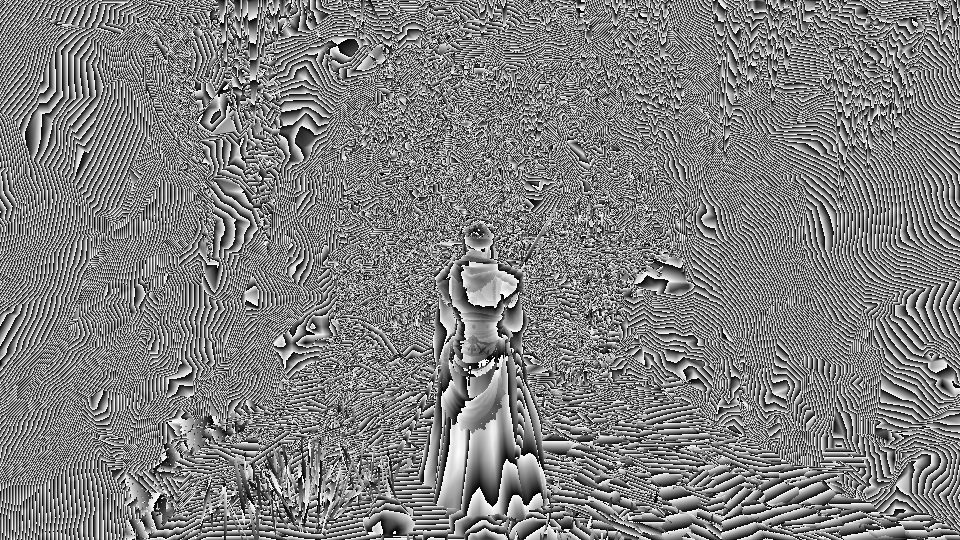
AA
Anti-Aliasing is Temporal in Elden Ring. Nothing fancy, the game just generate pixels velocities render target (aka “move” render target in that game) and use it between previous and current frame to do the trick!


And of course, that’s the shader parmeters set passed to this stage
AA
struct AA
{
	float4 g_vScreenSize;
	float4 g_vFilterParam;
	float4 g_vScreenSizeHalf;
	float4x4 g_mCurToPrevScreen;
	float4 g_vOrignalVelocityEncode;
	float4 g_vFeedBackParam;
	float2 g_vSharpenRange;
	float g_SharpenIntensity;
	float g_SubPixelFeedbackFactor;
	float4[4] g_FeedbackWeightScale;
	float g_PrevRelativeExposure;
	float dmy;
	float2 dmy2;
	float2 g_vScreenPercentage;
	float2 g_vScreenPercentage_Primary;
	float2 g_vScreenPercentage_Prev;
	float2 g_vScreenPercentage_PrevPrimary;
}
Glow (Bloom)
A sequence of scaling of the output of the frame, 6 times, by 1/2 for each time, we ending up with 7 cascades until we reach the 1/2 of the original frame size (960*540).


Of course, as the habit goes with bloom, when the time comes, those are not used at their size 😅 they scaled back up to the full screen/resolution space, so at “use” time you can think they would look more like that (those are not an actual resolution sizes, just for demonstration).


Glow Param
struct GlowParam
{
	float4 g_GlowScaleOffset;
}
A very simple single value passed to that shader.
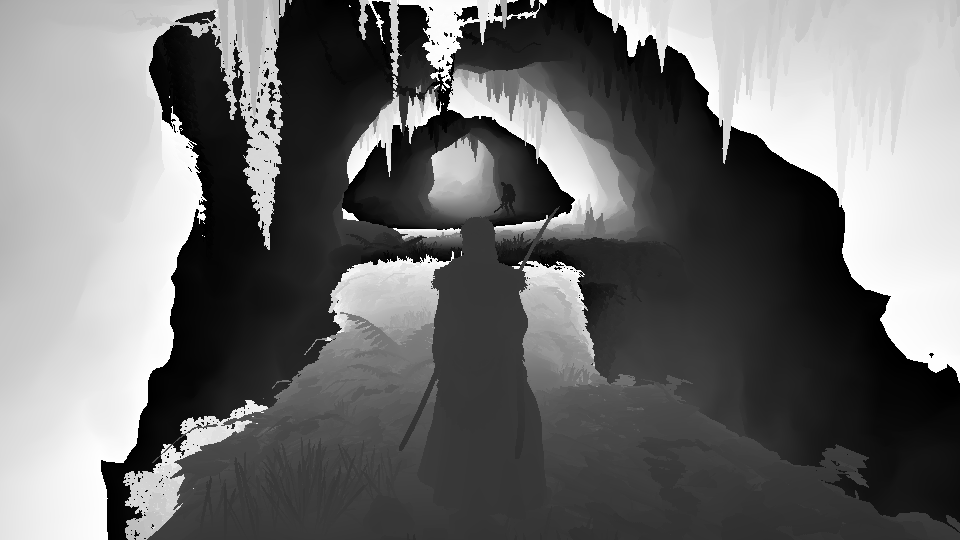
Downscale
At this step, The current state of the actual frame is downscaled by 1/2, as this halved version will be needed now on for all the upcoming post-processing steps. Assuming I was running a 1920*1080, at this step we end up with 960*540 at R11G11B10_FLOAT. Nothing fancy at this step, and no special shader parameters or something.

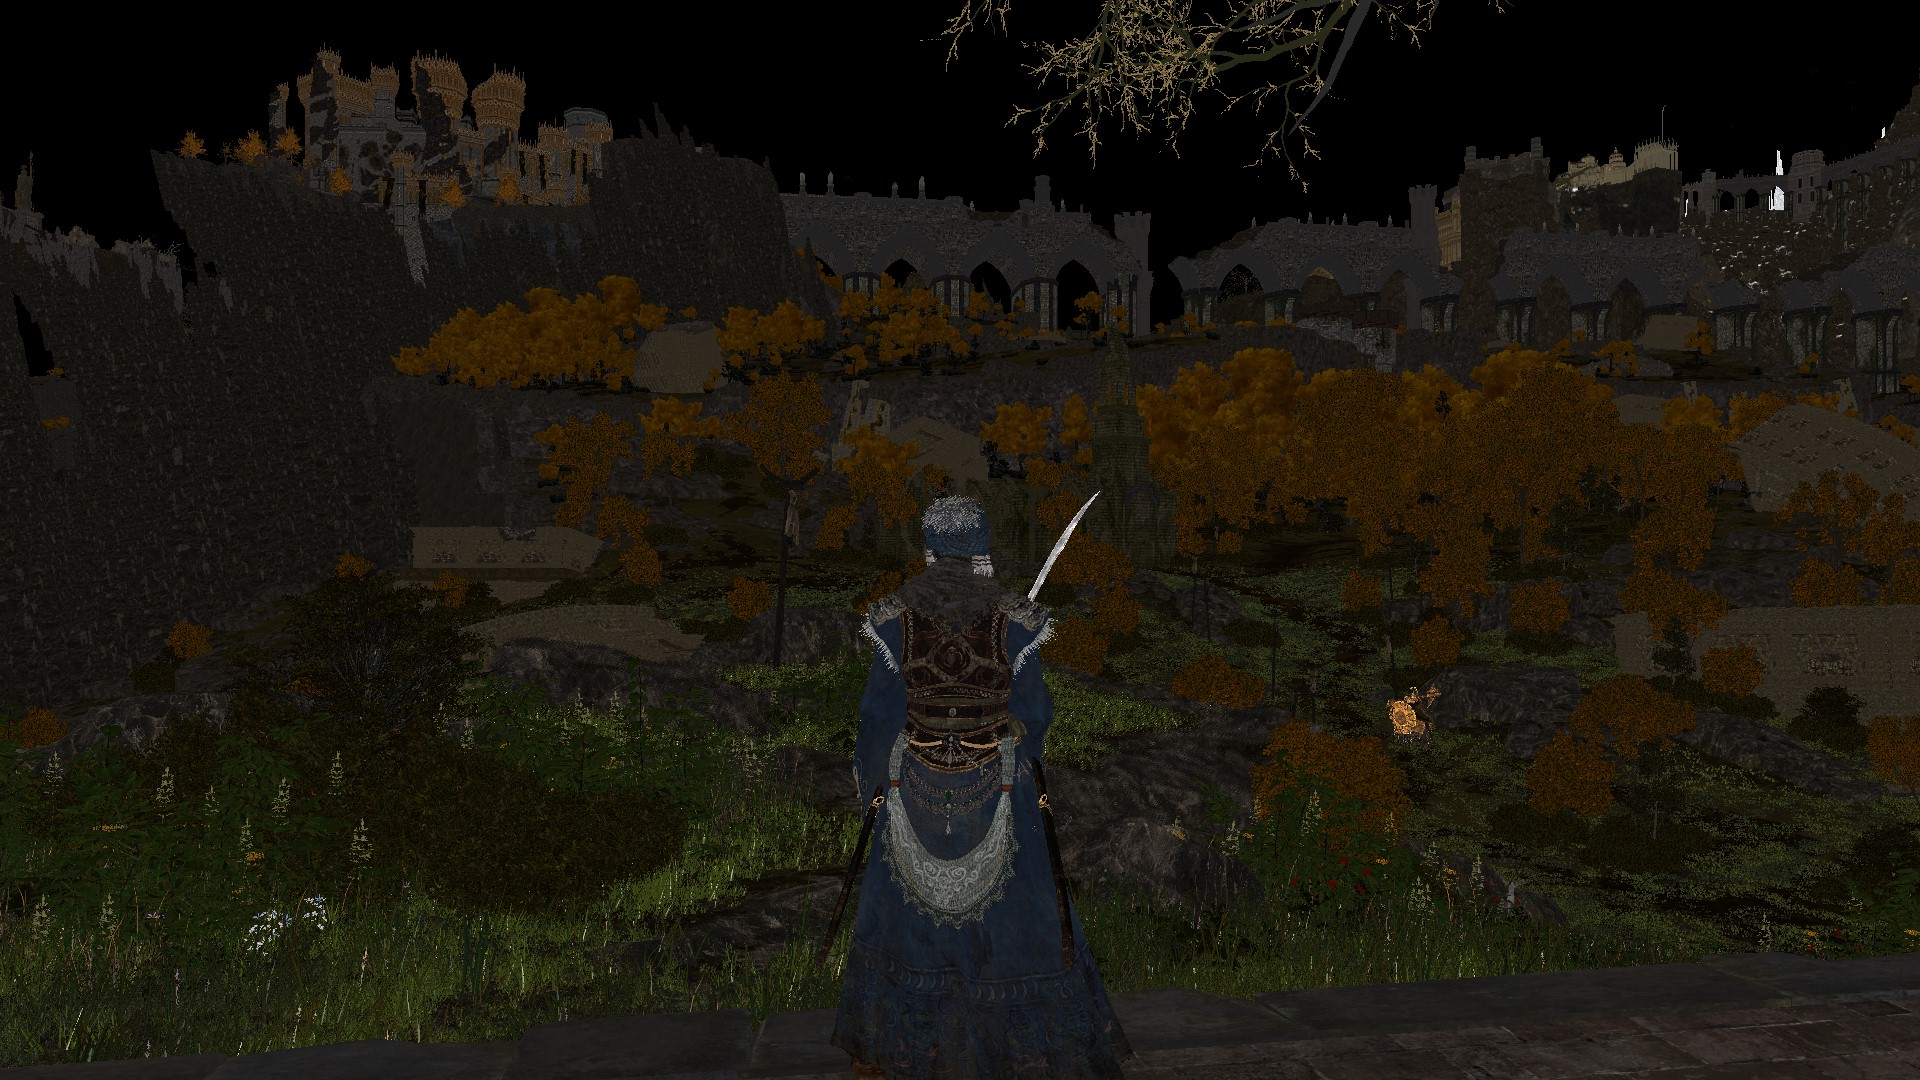
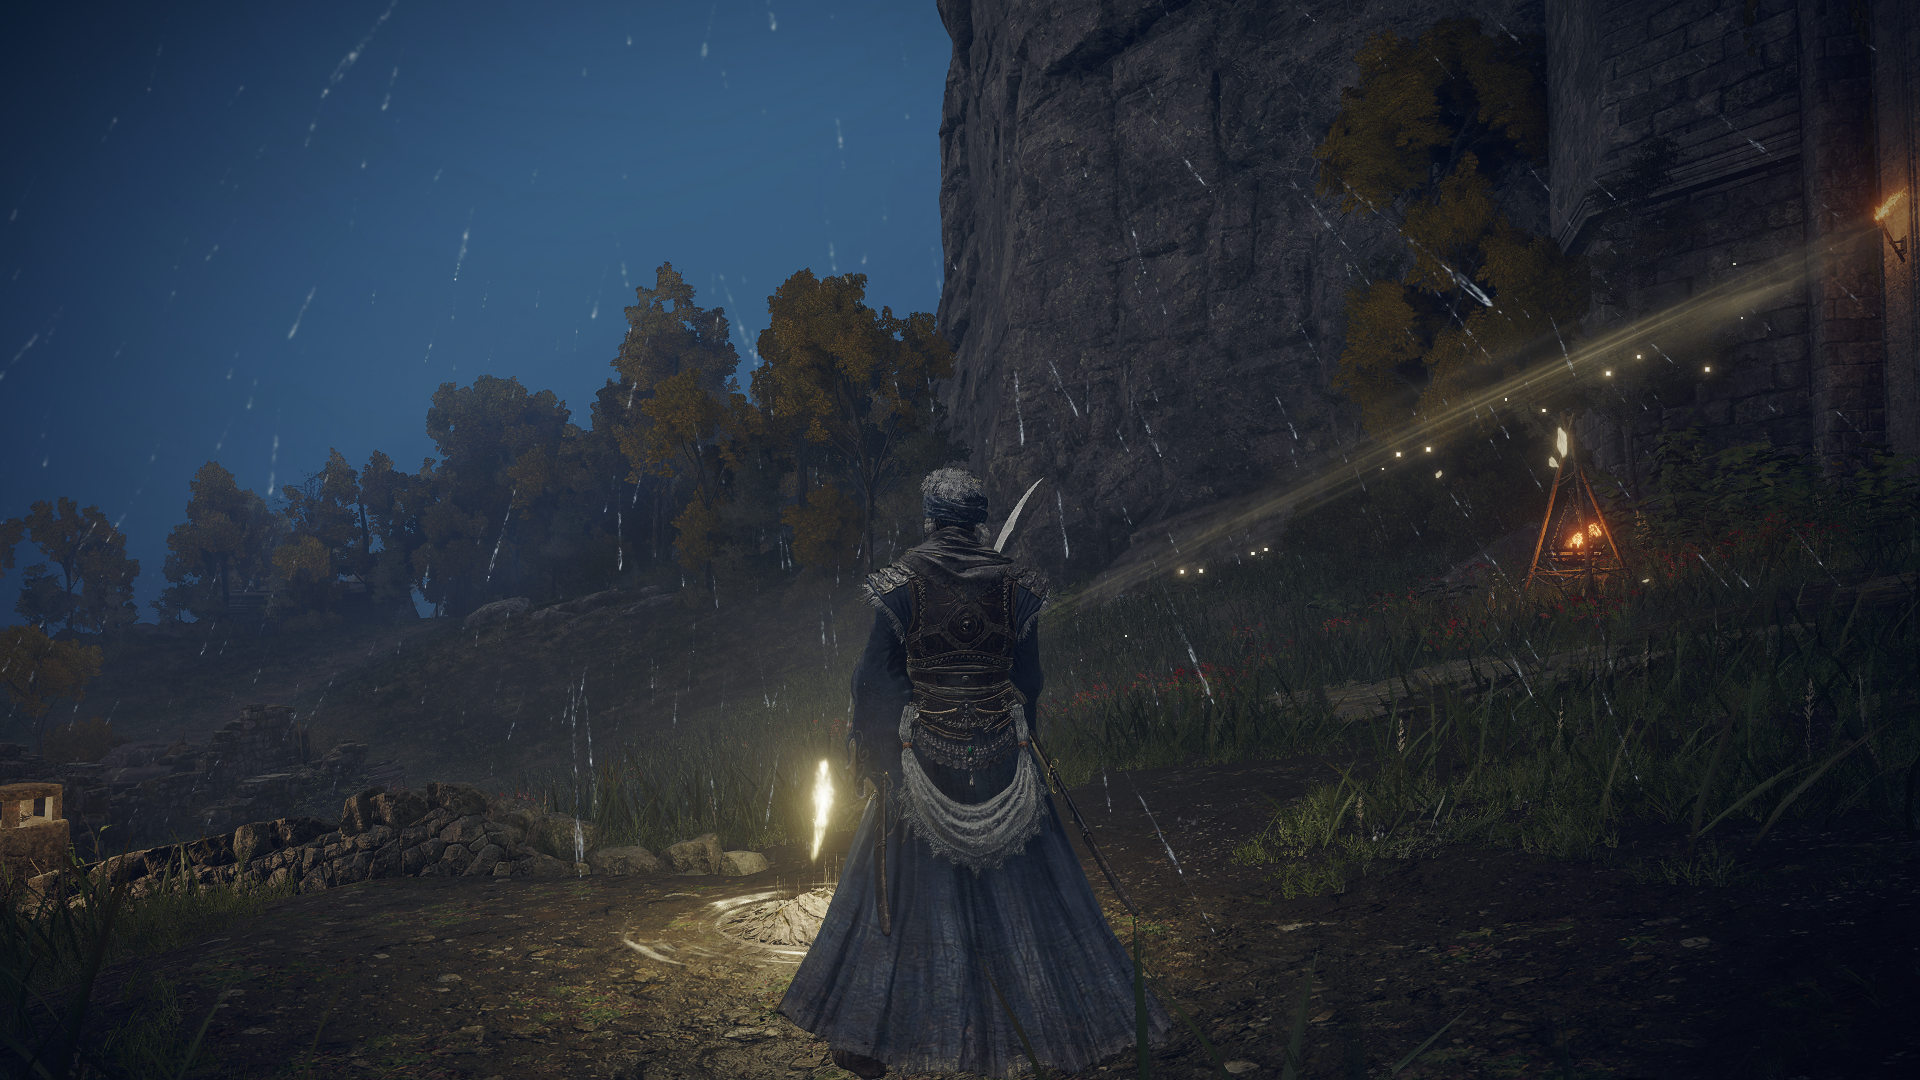
Keep in mind that the images above is slightly modified for clarification, as at this point the frame is very dark, no tone mapping, no gamma correction, nothing yet. But if you seeking the actual frame that gets into this step and the actual frame that gets out of that downscaling steps, it’s that ones below


LightShaft
While Light Shafts post-processor is exist, but I failed to find a good use of it. Even with the most extreme looking frames such as the one i’ve included here, it is still not looking like 100% how light shafts results would looks like. But it is what it is!
The one thing to mention here, that the Light Shafts effect is working on a given 1/2 res frame, not the entire full frame.
Also another thing to mention here, while i did prefer to list the light shaft here, just right before the Glare/Bloom post-processor, but in reality it happens “in the middle of” the Glare/Bloom. As you will see below, the Glare/Bloom happens in 3 separated steps, but light shaft happens just right after the 1st step (the Generation step), and before the completion of the Glare/Bloom (the 2nd & 3rd steps). This could be possibly area of improvement, it might not change much (or any) int terms of performance, but not everything is about Img Quality & Performance, it’s sometimes about Tidy, Clean code & pipeline.
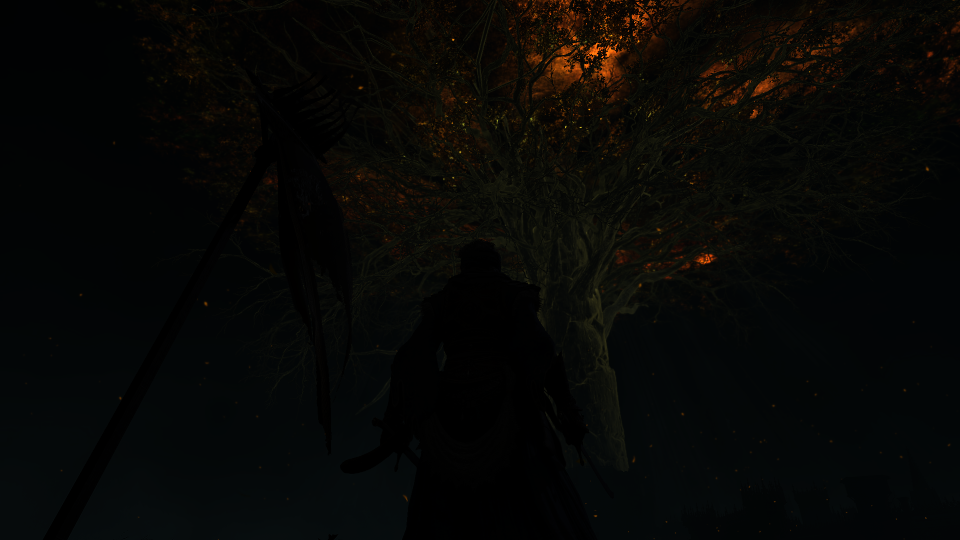


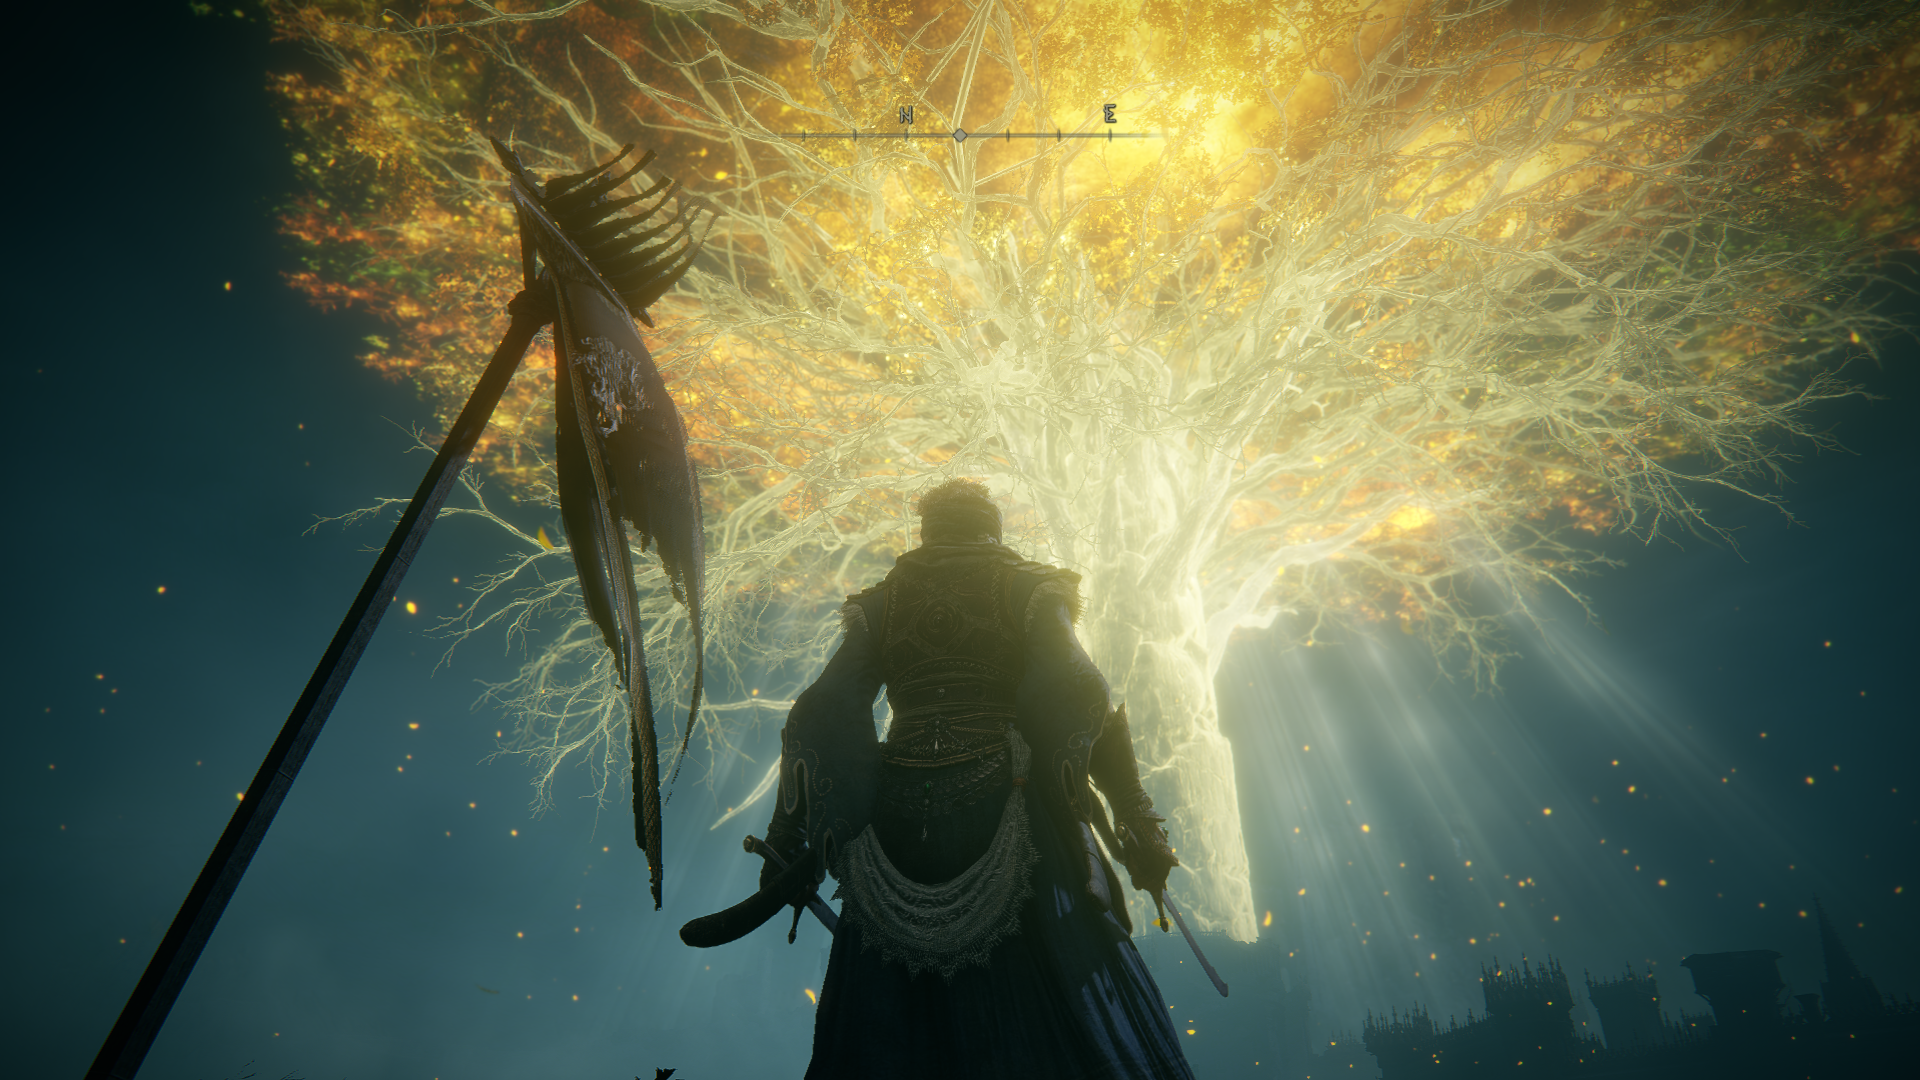
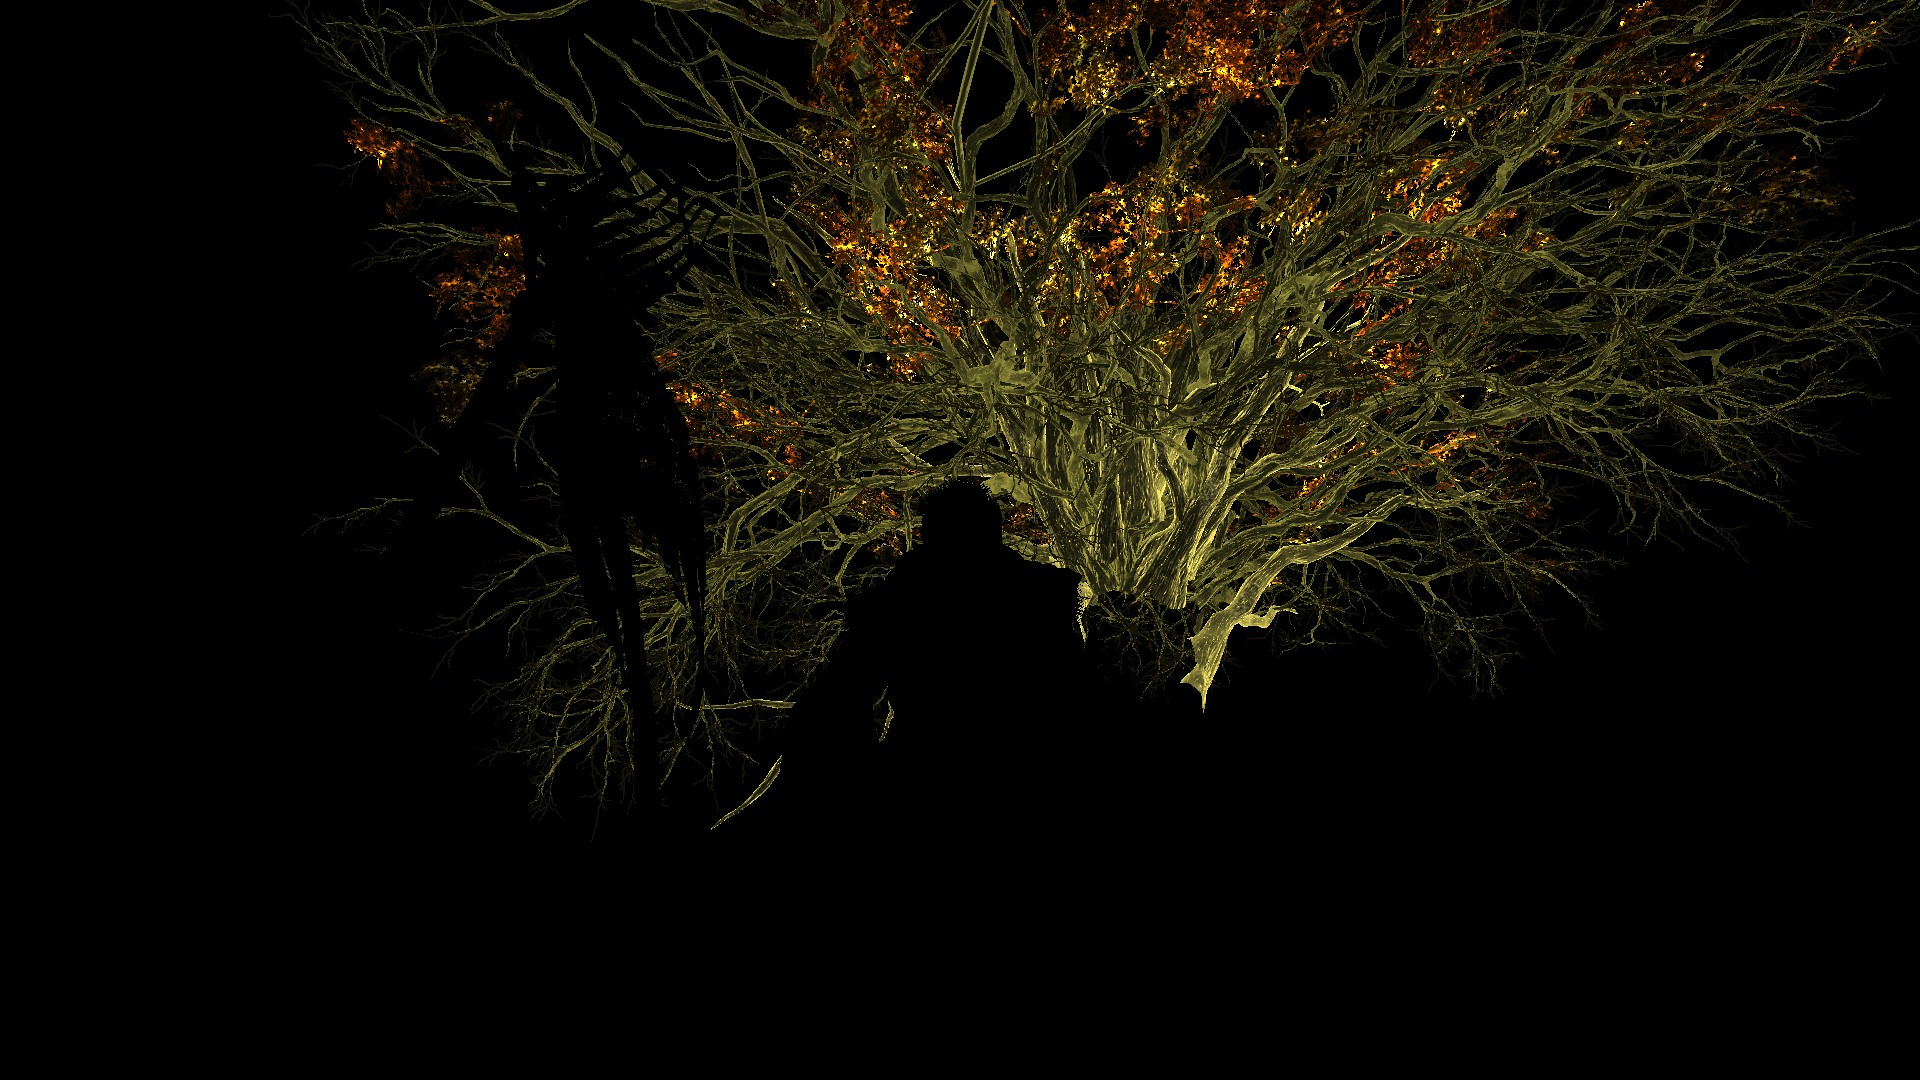
I did want to grab that exact frame/area for Light Shafts demonstration, because if there is “real” Light Shafts in that game, then there isn’t a better place to show it than the lovely Erdtree. So, i just wanted to say that those extreme Light Shafts you seeing (or others would call God Rays) is just mesh with transparent texture & some billboarding flavor maybe, and not actual post-processor.


You can look at the boosted version of the deferred frame before any post-processing below…it’s just a mesh! But have to say, final result looks okay.

The existence of the Light Shaft step in the post-processor, imply that it either was a feature in the plan or was already there and been cut. I’m saying that because at many areas of the game, where you would expect God Rays here and there, you can’t see anything made as Light Shafts, and the Light Shafts shader takes a 1/2 frame resolution and outputs a SOLID BLACK. So it still run, it still calculates, but just filling a needless texture in black and keep passing that resources to the other following steps.
Light Shaft
struct LightShaft
{
	float4 g_SkyMaskParam;
	float4 g_SkyMaskBlurParam;
	float4 g_SkyMaskCenterVec;
	float4 g_SkyMultiplyColor;
	float4 g_SkyAddColor;
	float2 g_CameraFovTangent;
	float g_SceneColorSaturate;
	float g_SceneColorThreshold;
	float4 g_SkyMaskBlurParallelDir;
}
AL-IGN-MENT!!
Glare(Bloom)
Heads-up, I’ll be always referring to that effect as Glare/Bloom, as I see it and knew it always as Bloom, but the developers of Elden Ring most of the time refers to it in the code as Glare (well, in very few areas they referred it as Bloom too!) where other times they refer to the exact same thing as Glow. So I’m trying to use both common terms, just in case you are none-native English speaker such as myself and you’re familiar with one term more than another.
Bloom takes place in several steps, not all done at once, and not all using same shader. Unfortunately Elden Ring could have done this better by utilizing compute shaders for most of those steps if not all of them!
Generate Glare/Bloom
Generating what so called the “Accumulation Texture” that is used later to apply the Glare/Bloom effect. This is very typical sizing down for the frame’s (6 times, by 1/2 for each) as seen in a previous step.
Tone Mapping Glare/Bloom
Now the Accumulation Texture itself in a none-useable state right now. Or maybe this is what it looks like. If that texture is applied at the moment, it would darken the frame, and hence a Tone Mapping is applied to the Glare/Bloom Accumulation Texture in order to put it in the right color space. The Tone Mapping used here (for the Glare/Bloom adjustment) is the exact same algorithm as well as the exact same set of shader params that is used late (below) to apply a Tone Mapping to the entire frame before finalizing the post-processing pass.


The texture format (R11G11B10_FLOAT) as well as the size (1/2 frame = 960*540) is same for the Accumulation Texture, it’s not blitted, scaled or transformed in anyway during that step.
Apply Glare/Bloom
Now all what is left to have a nice Glare/Bloom around luminance pixels, is just to composite that well earned Accumulation Texture to the current frame.

Tone Mapping
A simple Reinhard tone mapping technique is utilized for Elden Ring, nothing very fancy or very innovative as it seems, and i don’t think there is a need for any complications here, this game selling a mode, and i believe that Reinhard is known for being artistic more than realistic. Below are the inputs and output of that post processor, as well as full details of the shader input params.


Keep in mind, for the sake of demonstration here, I put the Glare/Bloom output as the input for the ToneMapping phase (R10G10B10A2_UNORM), but in fact, because both happens in the same shader at same call, it’s hard to capture the output result of the Glare/Bloom alone, so in the real frame execution both of them (Glare/Boom and ToneMapping) is taking the exact same input frame (R11G11B10_FLOAT), which is that one below


Tone Map
struct ToneMap
{
	float3 g_ToneMapInvSceneLumScale;
	float4 g_ReinhardParam;
	float4 g_ToneMapParam;
	float4 g_ToneMapSceneLumScale;
	float4 g_AdaptParam;
	float4 g_AdaptCenterWeight;
	float4 g_BrightPassThreshold;
	float4 g_GlareLuminance;
	float4 g_BloomBoostColor;
	float4 g_vBloomFinalColor;
	float4 g_vBloomScaleParam;
	float4x3 g_mtxColorMultiplyer;
	float4 g_vChromaticAberrationRG;
	float4 g_vChromaticAberrationB;
	bool4 g_bEnableFlags;
	float4 g_vFeedBackBlurParam;
	float4 g_vVignettingParam;
	float4 g_vHDRDisplayParam;
	float4 g_vChromaticAberrationShapeParam;
	float4 g_vScreenSize;
	float4 g_vSampleDistanceAdjust;
	uint4 g_vMaxSampleCount;
	float4 g_vScenePreExposure;
	float4 g_vCameraParam;
}
Alignment!!!
Post Process Common
struct PostProcessCommon
{
	float2 g_dynamicScreenPercentage;
	float2 g_texSizeReciprocal;
	float2 g_dynamicScreenPercentage_Primary;
	float2 g_primaryTexSizeReciprocal;
	float2 g_dynamicScreenPercentage_Prev;
	float2 g_prevTexSizeReciprocal;
	float2 g_dynamicScreenPercentage_PrevPrimary;
	float2 g_prevPrimaryTexSizeReciprocal;
}
This Tone Mapping step of the post processing pipeline is quite misleading in terms of the name. The Tone Mapping is the “distinguished” post processor that takes place at this step of multiple but glued few post processors, but as you might have noticed in the Tone Map struct (unfold above) that is passed to the shader, it’s name is misleading name for the struct, as it is much of a “global” post processor struct for few post processors that are all taking place at the same time within the same shader. So yes, it is called Tone Map, and yet we do Tone Mapping by now, but also other things are applied (if needed) thigs such as Brightness, Contrast, Vignette, Chromatic Aberration, Glare/Bloom, Lens Distortion & Color Correction. For example, in a previous step pre the Tone Mapping we mentioned a “Bloom/Glare” step taking place. This earlier step of Glare is only about “preparation” but the actual application of the Glare is taking place at the exact same time/shader of the Tone Mapping (or perhaps at the Color Grading step that is mentioned next).
Color Grading (LUT)
Nothing very fancy here, just a usual 16*16*16 single 3d texture per desired mood for the frame of the format R16G16B16A16_FLOAT, and it’s applied for gameplay as well as cinematic. Keep in mind, in the examples below, you might notice change in the “tone” as well as some “glare” between the frames before and after the Color Grading step, and this is okay, as it seems that it’s a single shader that is used to apply Tone Mapping, Glare as well as to apply Color Grading at the same time. Its single shader with a single set of parameters mentioned previously in the Tone Mapping & Glare sections above. So, the results below are not 100% outcome of applying Color Grading only.


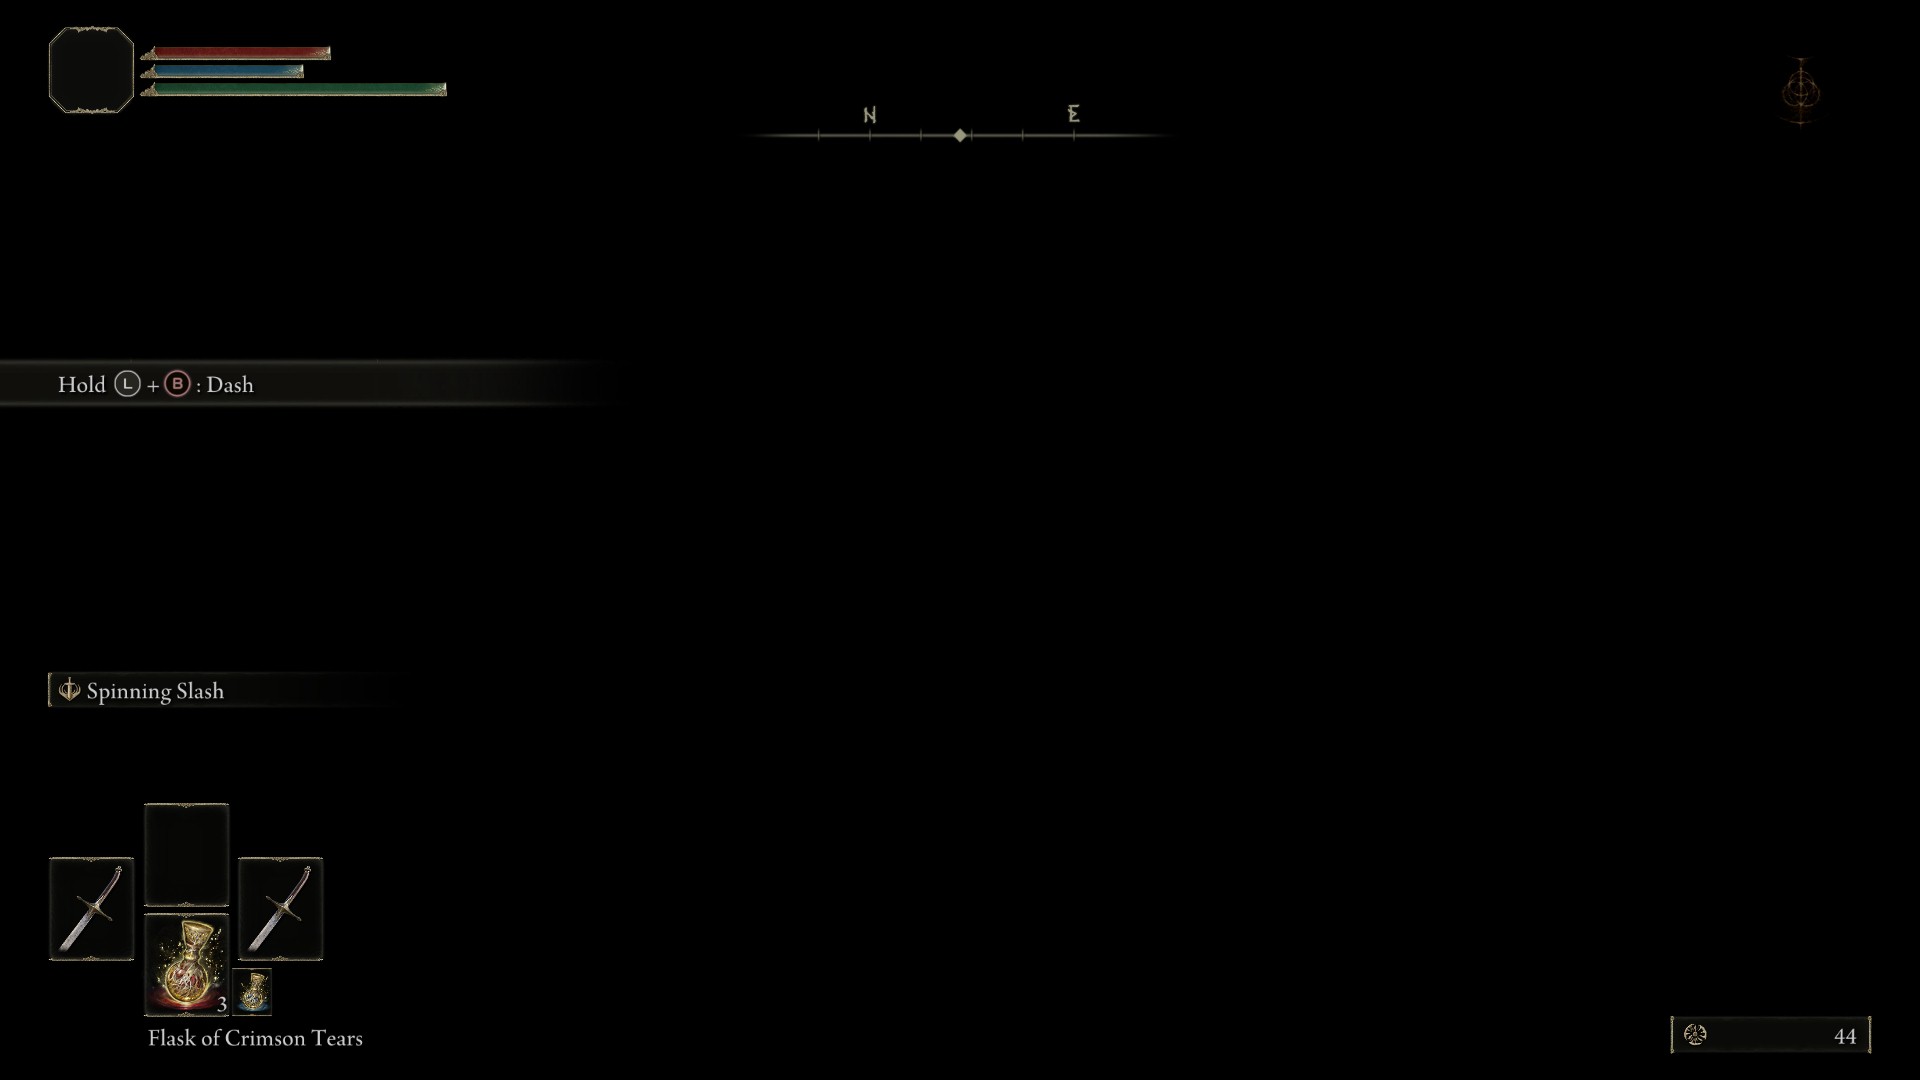
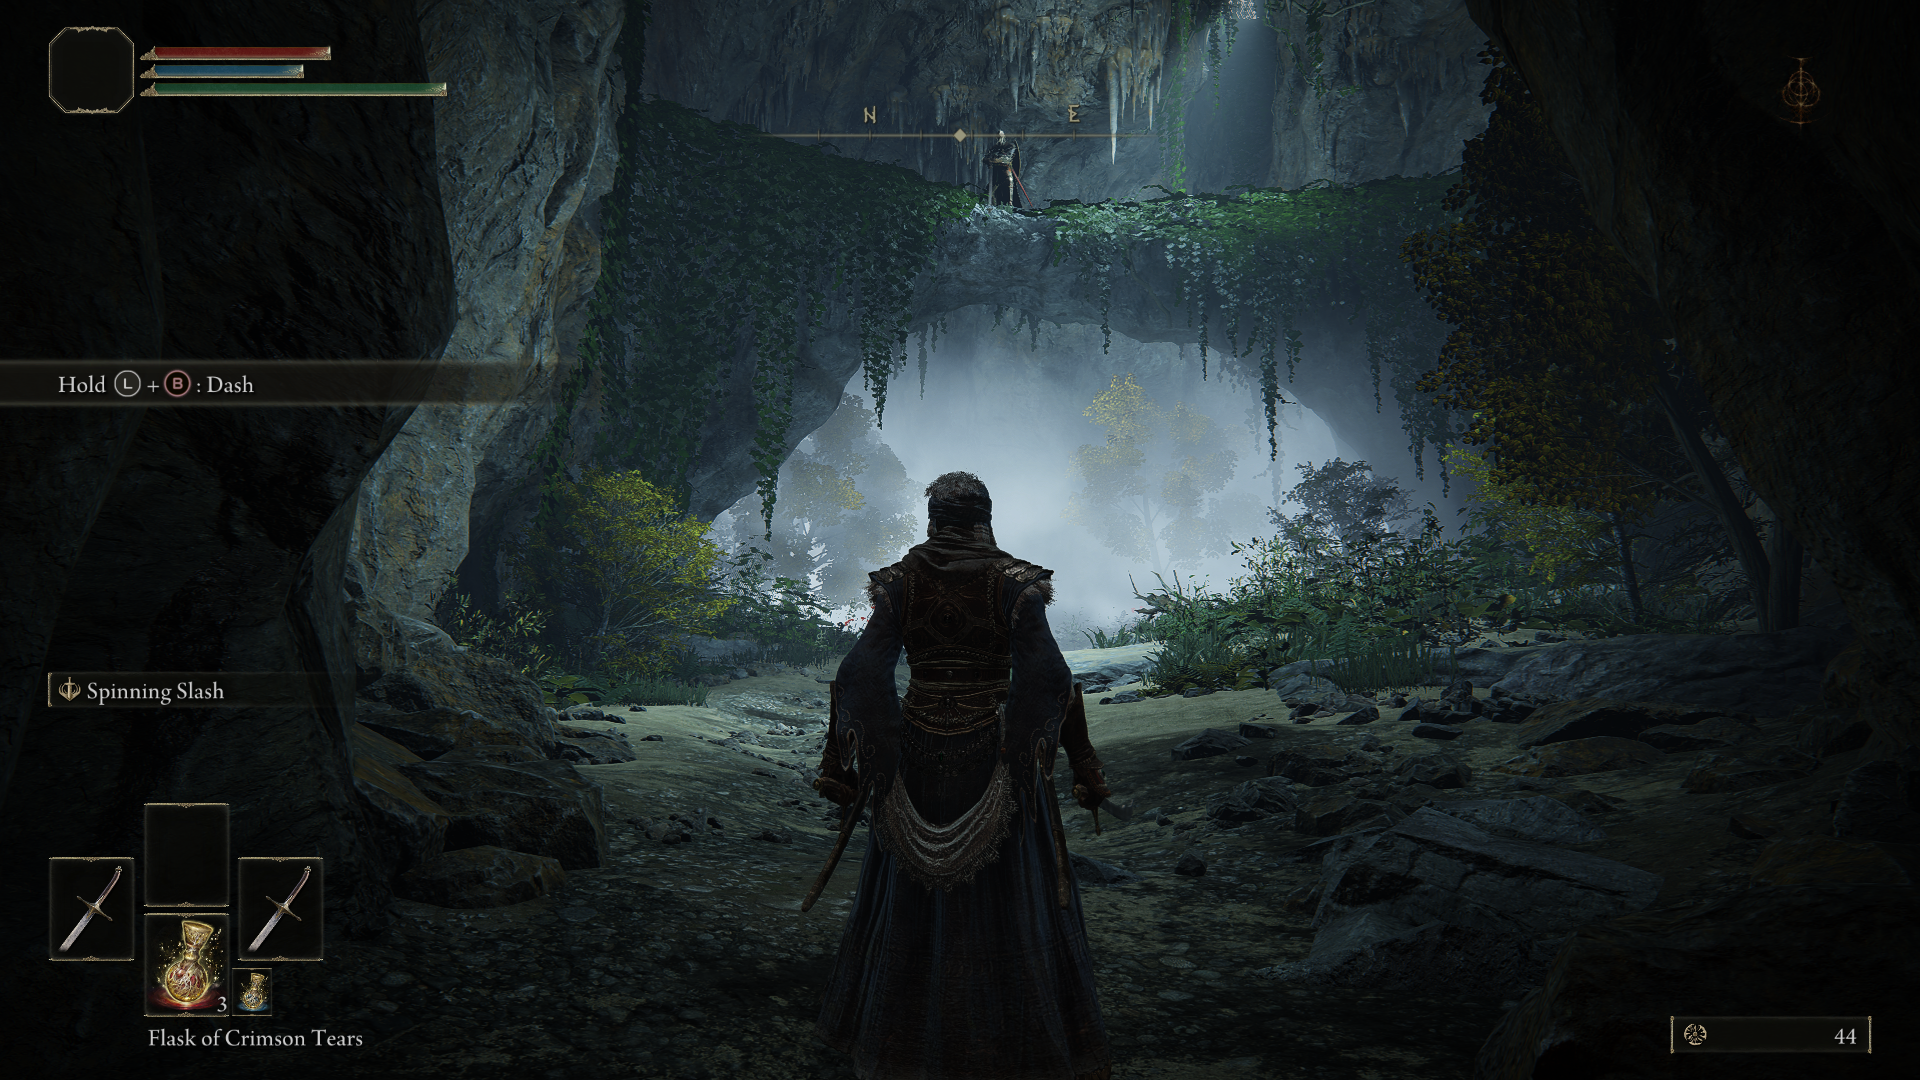
UI
Final Composite
By that time, we’ve two final render targets for all that work. It’s what Elden Ring’s engine refer to as HDRScene as well as UIScene, each is a size of 1920*1080 (or whatever your target resolution set in the game settings) at R8G8B8A8_UNORM format. Keep in mind, while the later one is self explanatory, it’s just the entire game UI in a single image that will be put on top, the former one is hypothetically named “HDR” but it does not have to be HDR at all, for example I did play on my PC monitor’s which ain’t HDR, and at such case, the image is just the outcome of the entire rendering (as well as compute) queue. This is the final frame with all effects that is ready to present.
And of course, when the frame is from a cinematic, the UIScene render target is totally solid black with a full alpha, and this is yet another bizarre choice, because that 1080p is copied over to the final frame composite shader. Wouldn’t it be better if composite skipped at the case of cinematics? There is (as you will see below) a bool/int that is used at the shader side to skip the compositing, but still, the resource it self is passed to the shader, without the need to use it. Wouldn’t it be even better to pass a 1*1 texture at the case of cinematic, after all descriptors binding ahead of time is binding binding ahead of time!, but at least we can trick it with a cheap 1*1.
The shader params used for the composite fragment shader is as follow
Display Mapping Data
struct DisplayMappingData
{
	float outputGammaForSDR;
	int noUIBlend;
	int rangeAdj;
	int enableDithering;
	float noiseIntensity;
	float noiseScale;
	float uiMaxLumScale;
	float uiMaxLumScaleRecp;
	float uiMaxNitsNormalizedLinear;
	float4x3 mtxColorConvert;
}
I like it when the guy in the announcement trailer was saying “Oh,..The Elden Ring,…The Structures Alignment Ring”
So eventually HDRScene + UIScene, using the alpha channel of the UIScene, would result on the final pretty frame…Just like photoshop, except it’s runtime and every frame!
Personally, i would have drawn the UI right away to the final HDRScene, and save myself an entire fullscreen size render target, and you still have the luxury of skipping that pass altogether when UI is not needed (for example during a cut-scene). I do it like that in my engine, and as you might recall from the previous article, that GoW doing it like that as well!
Compute
Yet another shock from FromSoftware, yes they do make great games, but seems they’re always behind in terms of tech and latest features…well, if we consider “Compute” as something latest!!
Elden Ring is utilizing compute shaders during the course of it’s frames, but not that much. Or may be they use it quite a few times during the frame lifetime, but not “at it’s maximum” or not “at the most significant utilization” as we could see in other games released for the same gen or same year. To be fair, the game doing compute dispatch here and there, sometimes you would be amazed about the ideas, where other times you would feel it is either useless or could be made in another way. The compute queue in Elden Ring is done at the following order:
Compute States
| [Always] | This compute runs at every frame across the game. |
| [Outdoor] | This compute runs when we’re outside only, but in caves, dungeons, interiors,…etc. this would be absent. |
| [If Exist] | This compute runs if the rendered feature is exist at the meantime. Best (and only yet) example is GPU particles. |
1.Depth Down-Sampling [Always]
Just right after the “Depth Downsample” in the Graphics queue, and before the “SSAO”, this compute shader runs. This step “hypothetically” called Depth Downsample, but in fact no downsampling happens here, it’s just a continuation step to the actual Graphics Queue’s Depth Down-Sampling. Instead, the two results of the downsample (the 960*540 and 480*270 from Graphics Queue few steps ago) passed to this compute in order to use them to come up with this new 120*68 mask image below of the format R32G32_FLOAT that is seem to be used later for light source (Point & Spot) culling.


Down Sample Depth
struct DownSampleDepth
{
	uint2 previousLevelDimensions;          //1920*1080
	uint previousLevel;
	uint reserved0;
	uint2 currentLevelDimensions;           //120*68
	uint2 hiZDimensions;
	float2 persDepthParam;
	float2 orthoDepthParam;
	uint projType;
	bool enableOut1_8Depth;
	uint2 reserved1;
}
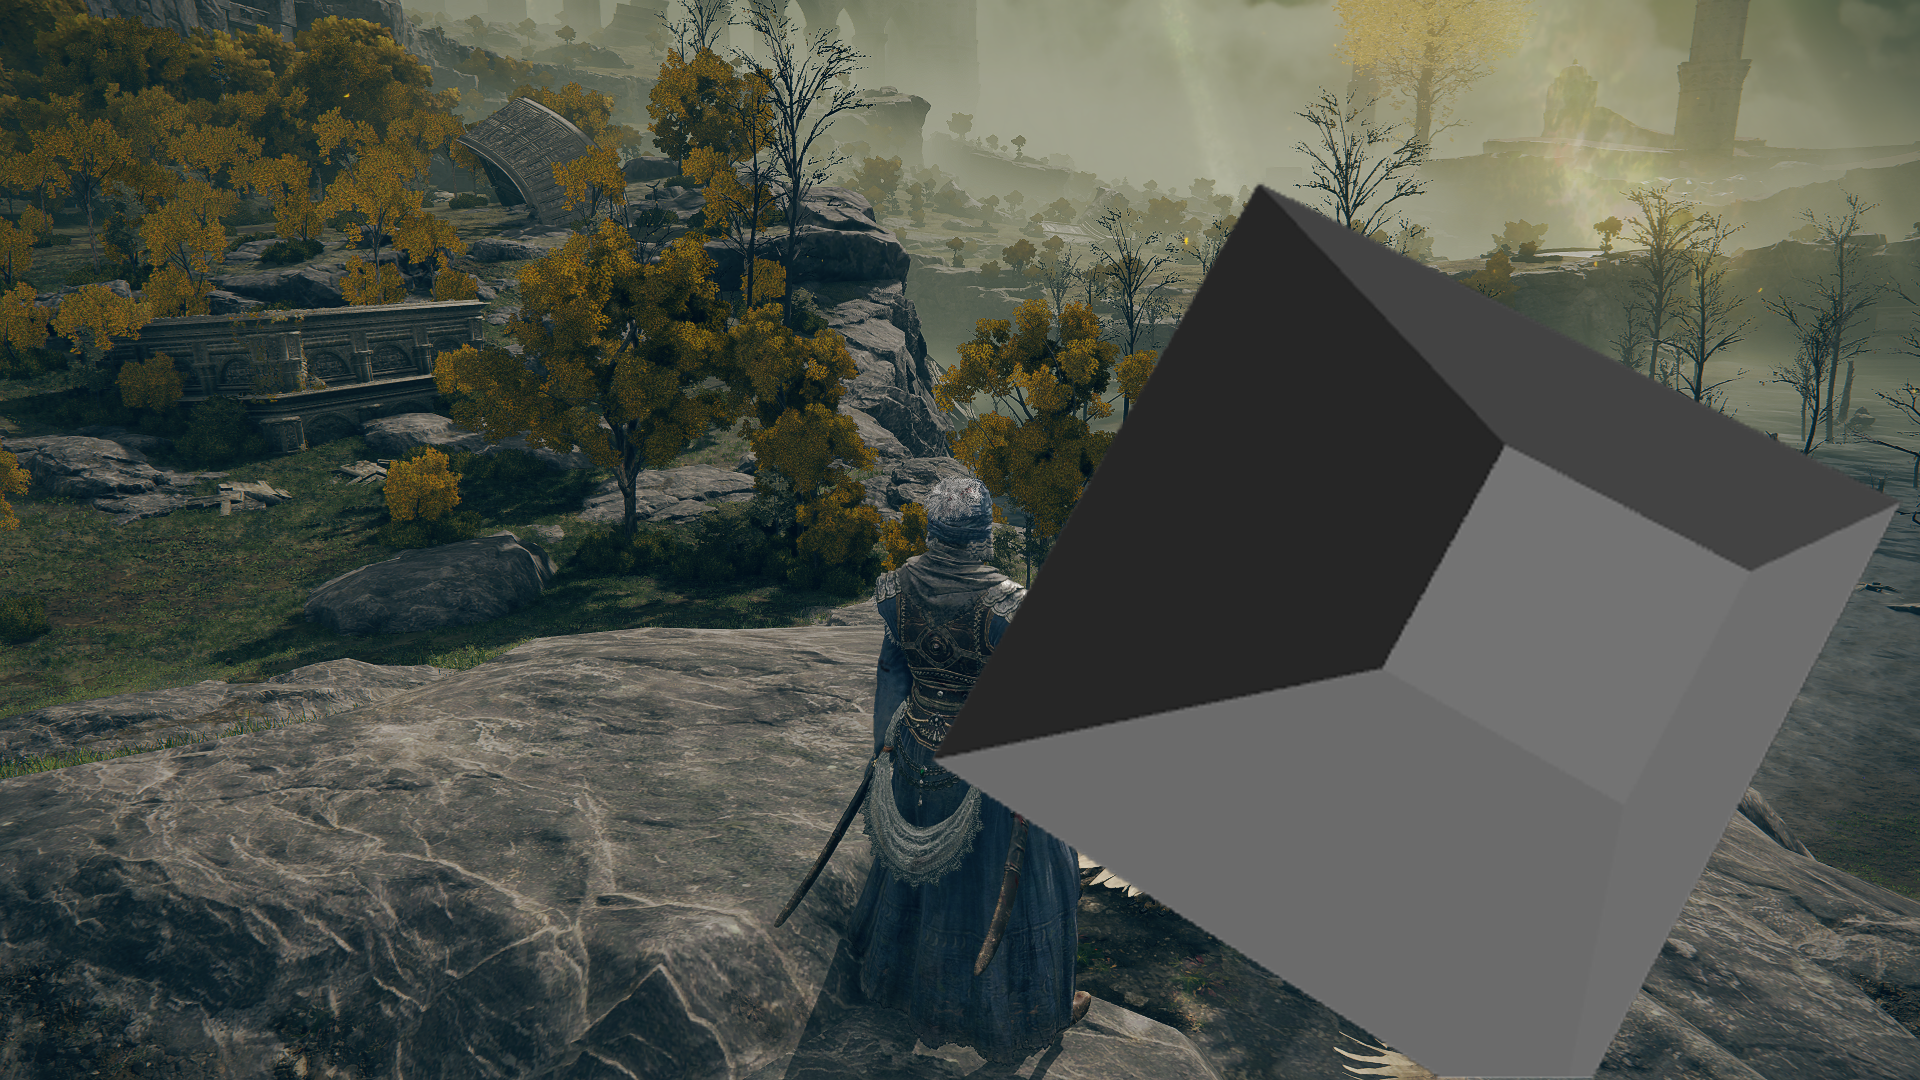
2.Cubemap Generation [Outdoor]
This step is not actually 100% generation, it’s seems to be more of “copying” step for a pre-baked cubemaps. A sequential set of compute dispatches takes place, the number of executions of this compute depends on the visible cubemap/reflection captures objects around the current loaded area. Where in many areas it will be 1 or 2 captures but other bigger areas/views (such as the one below) would have 9 different captures with 9 sequential compute dispatches.
Each of those dispatches is accompanied with a graphics queue draw cmd for a cube shape as if it is the capture mesh/placeholder representation in the game’s world. Each of these cube draw cmds is basically an Irradiance & Specular Accumulation draw call in the graphics queue (explained earlier). So you can think about those 9 draws (less or more than 9 in other cases) as a sequence of ping-pong between graphics and compute queues, a COMPUTE-COPY followed by GRAPHICS-DRAW repeated 9 times.
Each of those dispatches takes the following struct params as input for the copy compute shader
Cube Copy Param
struct CUBE_COPY_PARAM
{
	uint faceSize;
	float lerpRate;
	int numMipLevels;
	uint paddl;
}
The fun thing is, the numMipLevels value passed to the shader is always 5, but the final mip count you get in the texture view is always 8 mips ^_^
3.Light Culling [Always]
With that yellow-ish light mask that we got earlier from the Depth Down-Sampling step, passed to a compute shader (this) along side two Structured Buffer, one for the Point Lights and another one for the Spotlights, we end up with a Light Lookup Structured Buffer (aka table) along side some other accompanied structured buffers (Light Indices & Work Data) as an output for this what seemed to be tiled rendering compute.
Point Light – StructuredBuffer[1024]
struct PointLight
{
	float4 PositionAndRadius;
	float4 DiffColor;
	float4 SpecColor;
	float4 TransLightParam;
	float LightType;
	float3 Pad;
	float4 ProjParam;
	float4 ShadowCenterPos;
	float4 ViewportScaleOffset[6];
}
Spot Light – StructuredBuffer[1024]
struct SpotLight
{
	float4 PositionAndRange;
	float4 DiffColor;
	float4 SpecColor;
	float3 TransLightParam;
	float unused_ShadingMode;
	float4 ViewToLightSpaceMatrix;
	float LightType;
	float MinDist;
	float MaxDist;
	float Pad;
	float4 CullPositionAndRange;
	float4 ShadowParam;
	float4 ViewportScaleOffset;
}
Alongside the usual Scene Params passed to the shader (it’s passed to most of the shaders in the game), this compute takes an extra buffer params input that holds the Lights accumulation data (expectedly frustum, cells, lights counts,…etc.) , which is as follow
Light Acc Param
struct LightAccParam
{
	float4x4 g_InvProjMatrix;
	float4x3 g_ViewMatrix;
	float4 g_ScreenSize;
	float4x4 g_CameraMatrix;
	float4 g_specPowerParam;
	float4x4 g_ProjMatrix;
	uint g_lightCount;
	bool g_visualizeLightCount;
	uint g_spotLightCount;
	uint g_lightOrganizedBufferElements;
	float g_frustumNear;
	float g_frustumFar;
	float g_frustumSliceScale;
	float g_frustumSliceBias;
	uint4 g_lightTileSize;
	float g_ssrDepthThreshold;
	float g_ssrDepthFadeRangeRecp;
	float g_ssrFresnelThreshold;
	float g_ssrDisplayMipScale;
	float g_ssrDisplayMipOffset;
	float g_ssrReserved1;
	float2 g_ssrReserved2;
	bool g_isNeoOrScorpio;
	uint cbLightAccParam_pad22_y;
	uint2 g_emissiveCMaskInfo;
	float4 g_ViewportSize;
}
Alignment… ^_^
{WIP} – 4.Volumetrics [Outdoor]
{WIP} – …
{WIP} – 5.Shadows ??? [Always]
{WIP} – …
{WIP} – 6.GPU Particles [If Exist]
{WIP} – …
7.Color Grading [Always]
During this early step of Post processing, the game would prepare the color grading lookup table, aka the 3d LUT texture that will be used in the graphics’ queue to apply the “actual” Color Grading through a fragment shader.
With a given 16*256 of the format R8G8B8A8_UNORM

The compute will result on a 16*16*16 of the format R16G16B16A16_FLOAT that is used as input for the Color Grading post processor of the graphics queue.

It might be hard to see the difference in those PNG images, and the difference not in the row counts vs columns, in fact it was my choice to make the later one in two rows of 8 slices (total 16) so i can distinguish them quickly. But the difference is in the textures depth as well as the DXGI_FORMAT format. By depth i mean the 1st given texture to the compute is a regular 2d texture sampler, where the output of the compute is a 3d texture (XYZ slices). So you can say, this compute is a conversion shader from 2DTexture to 3DTexture.
I would say that this is totally a none essential repetitive step that occurs every single frame regardless we’re at gameplay or cinematic, and it is not just something that takes place once at the start of a level. And this would have been better if it is a pre-baked resource earlier before cooking the game data, just like many many other games. A tiny compute dispatch in the queue per frame with thread groups (1, 1, 16) might not be an issue at all, but if you keep seeing little things won’t “add up” to the frame’s cost, you at a sudden will have a big group of many tiny issues that defiantly will “add up”!
Life of a Frame [Rendering Graph]
So, after learning about what are the candy hidden in the graphics queue as well as the compute queue, it’s the time to reconstruct the entire frame’s rendering pipeline/graph (for a typical/golden frame that possibly include as mush as possible of the features) and have a pseudo visual diagram for a frame’s journey.
And of course, it can’t be a Behind The Pretty Frames without a full frame re-construction video[s]. Again, i do love look at such video or steps, and see how long it takes me with my normal average human processing speed to see every step, for the frames in Elden Ring, it was ~10 minutes of observation for a single frame (video or reconstruction process), but the wonder here still that the computation speed we reached, that entire 10 minutes of reconstruction steps is happening at runtime with average of ~45fps (60fps cinematic) at my machine. And while it’s my daily job and I’m aware of that, and because it is something i/we get exposed to every day, it becomes “normal” that “yeah, we render AAA at 60 frames per second”, but as soon as i see the steps one by one in such format, and even though in the back of my head I know it’s normal for the processing/computation hardware we’ve nowadays, I’m still always speechless!
Gameplay Frame
Cinematic Frame
Engine General Observations
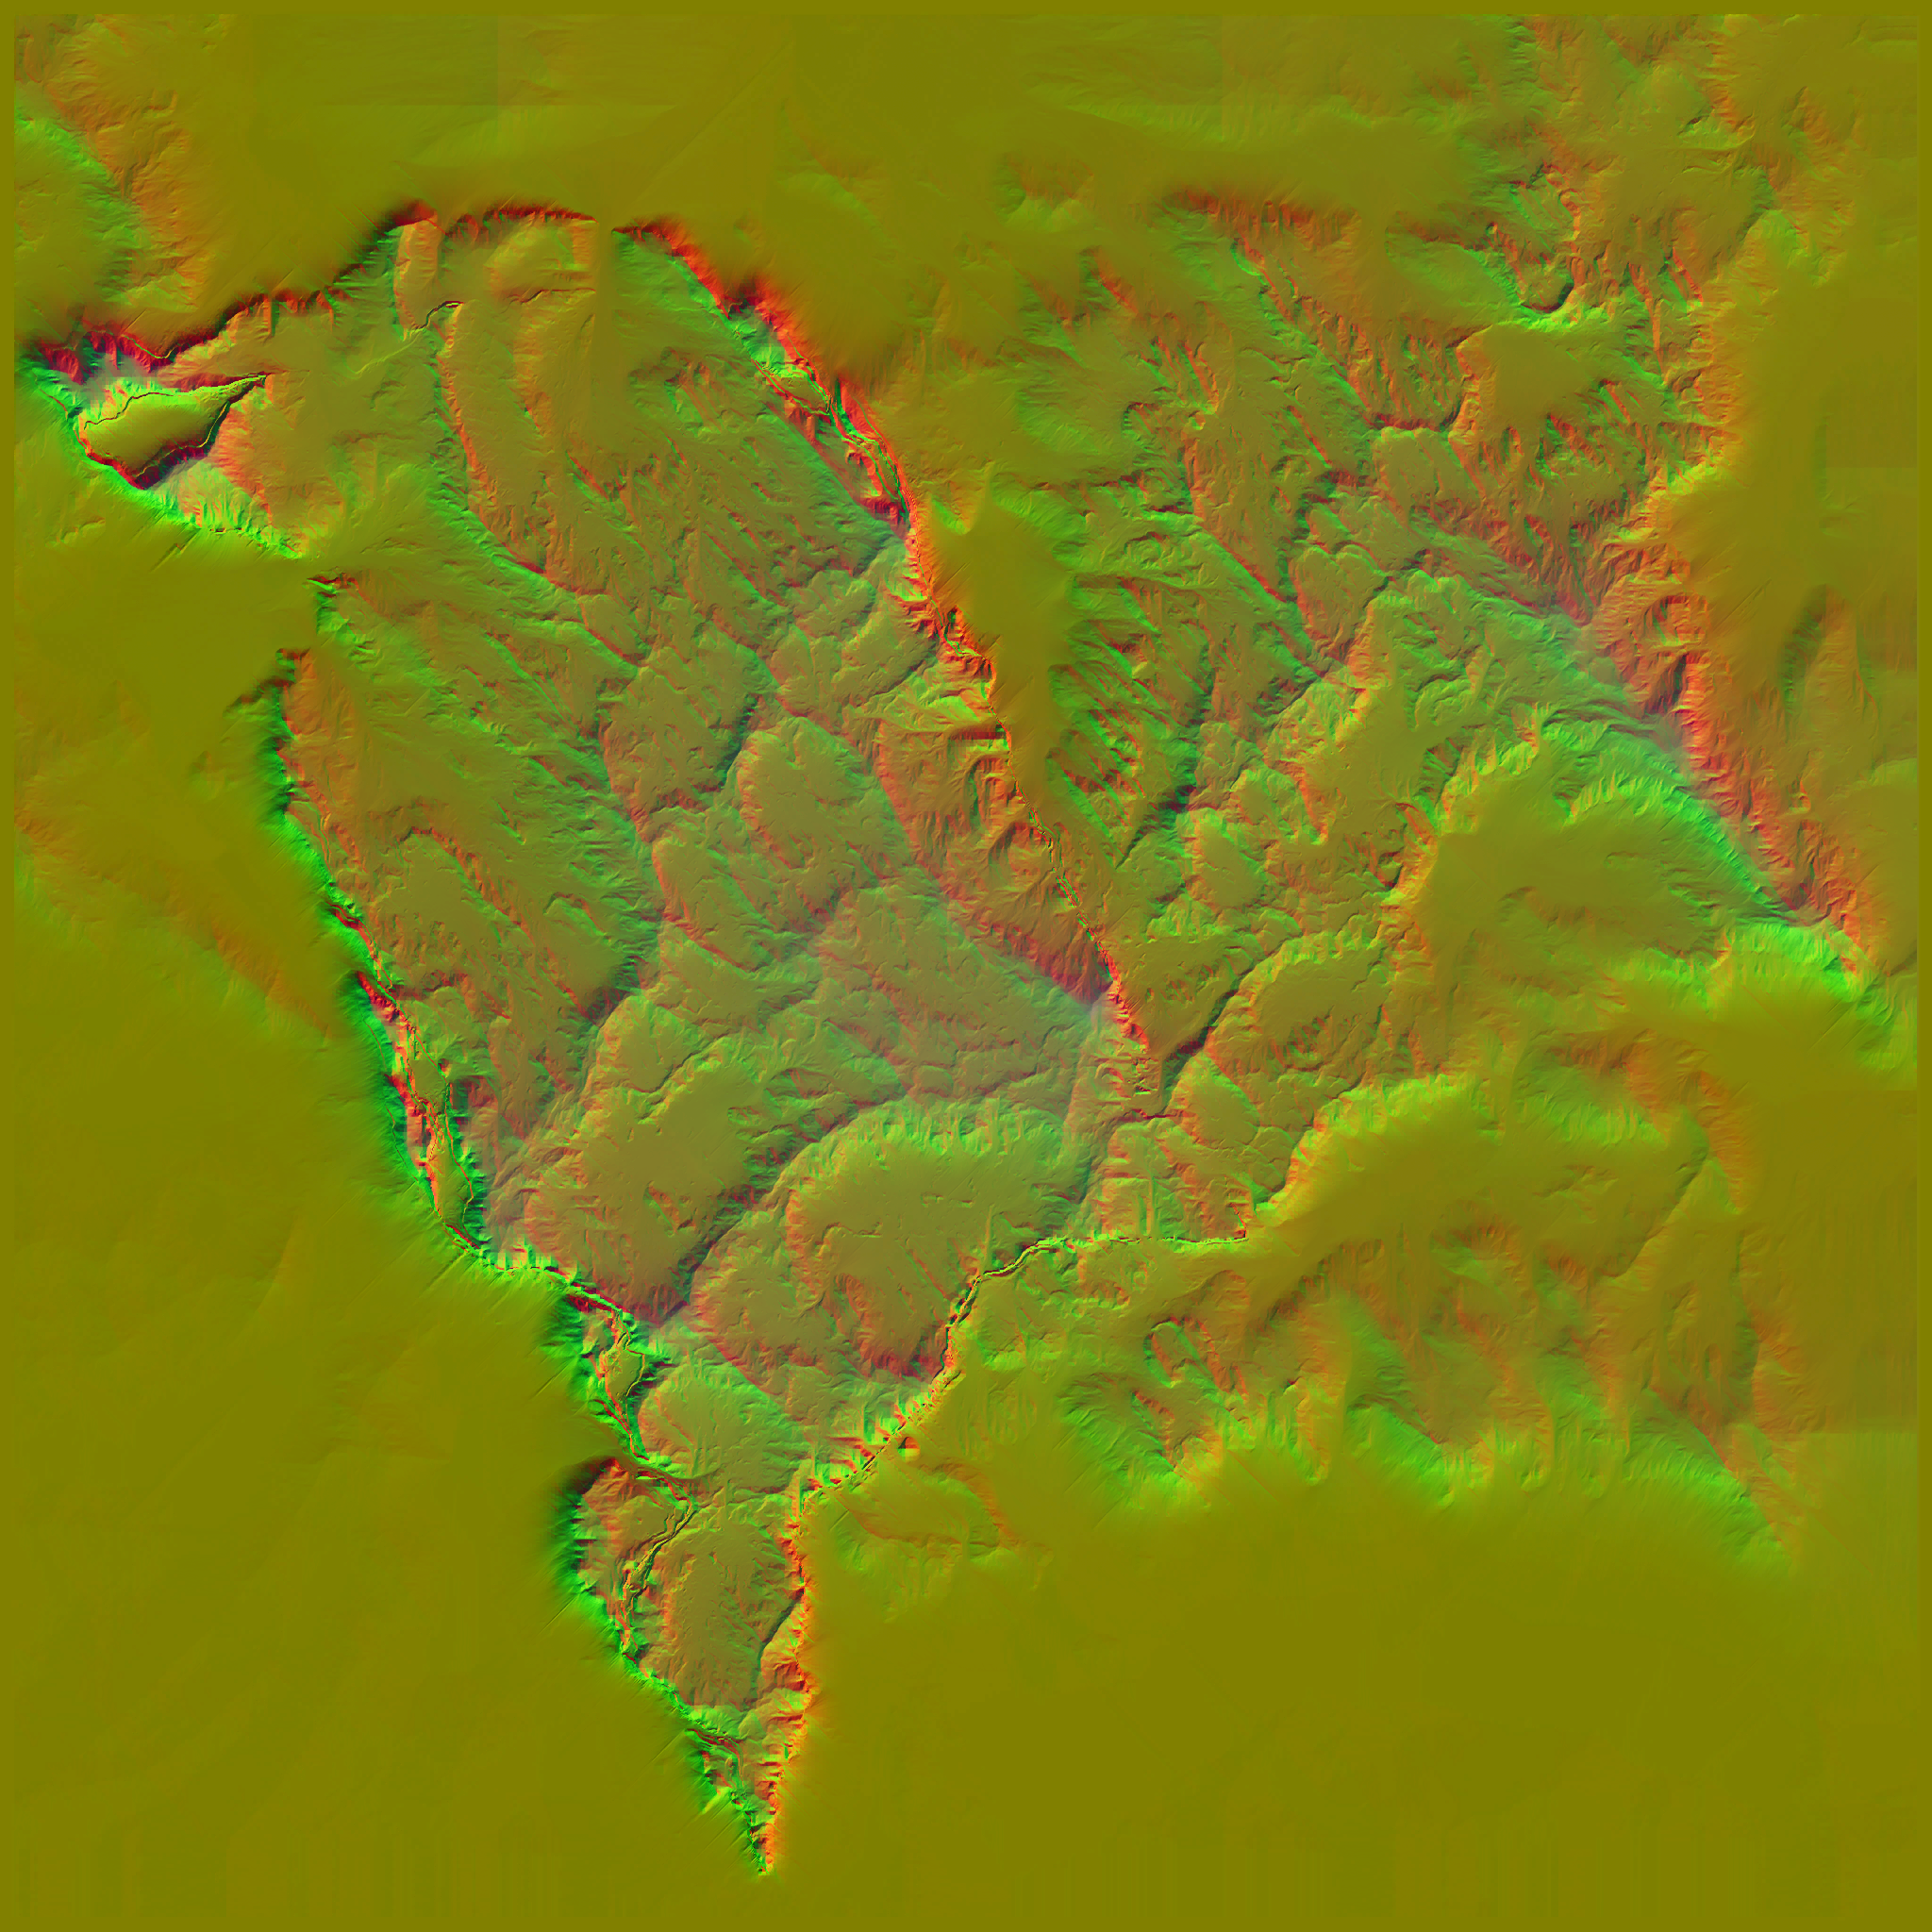
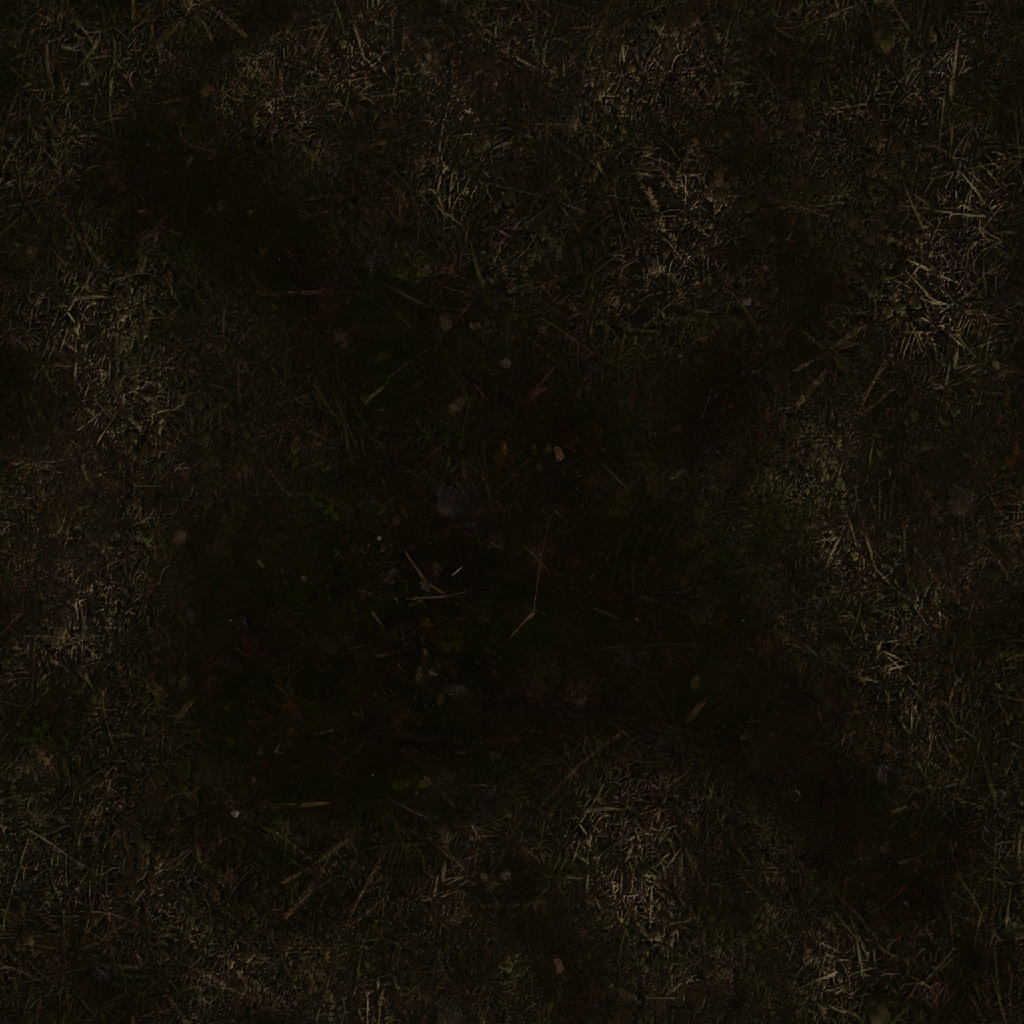
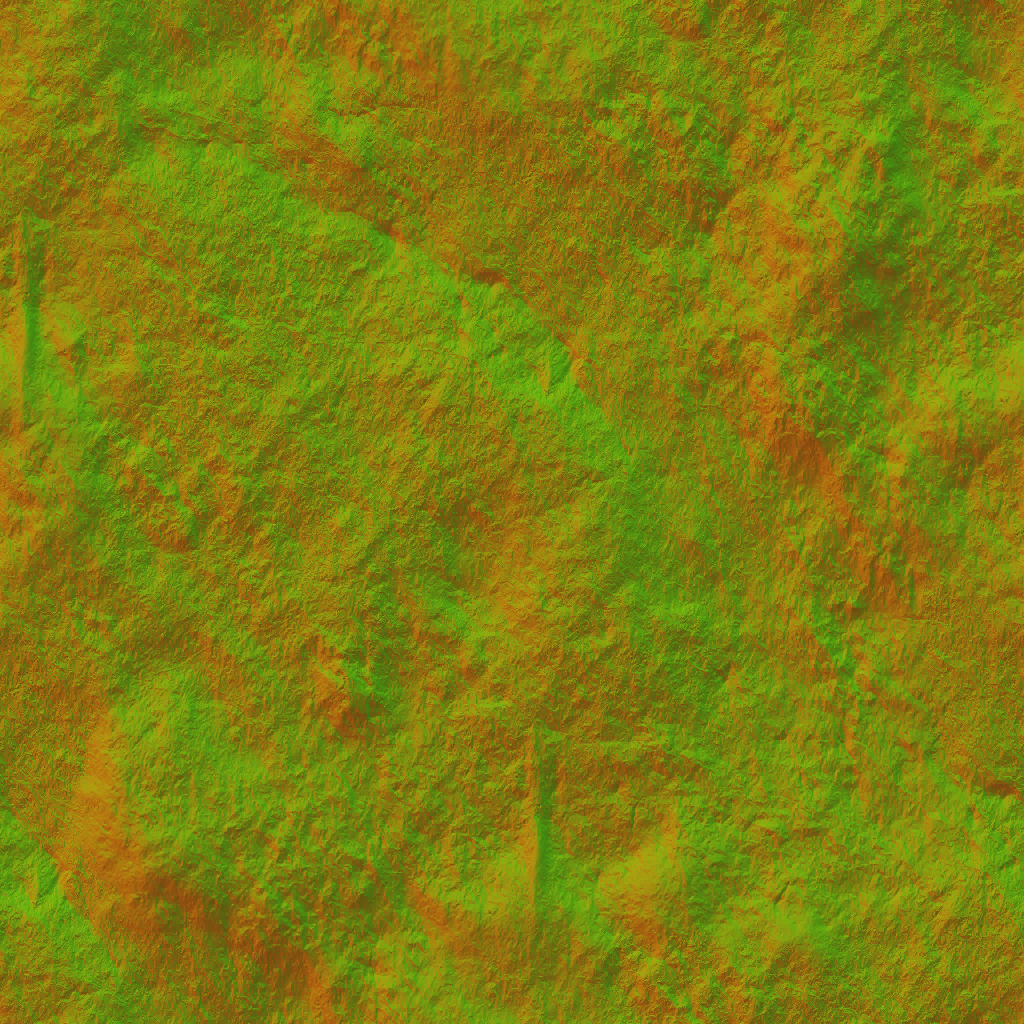
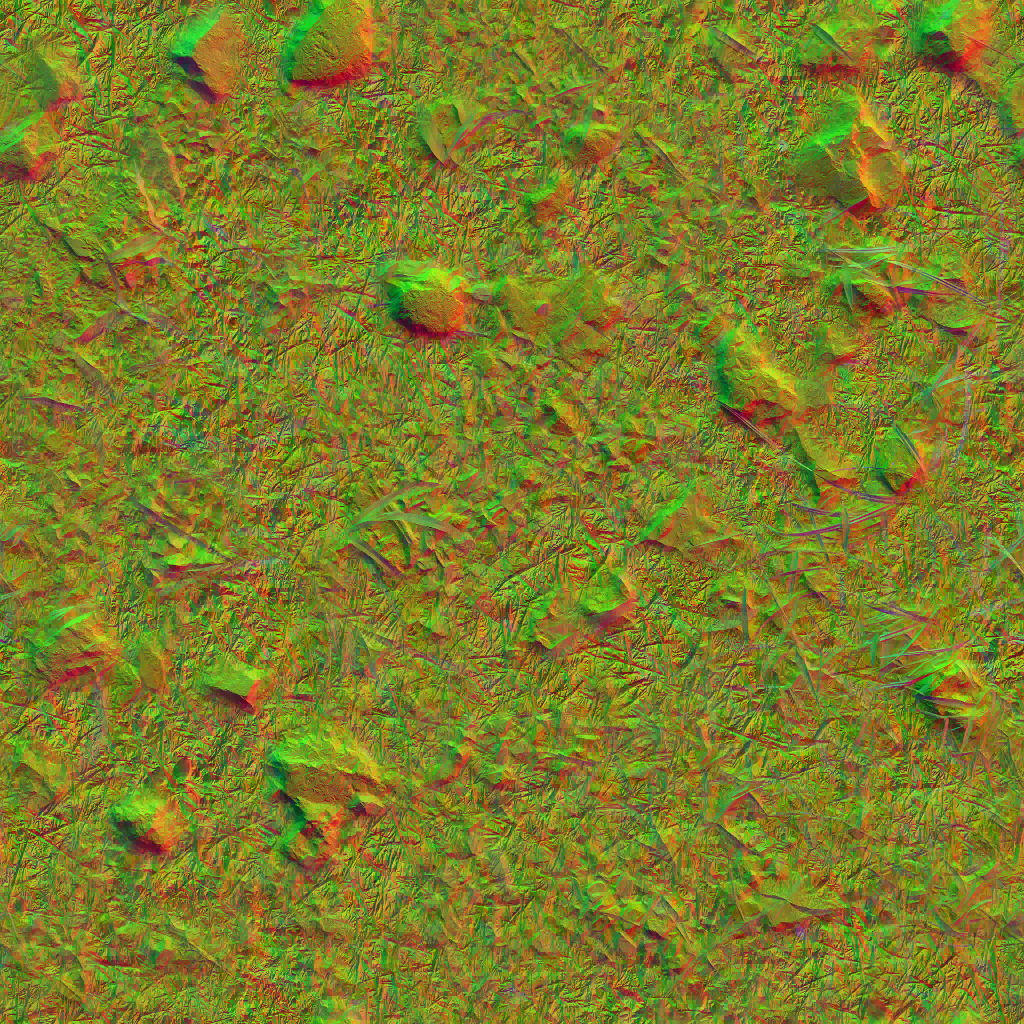
Ambient Animations
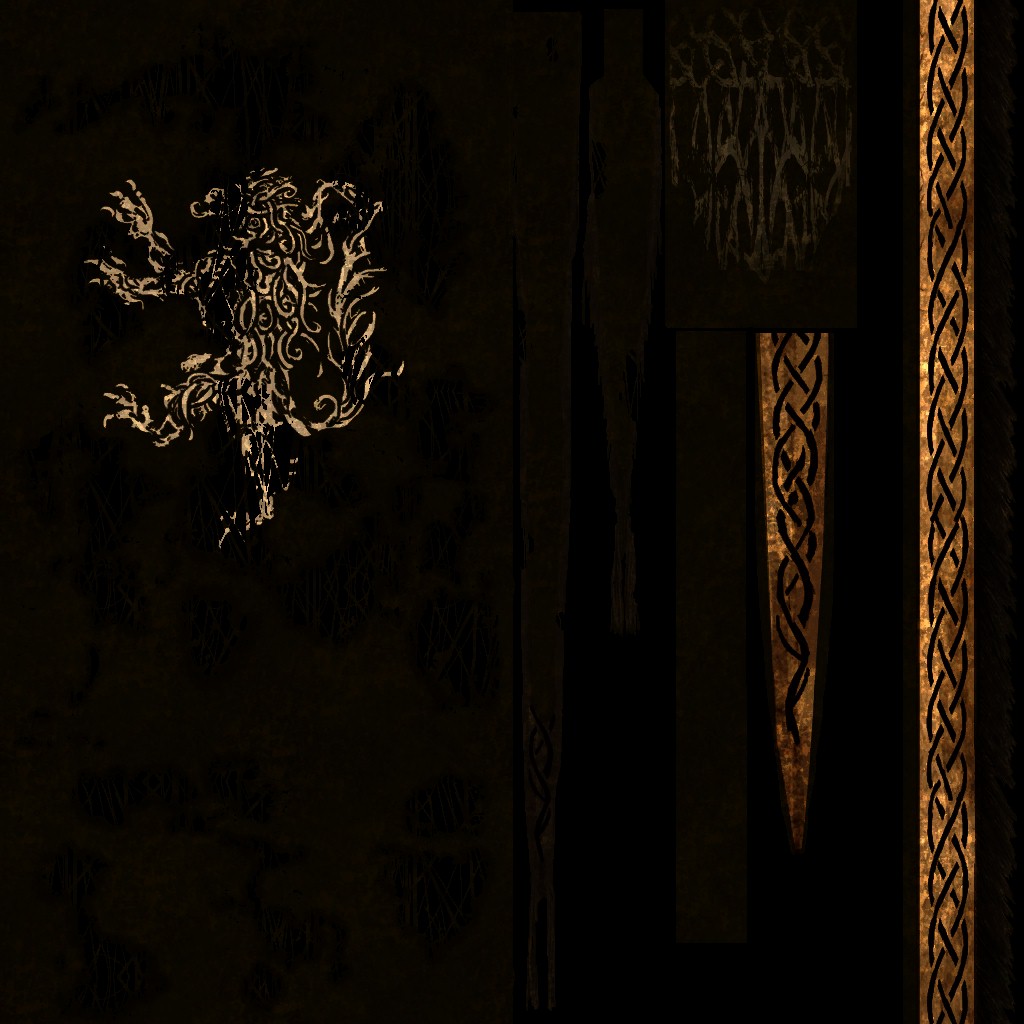
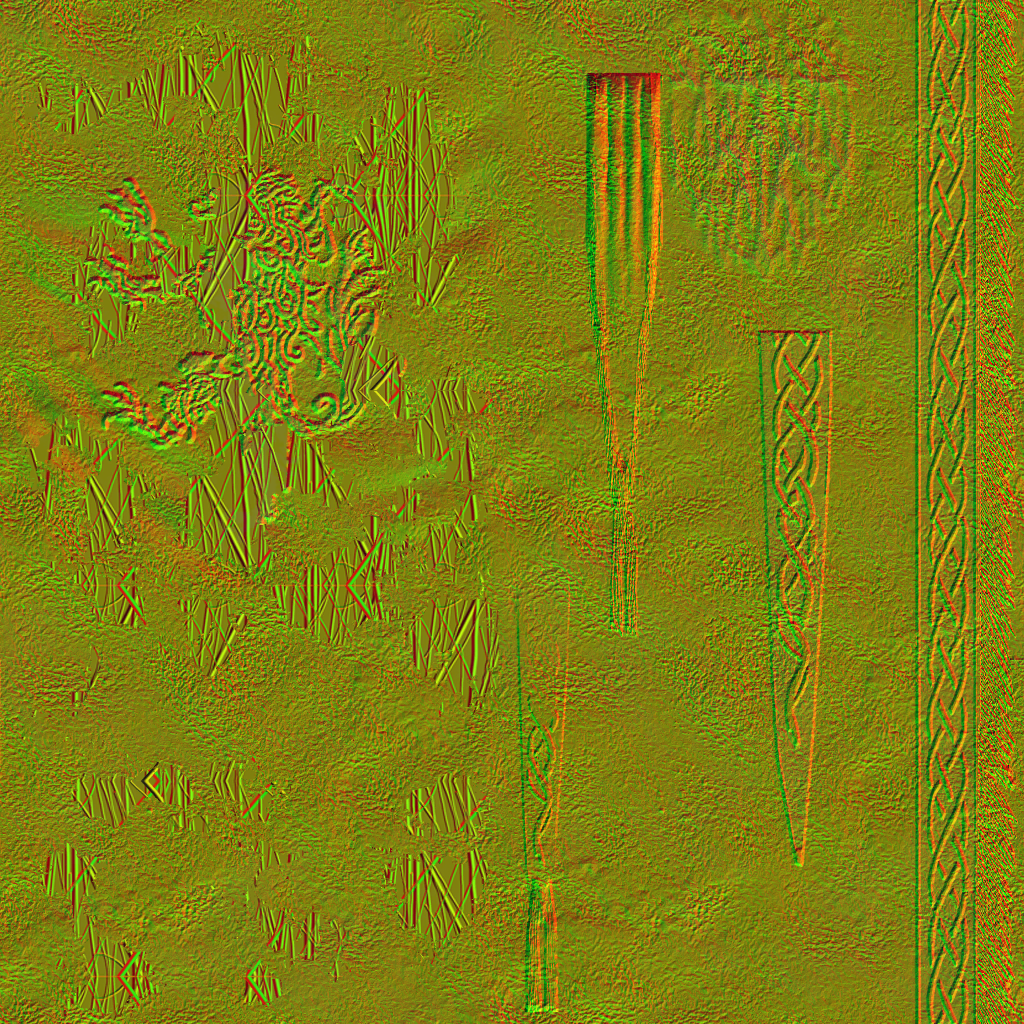
Ambient animations around the Elden Ring’s world is quite pretty. A lot of variations of slightly moving “things” in the world gives it a top layer of realism. Those animations can be noticed in things such as bird or small creatures or cloth, flags & banners. Regardless what it is, all ambient animations in the game is using VertexToTexture approach, where all the animation frames (limited) is baked into Postions & Normals data in textures, and hence the animation is played through the Vertex Shader by reading back these textures. For example below are 2 layers of cloth that makes one flag in the game


For such a mesh, and small textures like these, you get a nice looping epic animated real flag in the world!
Apart from the animation trick, the flag uses a group of textures to define it’s surface in the GBuffer like any other geometry around the world.
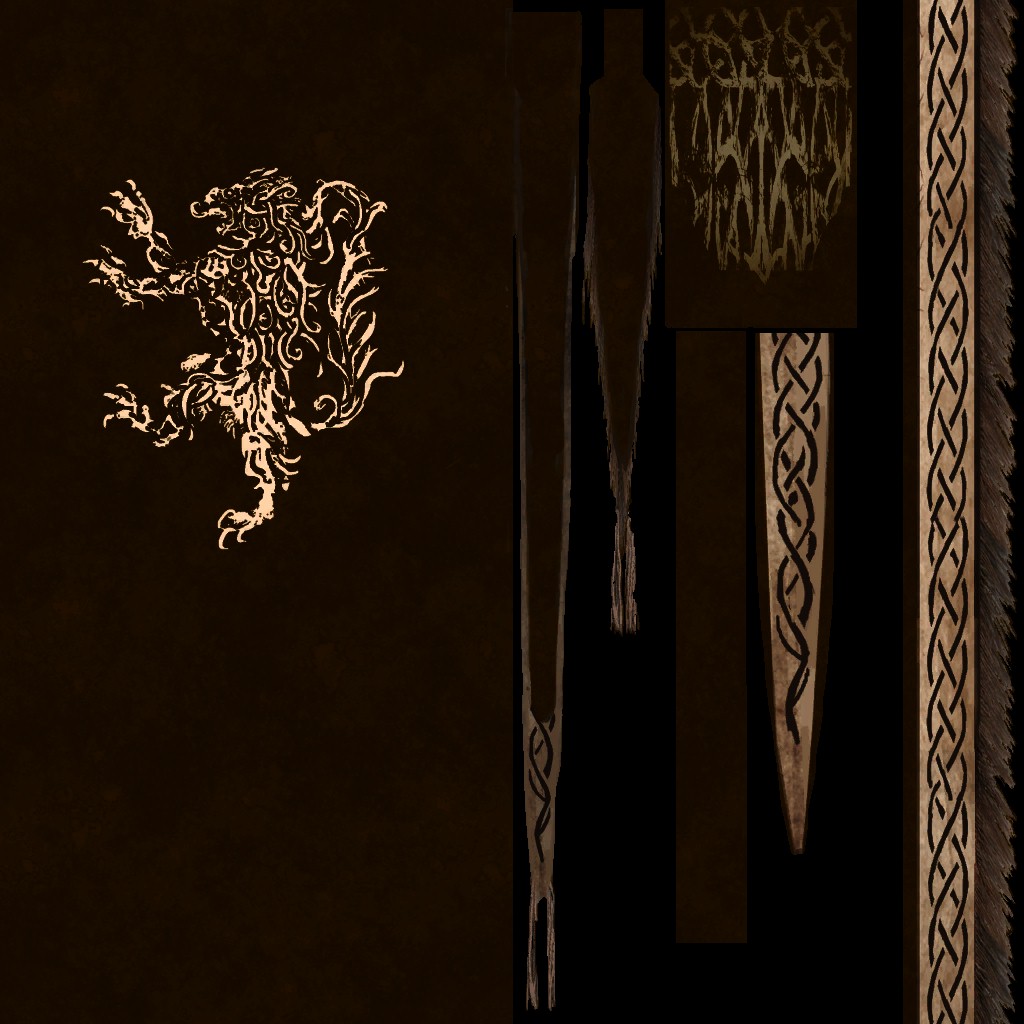


And of course texture set variations to make a torn apart version or different visual look of the same flag when needed.

Render Targets
As a general observation, this game has many render targets that are there for the sake of being there. Some of those render targets are totally black all the time, you can think about it as you have 5 boxes that you need to move from room A to room B, now you could carry over the 5 boxes (one by one or all at once on a cart, it doesn’t matter) and move them from room A to the room B. Or you get 2 new boxes (total now is 7 boxes) and put the content of 2 of the 5 boxes that we need to move in the 2 new boxes, leaving 2 of the original 5 boxes empty (black color). And finally move the new 2 boxes (with the content of 2 original boxes) + the other 3 boxes (which have content) + 2 original empty boxes (we use them later) to the room B! It’s useless to have this type of boxes if you can move the 5 boxes with their content already! Those boxes were render targets that are created and moved between passed only to hold values of another render targets that could be possibly moved as it is.
The next type of render targets that i disliked, i where the game store single channel in an entire RGBA render target where it leave another render target using 2 or 3 channels only…Packing could have been better.
The last type of render targets is basically things such as the UIScene, where some people would argue that it’s good to have a dedicated RT for the UI content only, I’m belonging to the other school which tries to reduce and pack as much as possible…Performance is not gained easily for games!
Audio Thread
Audio in that game is running in it’s own thread, and this is normal & common nowadays, but it seems that the audio thread is not playing well in a harmony with the rest of the game or other threads (game thread, rendering thread,…etc.) as most of the time when i was taking captures there are freeze in the game while the frame content get copied over from the GPU to the HDD (and this is totally common), but since most of the other games (regardless PC or Console) would totally freeze everything during the GPU capture, and you won’t hear game audio running, at Elden Ring, the game audio keeps running totally smoothly, not only that, but if that audio is like “audio line being said” or “audio attached to a cinematic” you would keep listening to the music and voice-over while the entire game is frozen for 10 seconds or more, and once the graphics thread unlock and the game keep running again, you would see the rest of the gameplay animation sequence, or the rest of the cinematic without any audio, because the audio cue was fully played ahead of time during the copy process of the frame data. This only happens of course if the audio cue was fired before capturing/freezing the rendering thread.
It is totally cool to have fully dedicated audio thread & it’s the standard nowadays, but it need to be in some sync or coherence with the rest of the game.. Yes it will run independently, but it needs to have “more” dependency of the game+graphics threads. This adds more complications to the architecture, more production cost & production time, and possibly more bugs and even more race conditions (it depends on the approach), but it will make more sense at many scenarios. After all I do believe that “Multithreading is not actually Multithreading if it was 100% Multithreading”.
Assets
While the engine seemed very capable in delivering (we only scratched the graphics part, but that engine have other great aspects such as networking), but i did notice a common pattern, that the game assets (graphical assets such as models & textures is where my observation goes), are not well taken care of. For example you can see most of the time UI atlases that is full of solid black colors, or even textures that is not used at all.
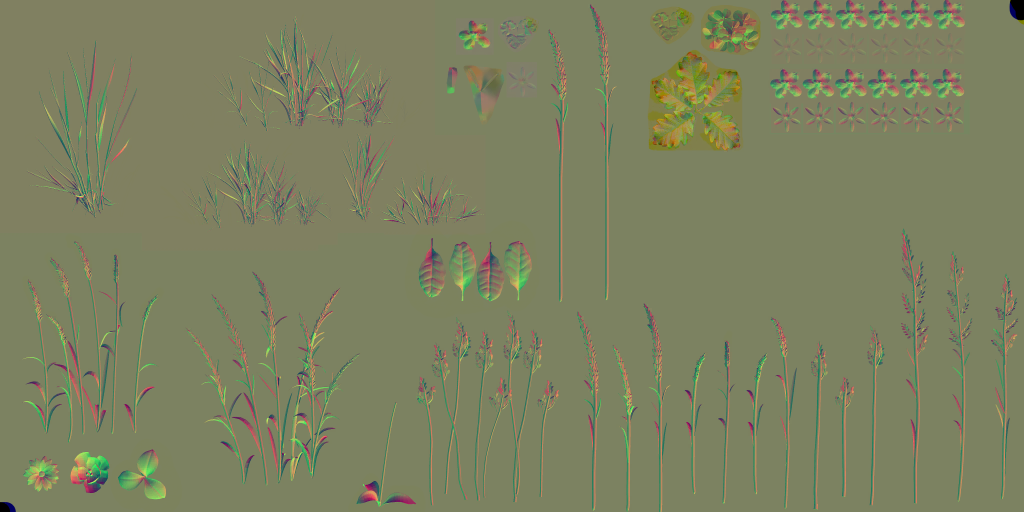
At the other hand when look at 3d data, you would notice inconsistency between types, for example, you could find some grass that was built in full details (strands like of thing) where other grass was built in a form of cards (quads with alpha cutout). And the difference in mesh types has nothing to do with the distance from the camera..it seemed very random and inconsistent. Not only that, but i had a gut feeling that Elden Ring never used LODs (i could be 50% mistaken) as most of the time:
1. i never see any LOD transitions. Regardless how amazing the engine for whatever game, you can always spot LOD transitions, dithering or not, you can spot them.
2. when look at wireframes, i can spot a tiny pieces of rocks or wood or whatnot that is super far away from the player view, and the mesh verts count is still the same as if you get close to those assets.
Clarification
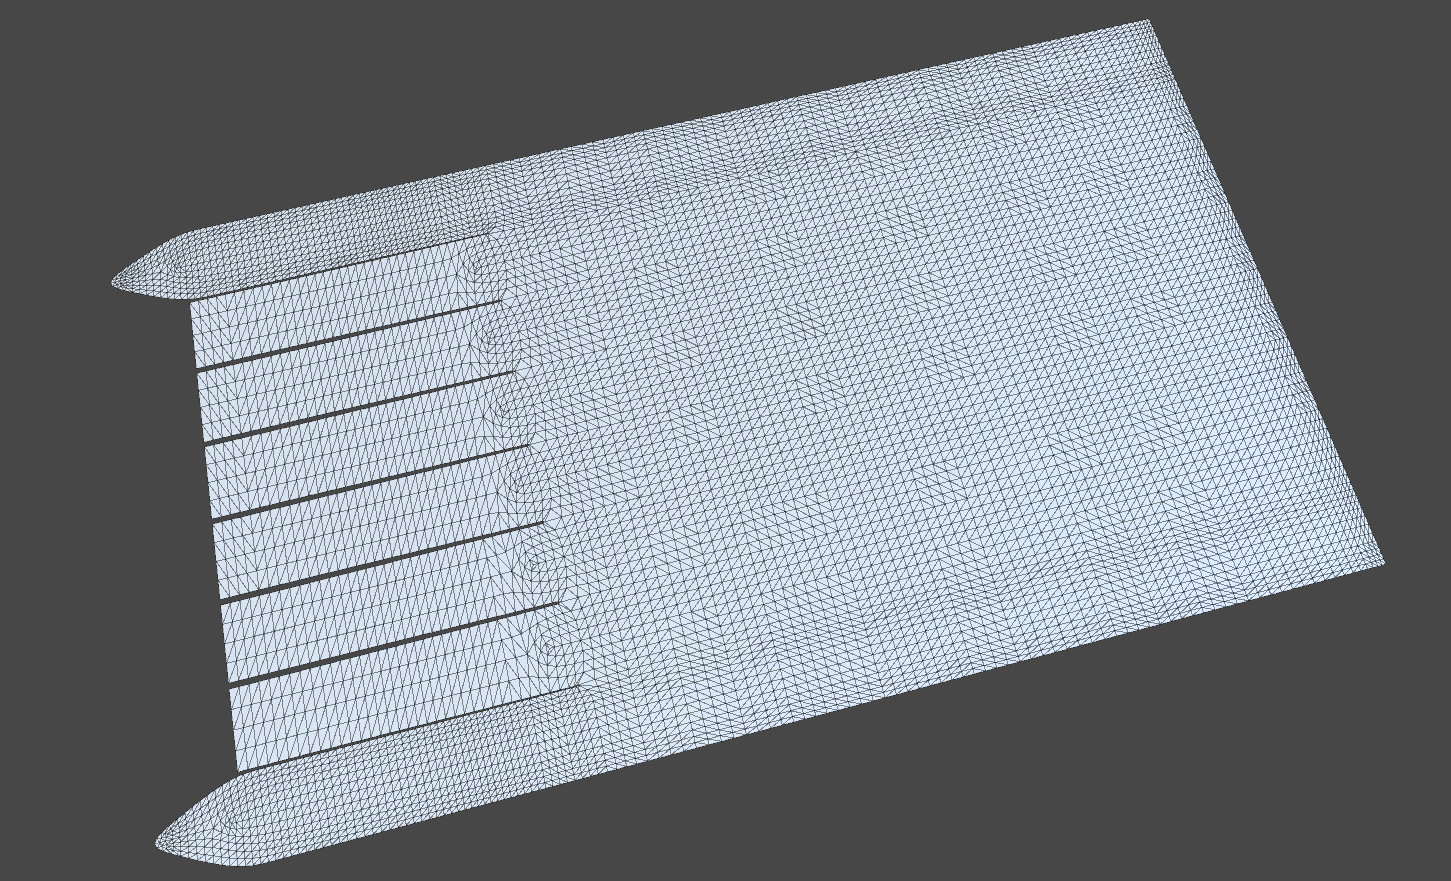
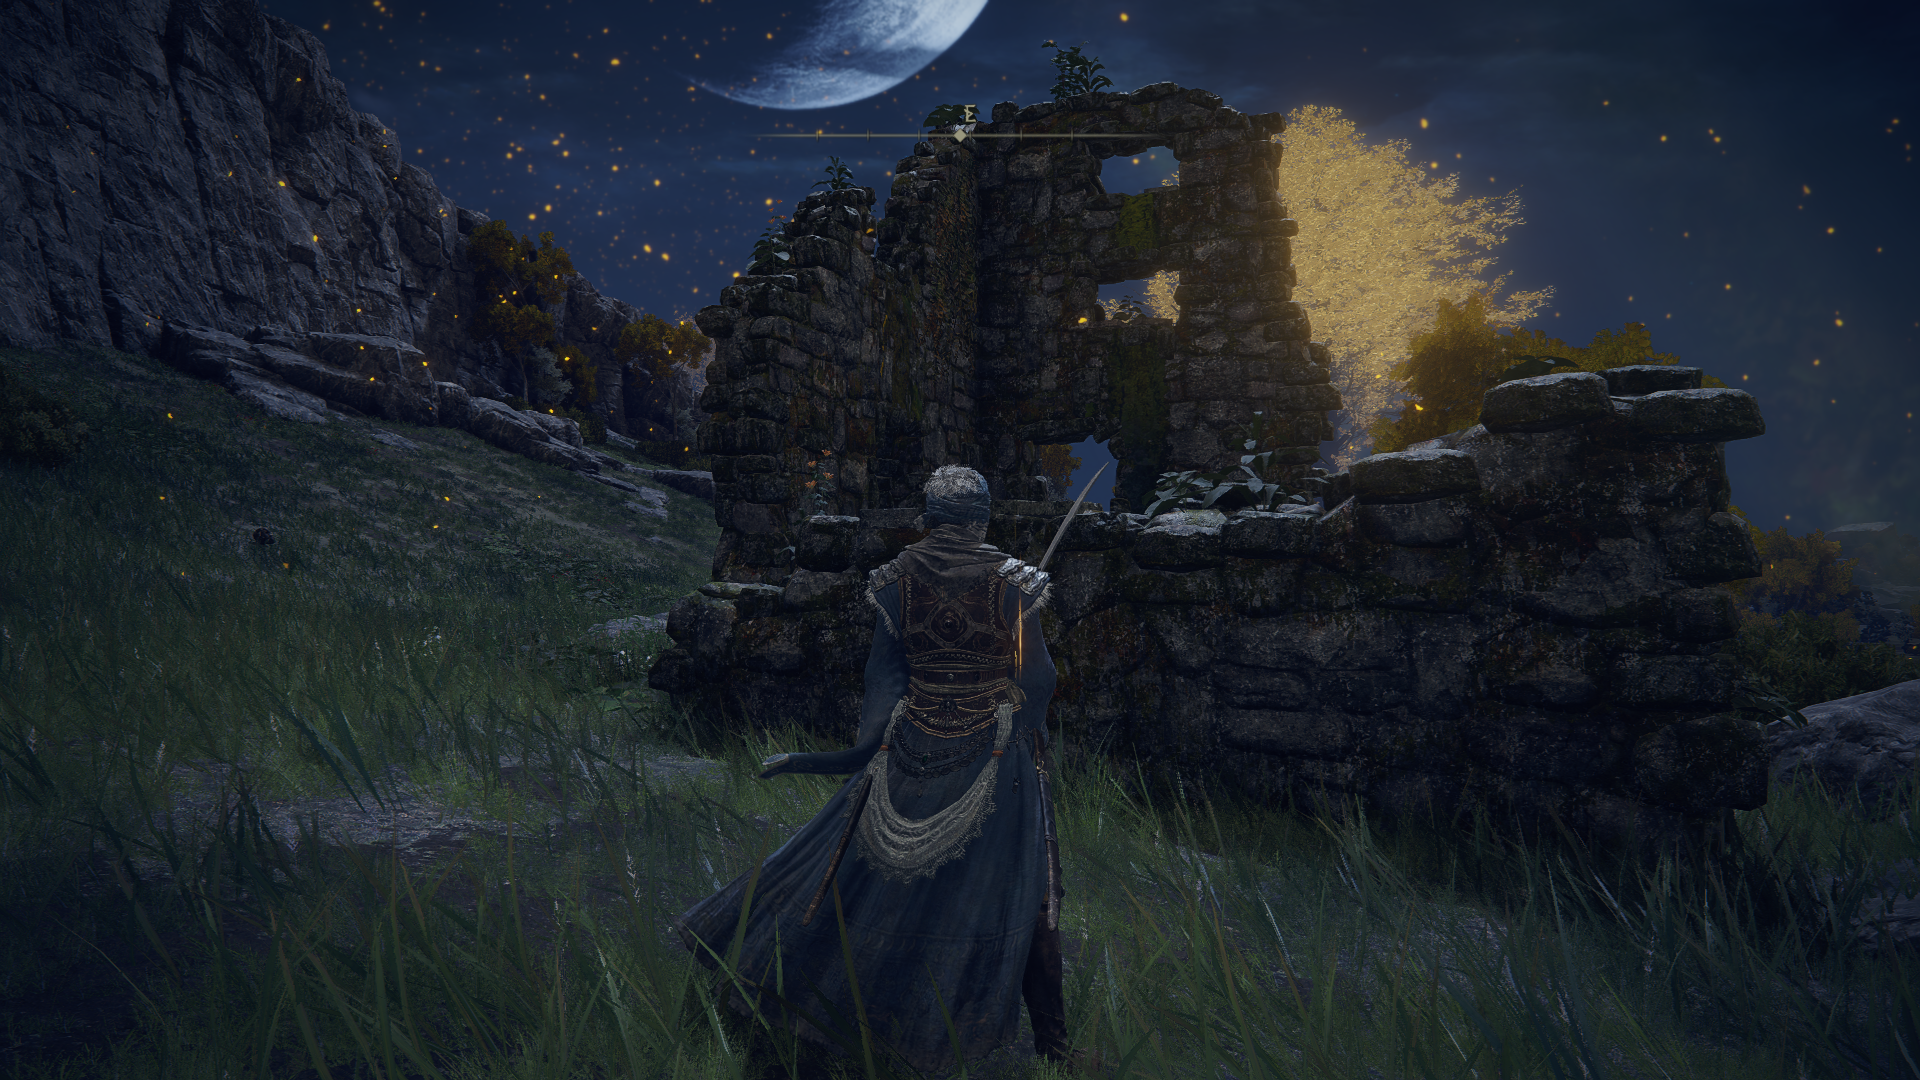
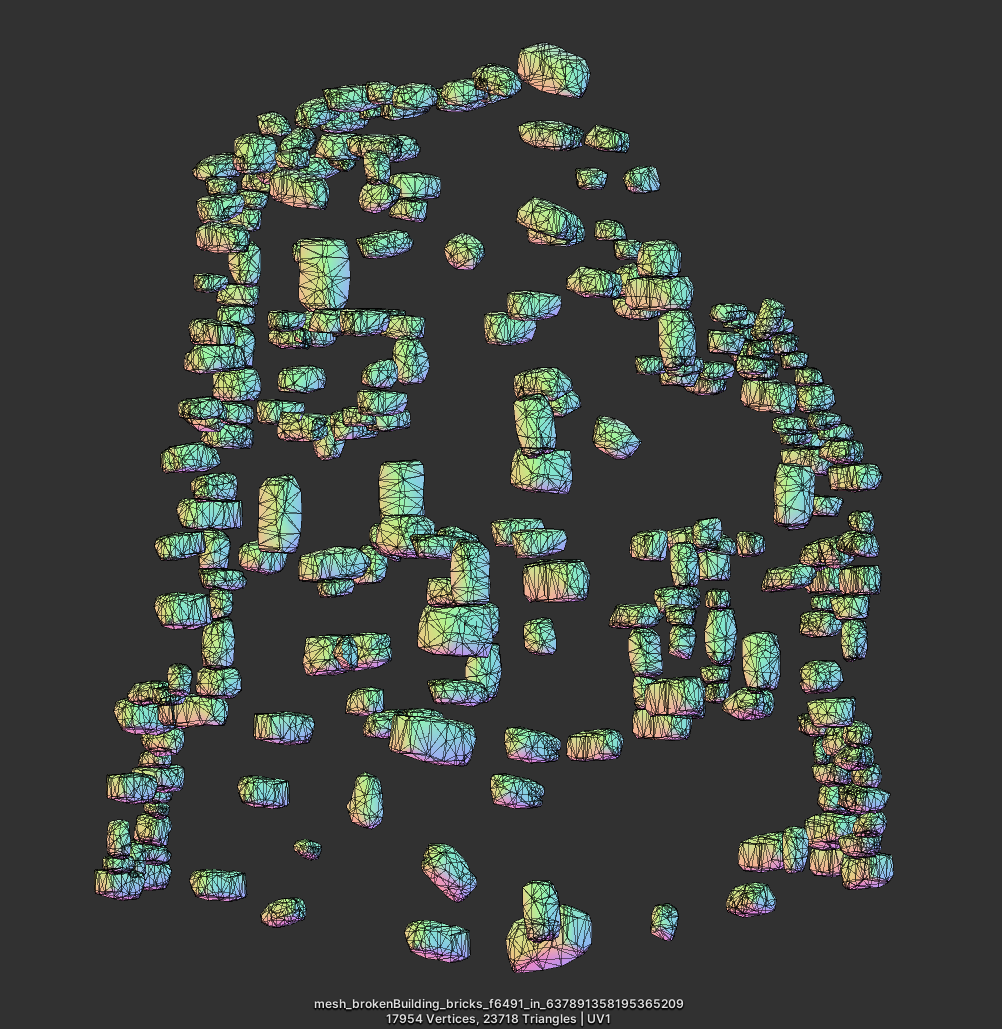
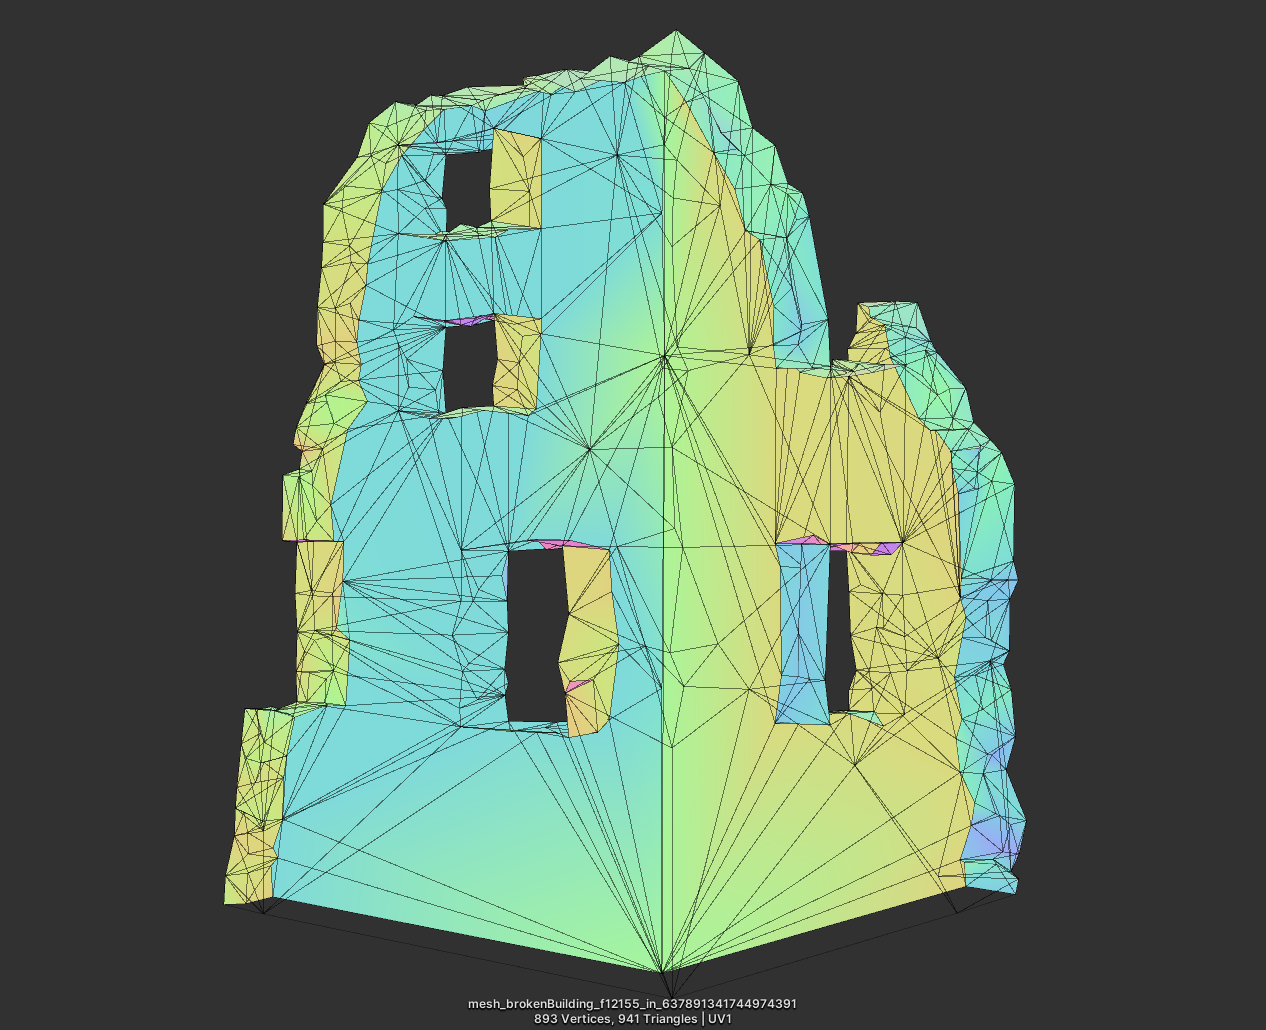
The “never used LODs” is a sarcastic exaggeration to what i meant (it’s my way when i talk irl). The game have some form of LODs, but not what you can expect in a AAA, and not what would expect from an open world nowadays. For example, given this broken building ruins structure, this is how the mesh would look like..
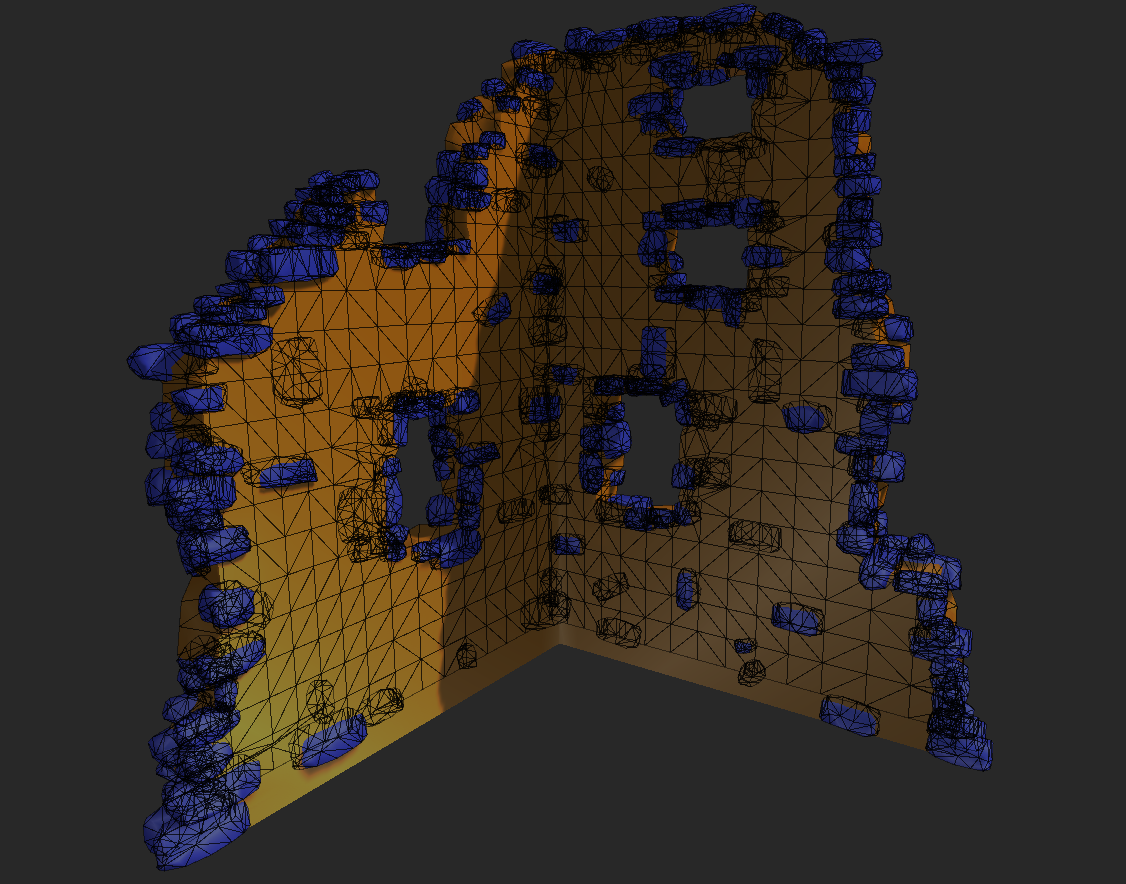
Not only a single mesh, but the structure is built in layers of meshes, if we ignored the climbing plants and decals, those are the ~3 layers of geometry defining the building.
Even from a little bit over 1/2 a kilometer away, those settle layers and tiny little bricks layer, is drawn!
And if zoomed that previous image, to see the layers in details

So, for that very very close to (almost inside) the building, and that over 1/2 kilometer away, here is the 2 meshes
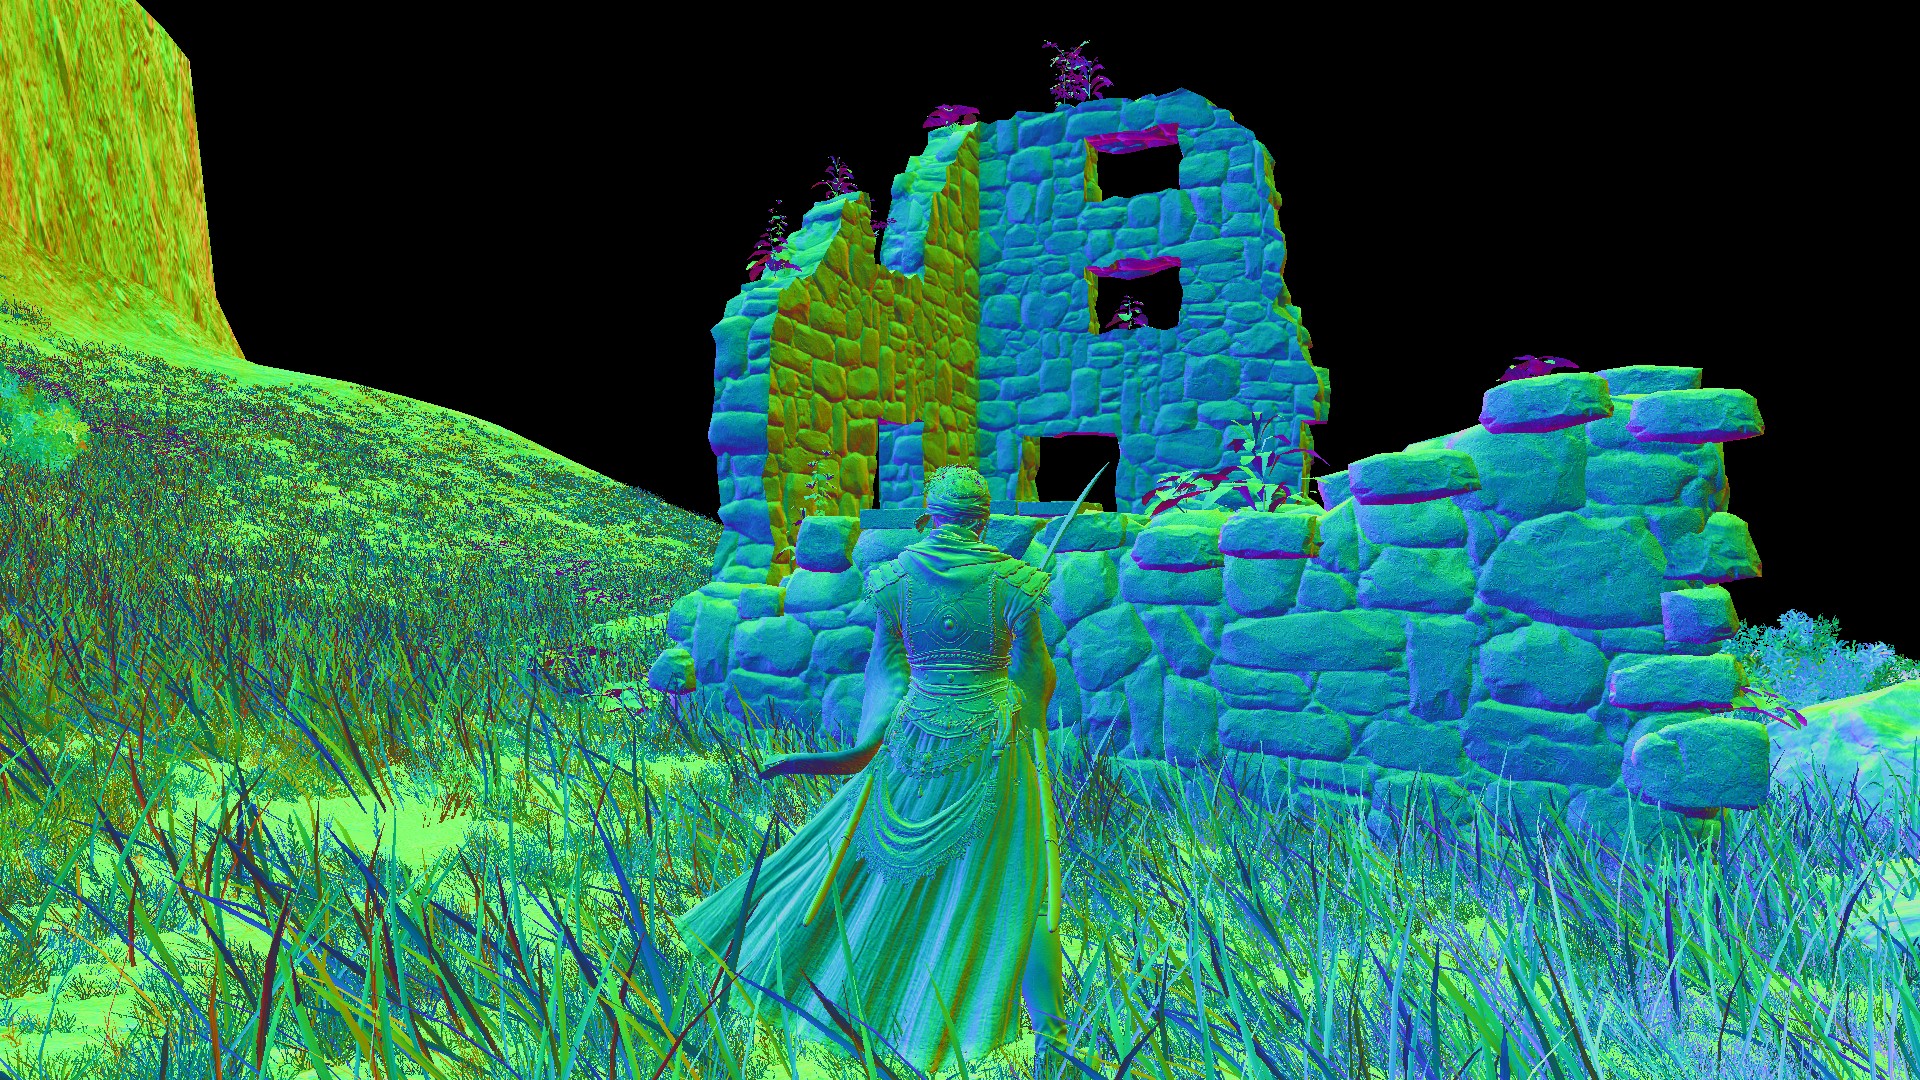

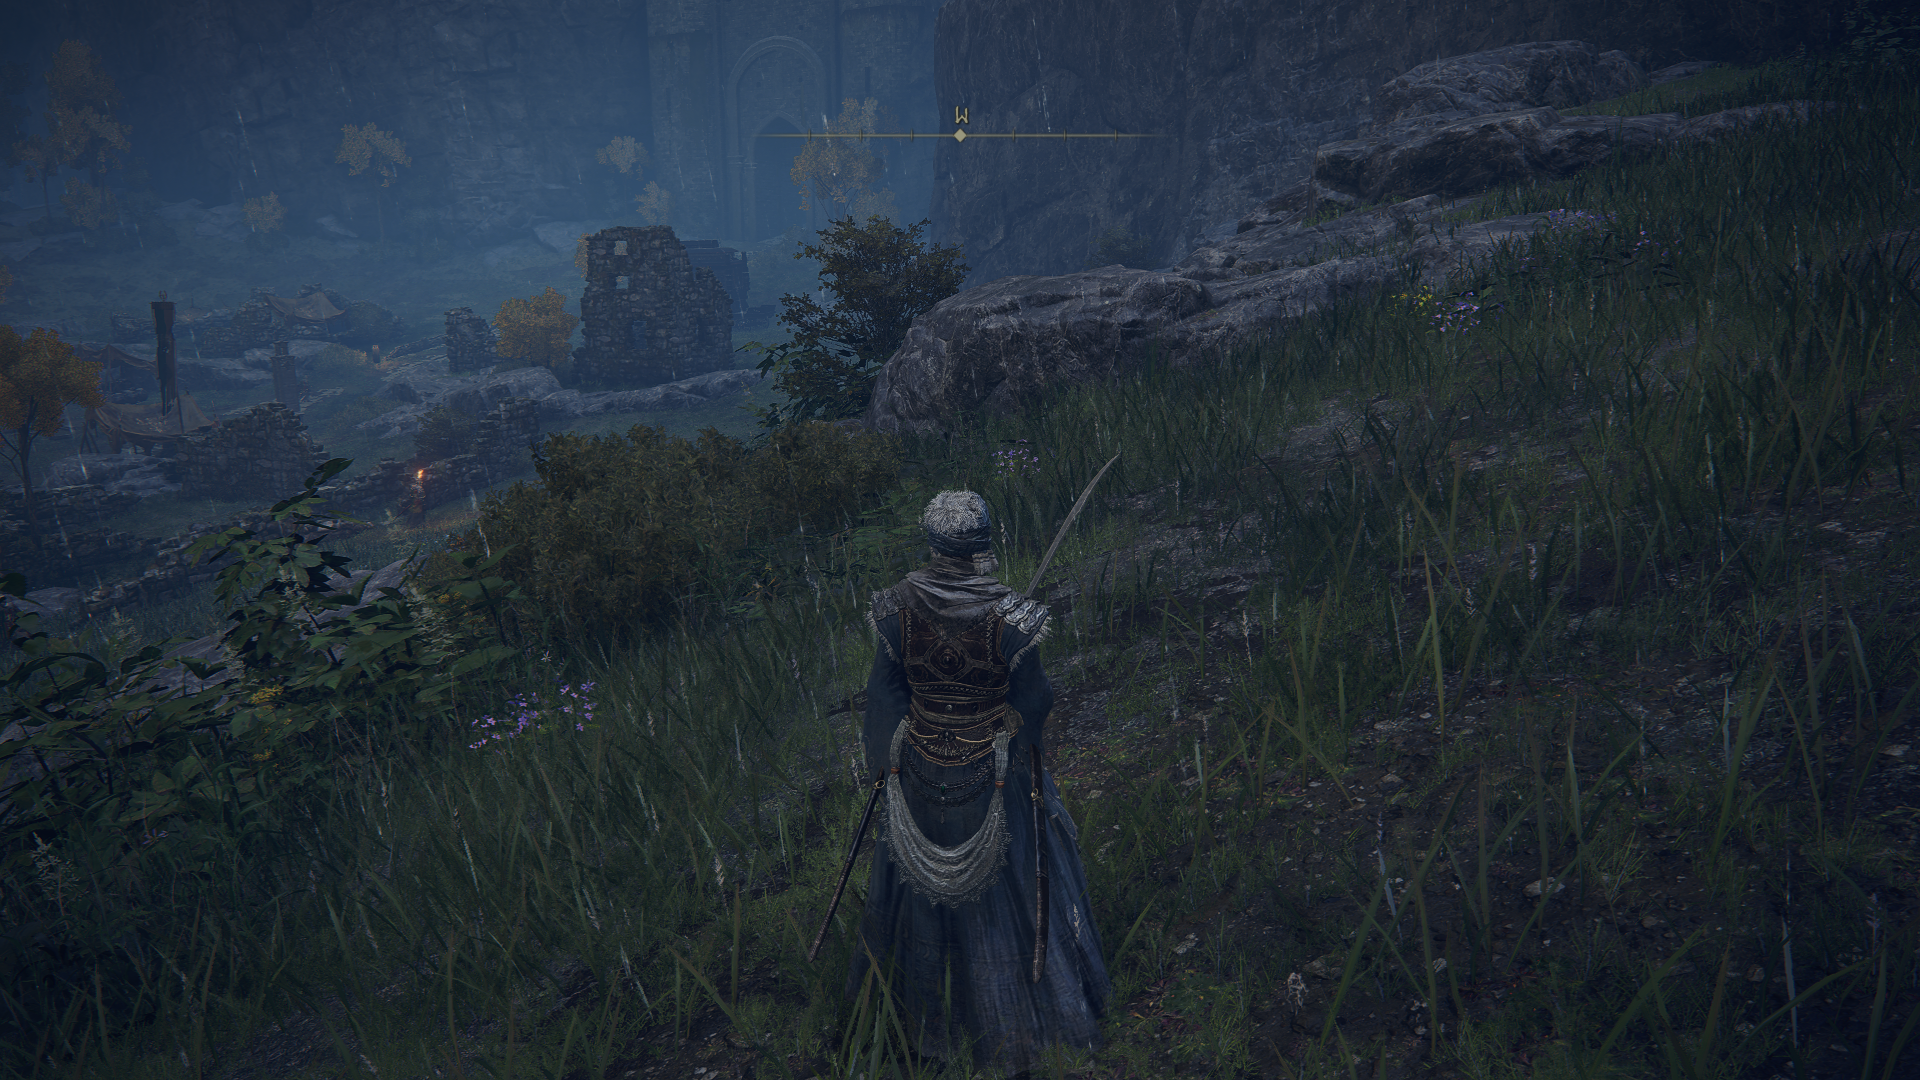
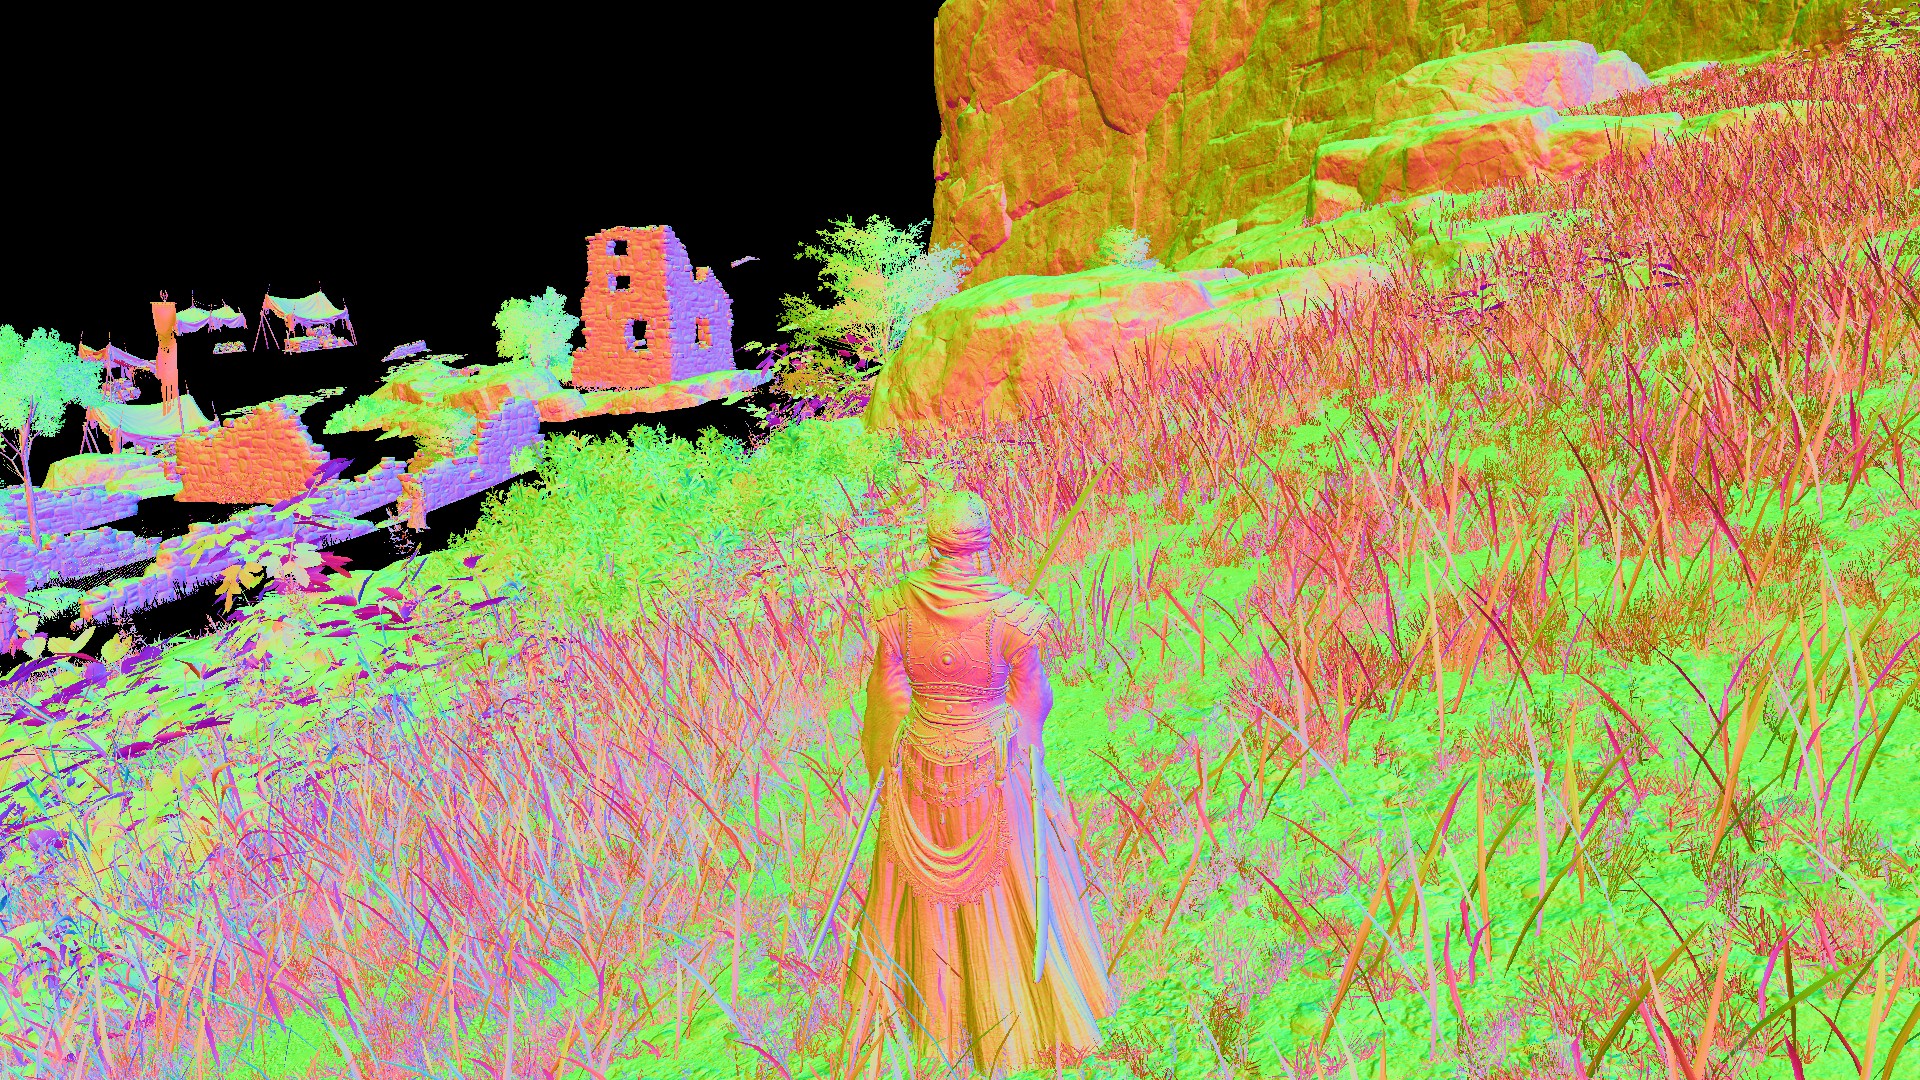
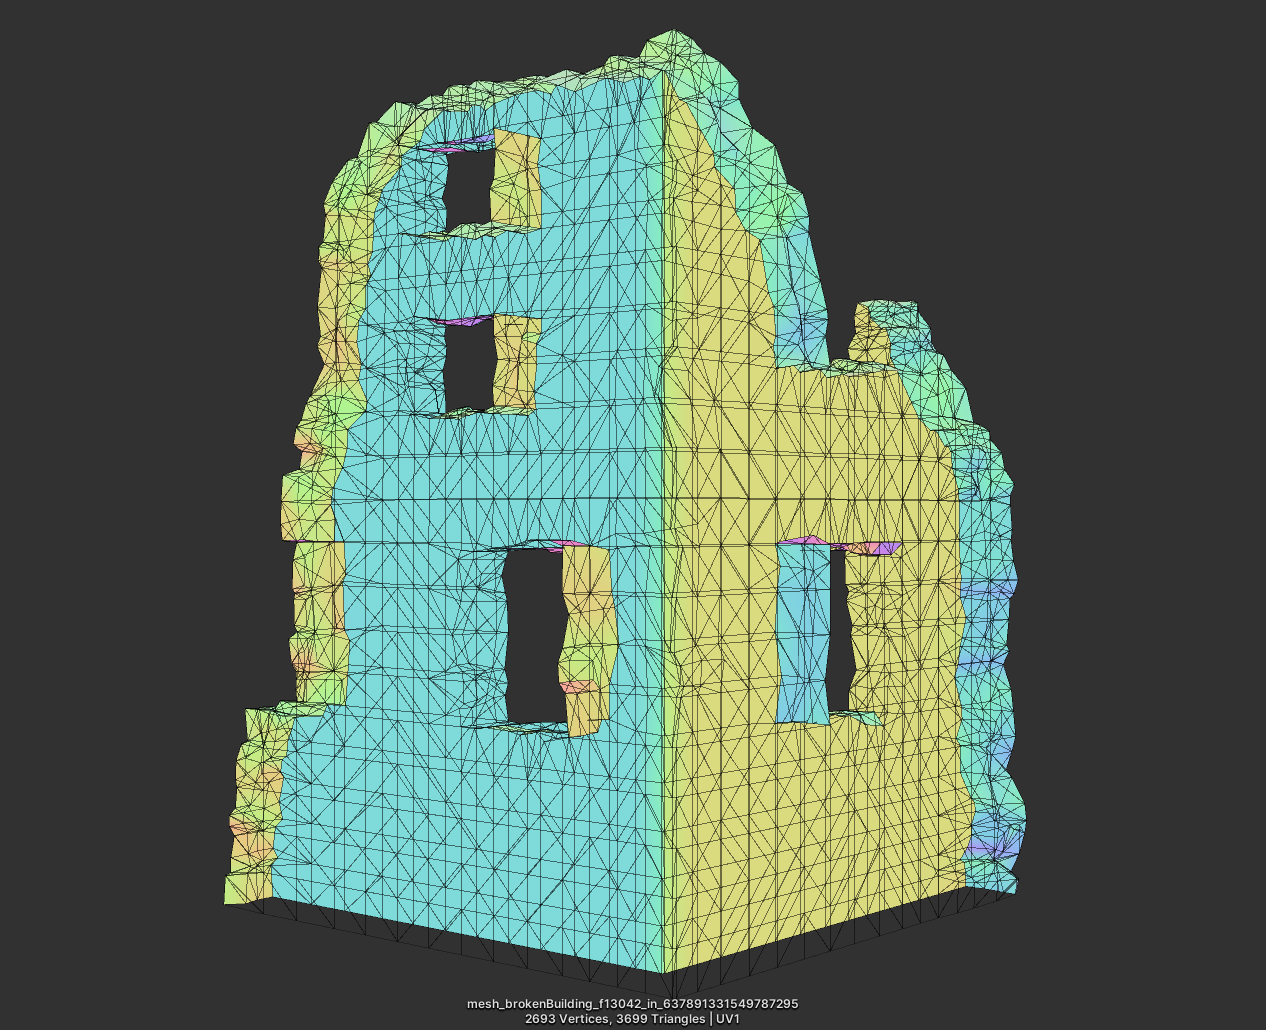
Exact same mesh, with exact verts count rendered at both cases!
By that distance, you should be at LOD2 (3rd level i guess) in a typical open world (Assassin’s Creed Origins for example). I left the mesh signature as well as the “frame index” in the mesh name, so i make sure not to get confused between different captures.
Even the tiny individual bricks, are still rendered at both cases. It’s slightly less poly, but still very very high for such a distance!
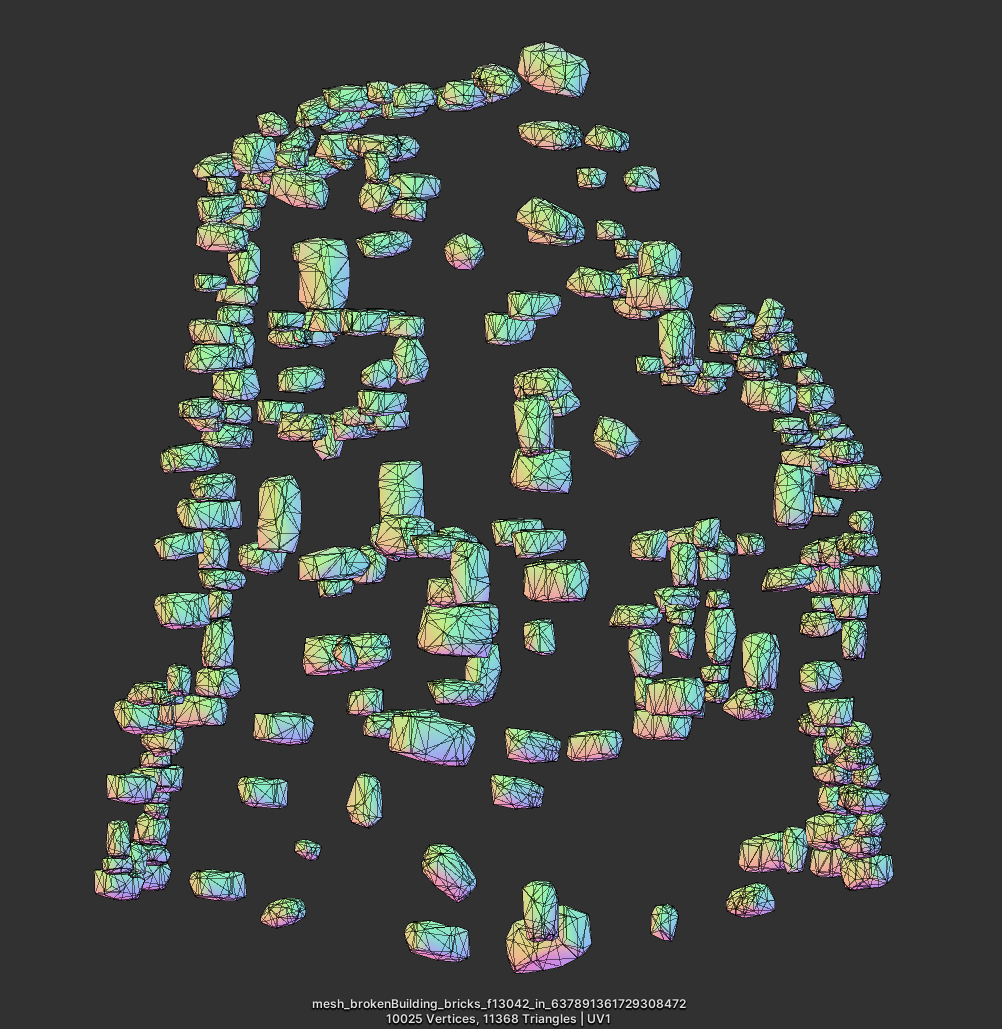
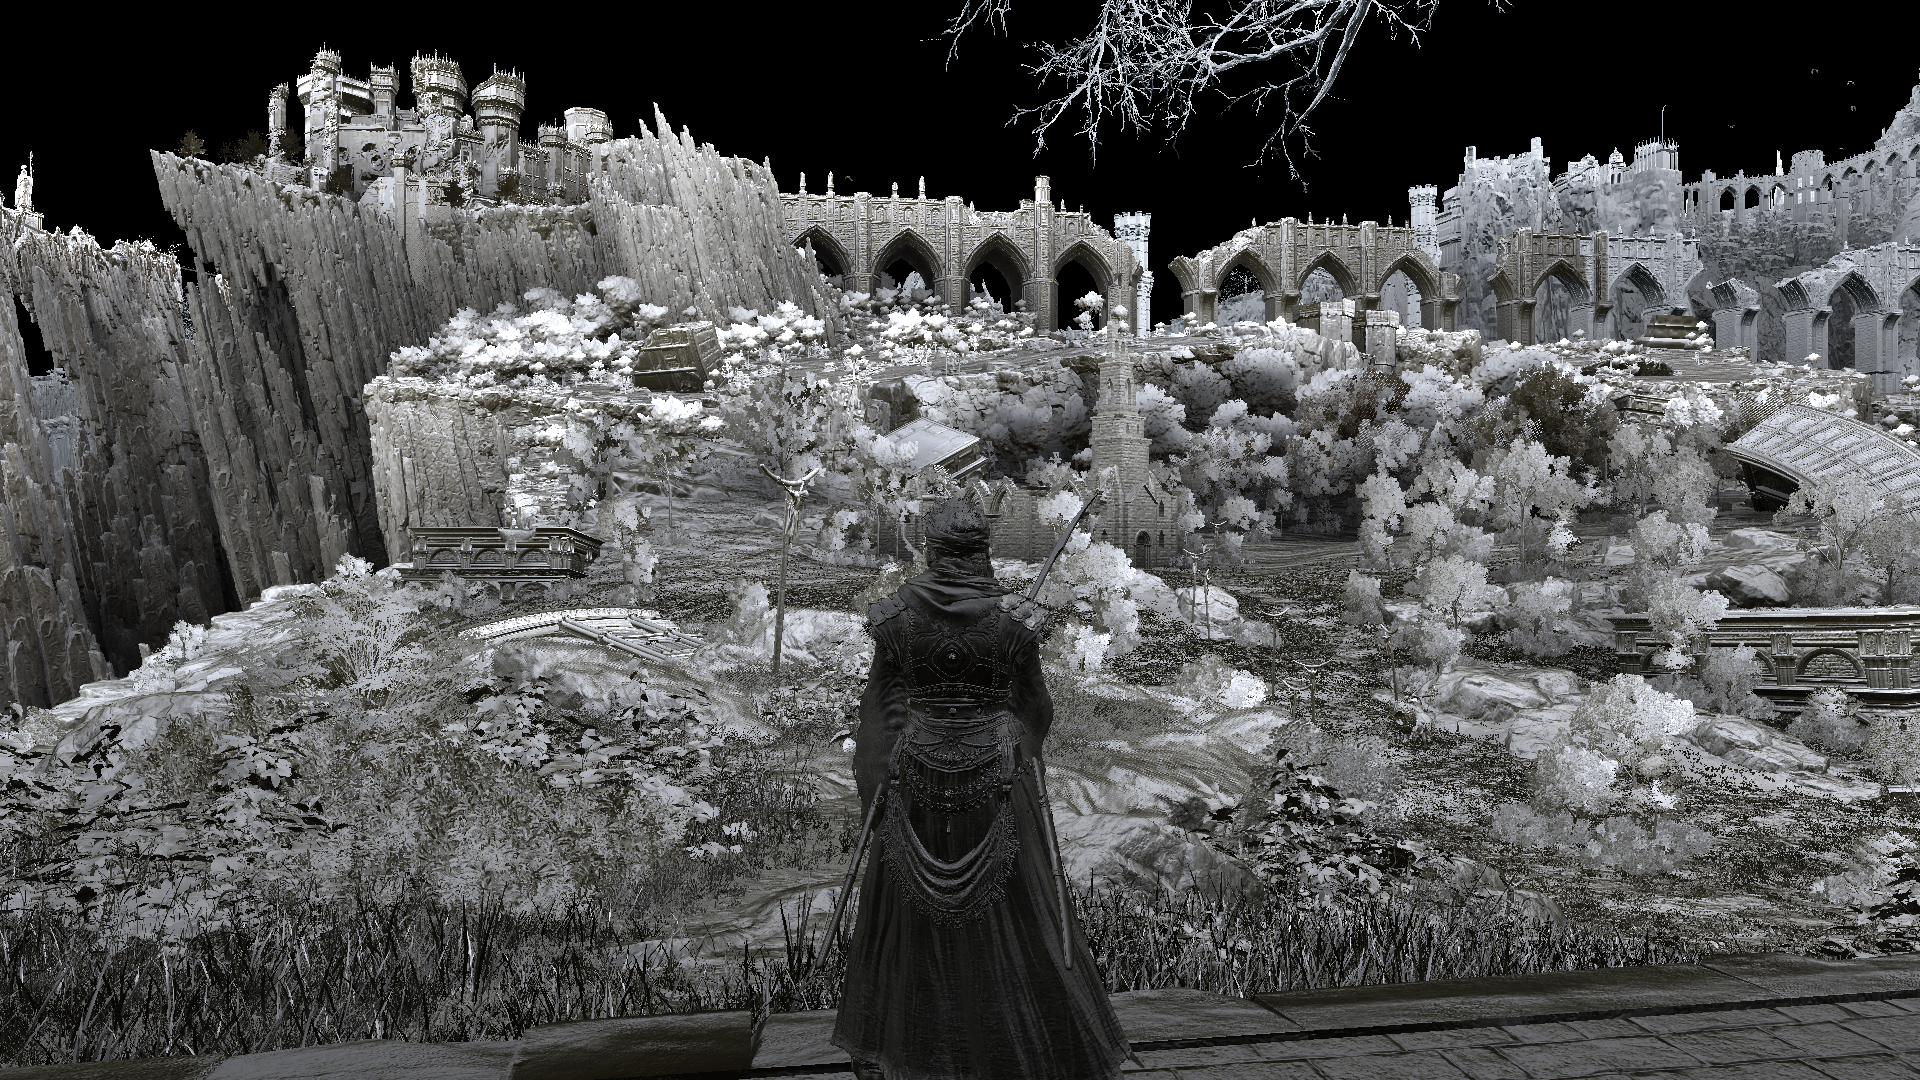
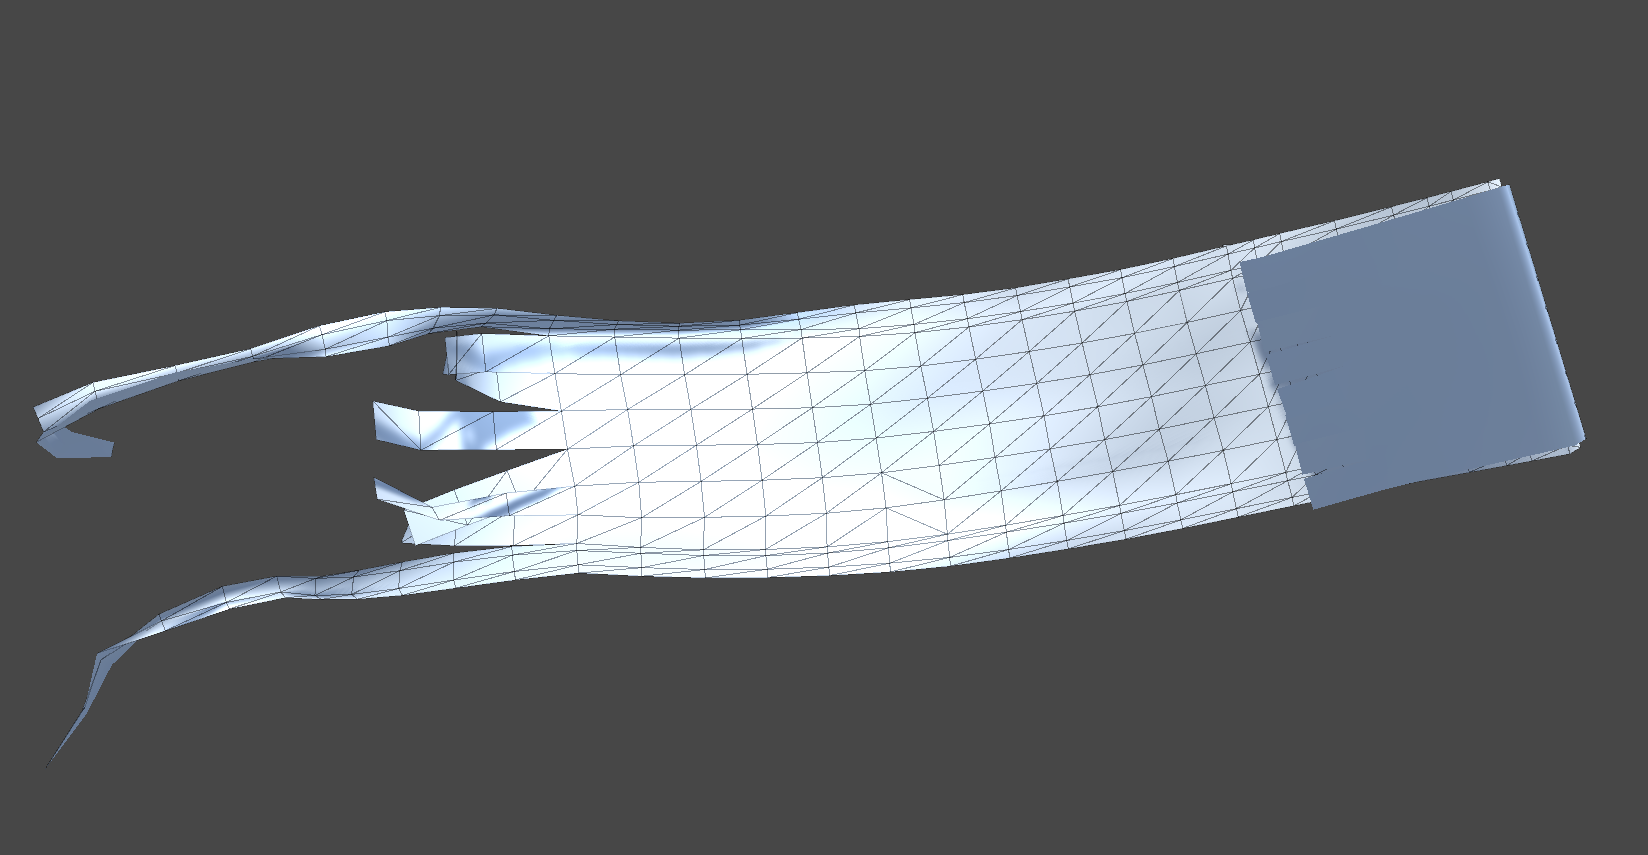
But if you go further than let’s say ~1.5 Kilometer, you can see a different mesh rendered.
The thing is, by that distance (over 1.5km), a big building at that screen-size, in a typical open world, you should be seeing an imposter!!!
So far, i was not able to spot more than a single level of details in big meshes (that has different levels) until i’m not able to see the mesh in the scree. So for that ruin example, i was seeing that later simplified version in all captures since 1.5km, until i was not able to see the entire building altogether.
Again, this is only when meshes have different versions (i WON’T call it LODs), in Elden Ring, many meshes have no versions (LODs)!!!
This type of issues is neither engine issues, nor rendering problem, it’s more of a typical mess in the asset production pipeline, and probably this could be due to the absence of some tech art positions, who knows! But if Elden Ring had real solid tech art team (5-8 for such a big game), those things would have gone way better, and would have made some big difference in the final game quality & performance.
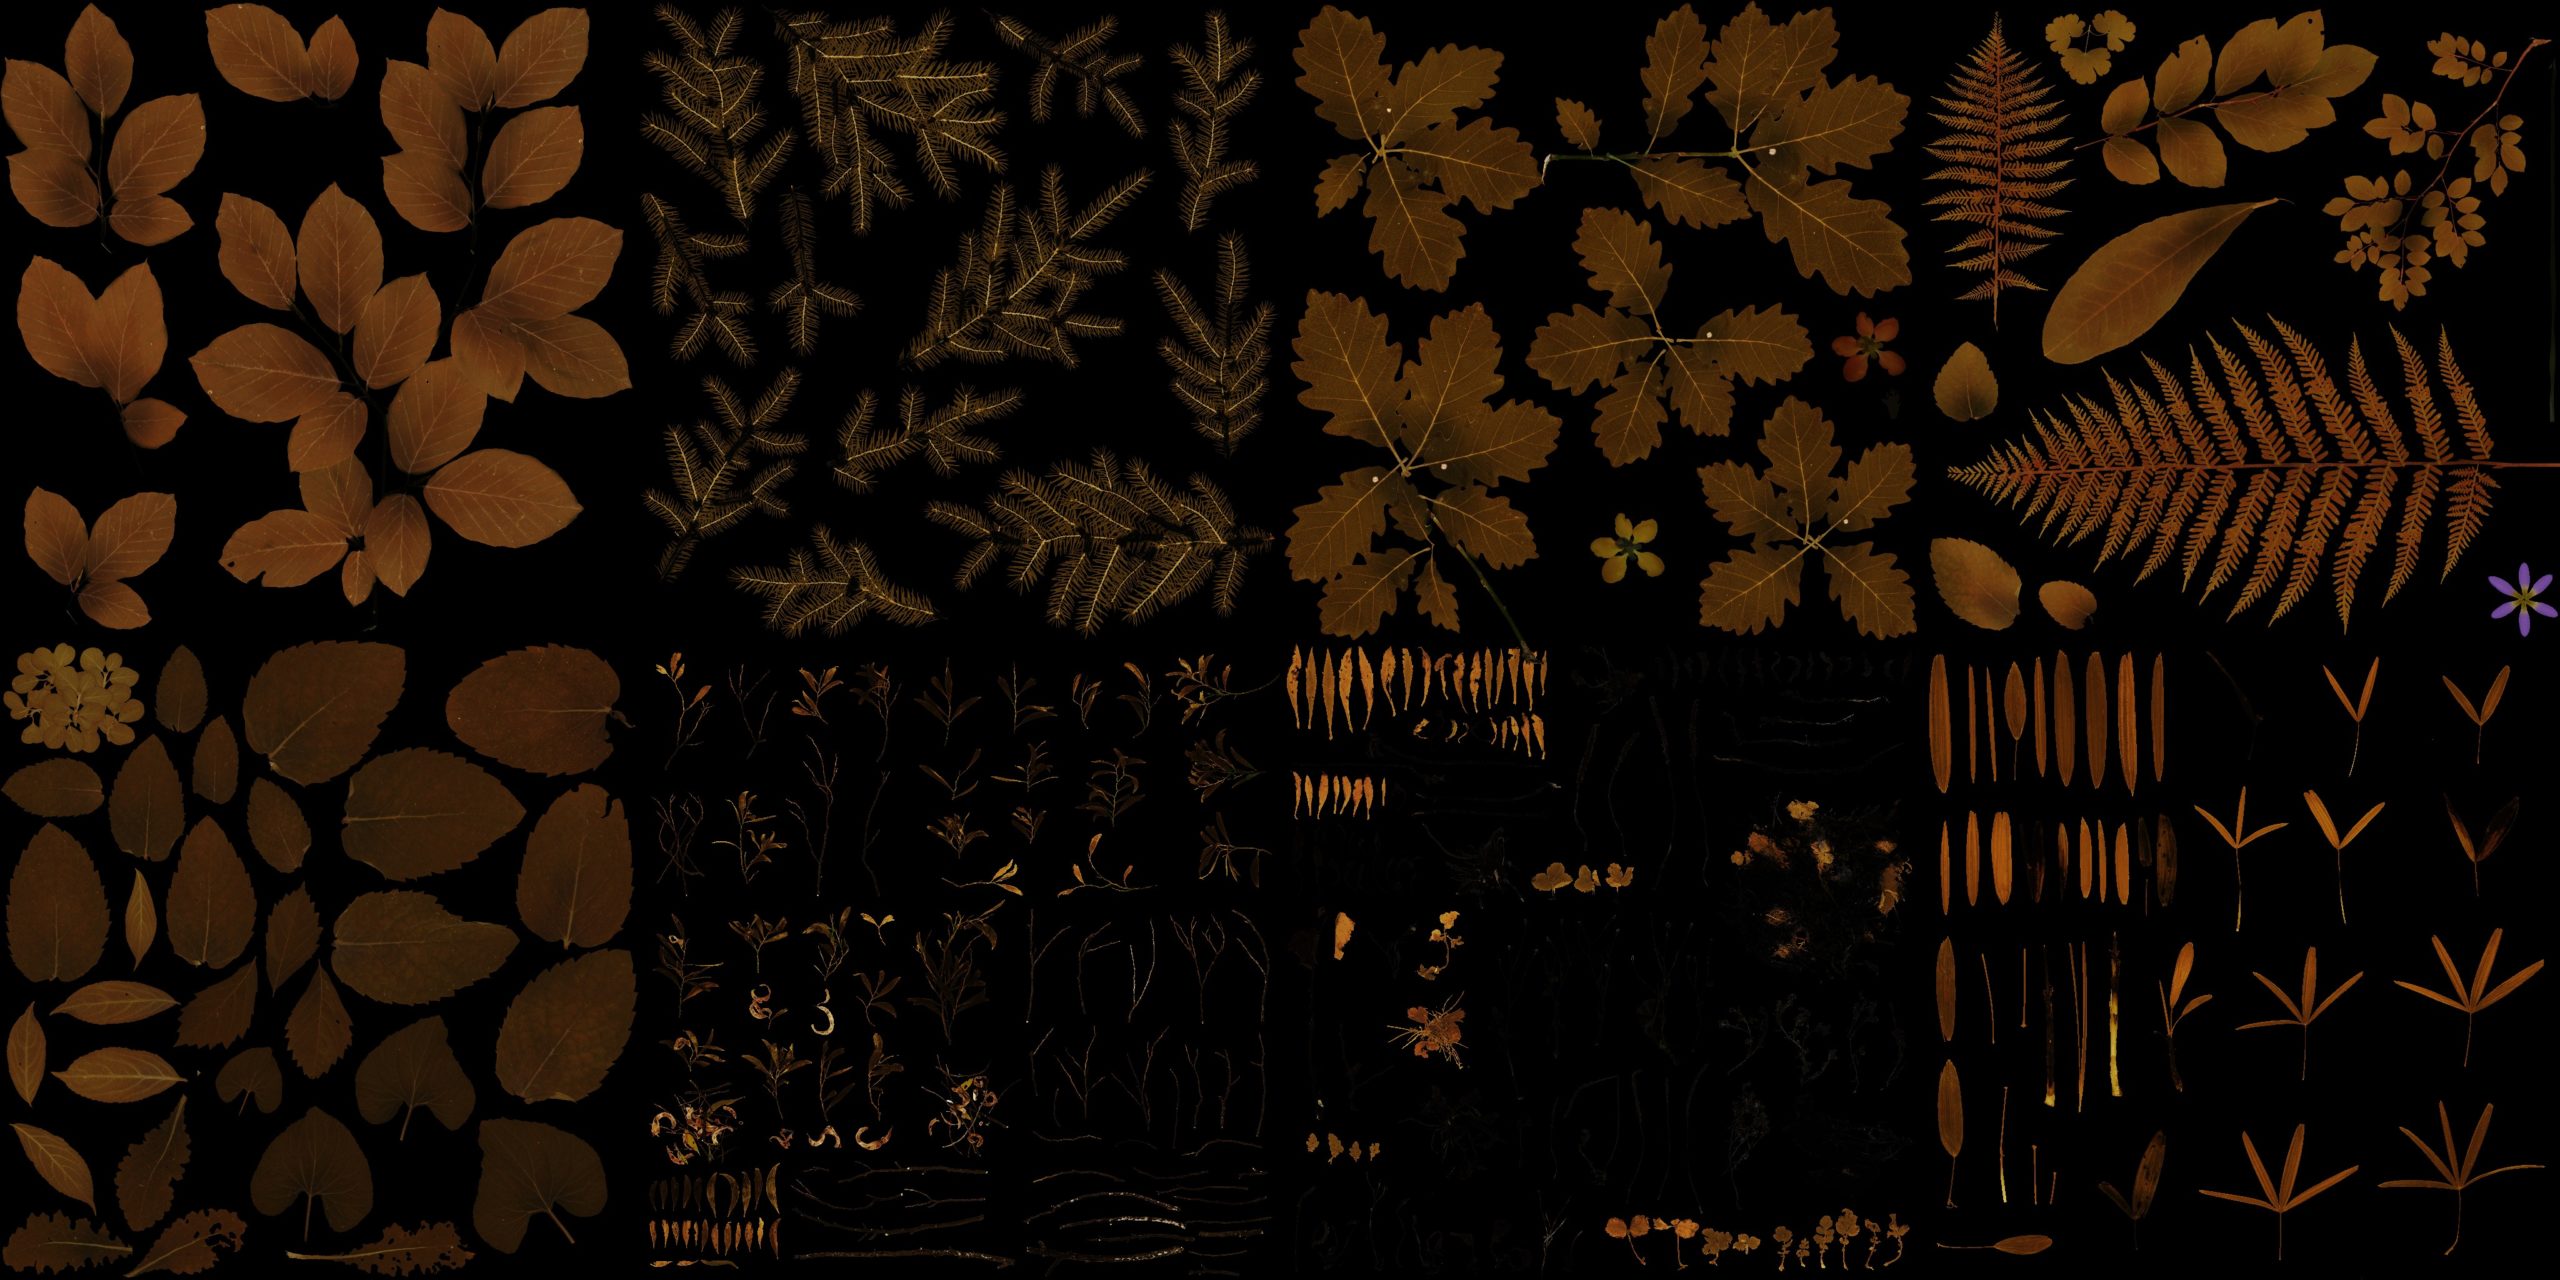
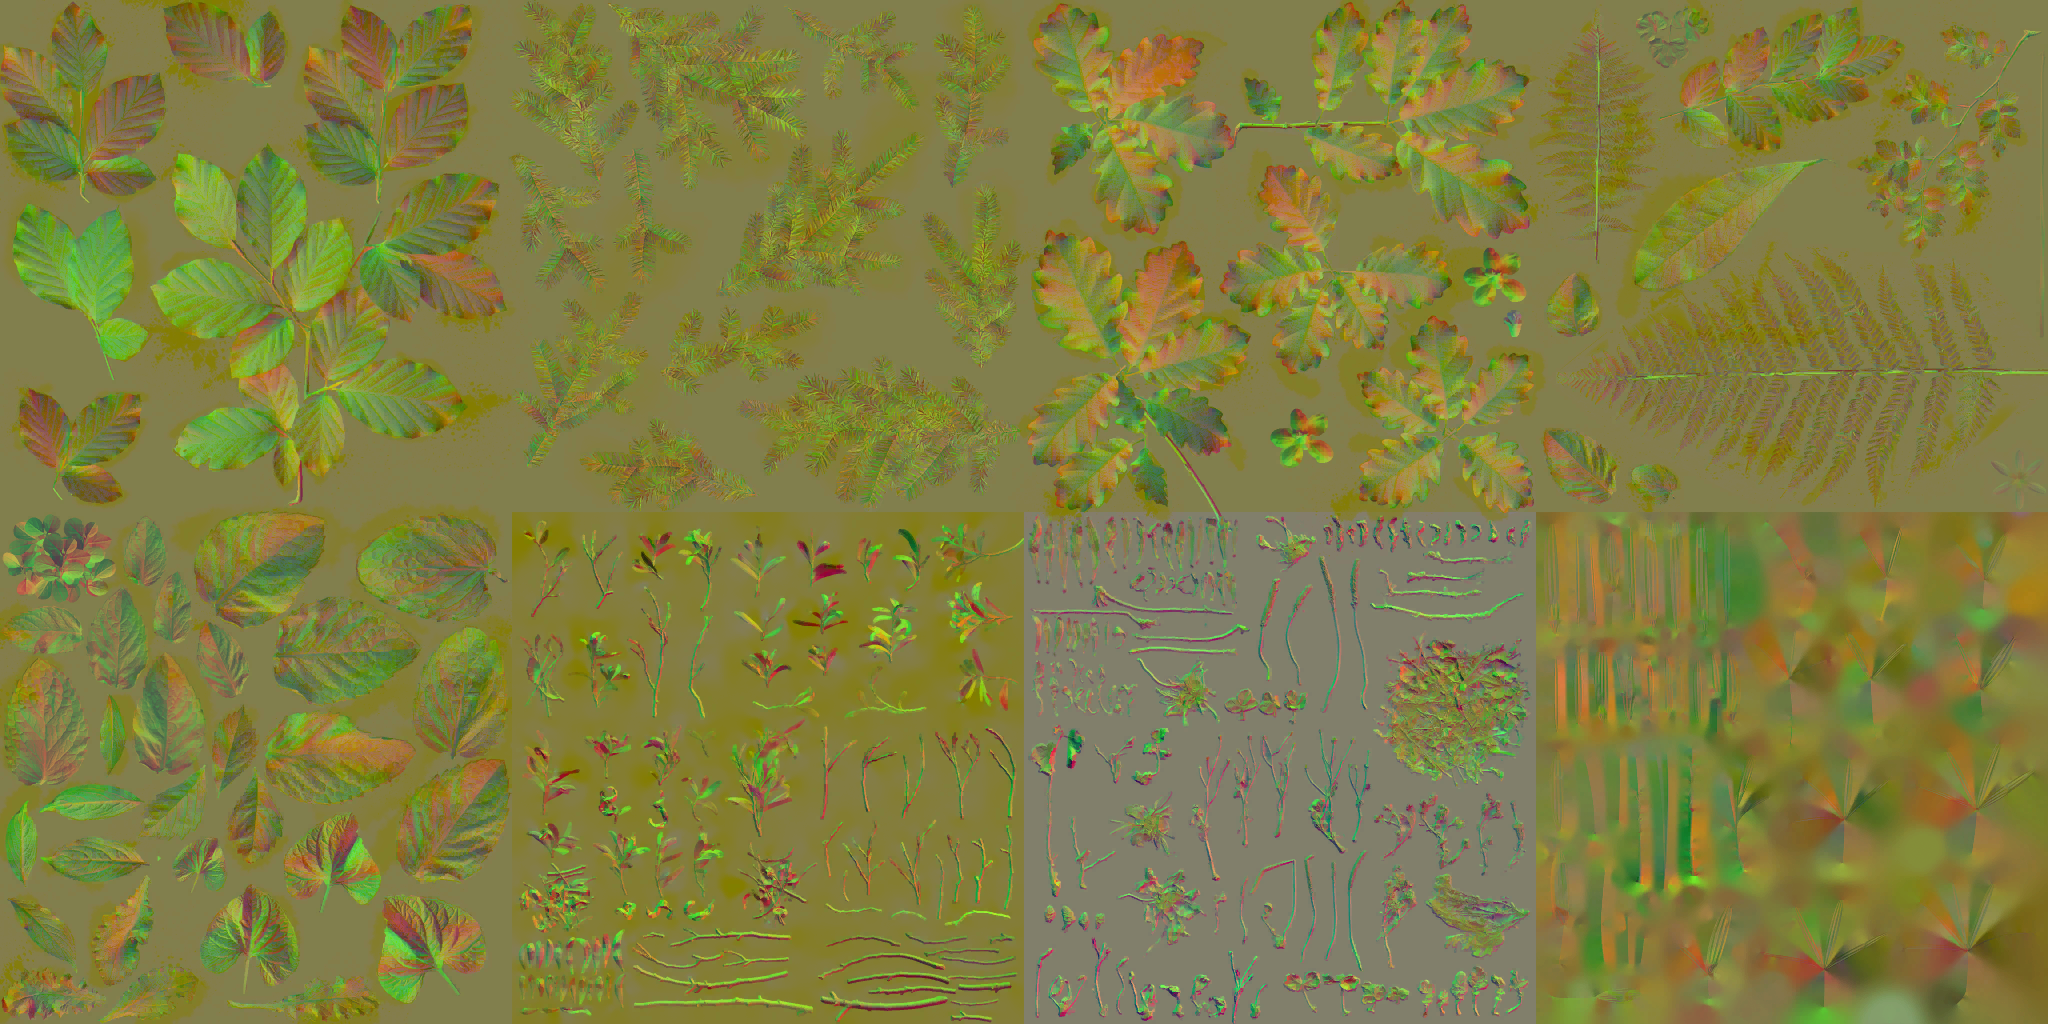
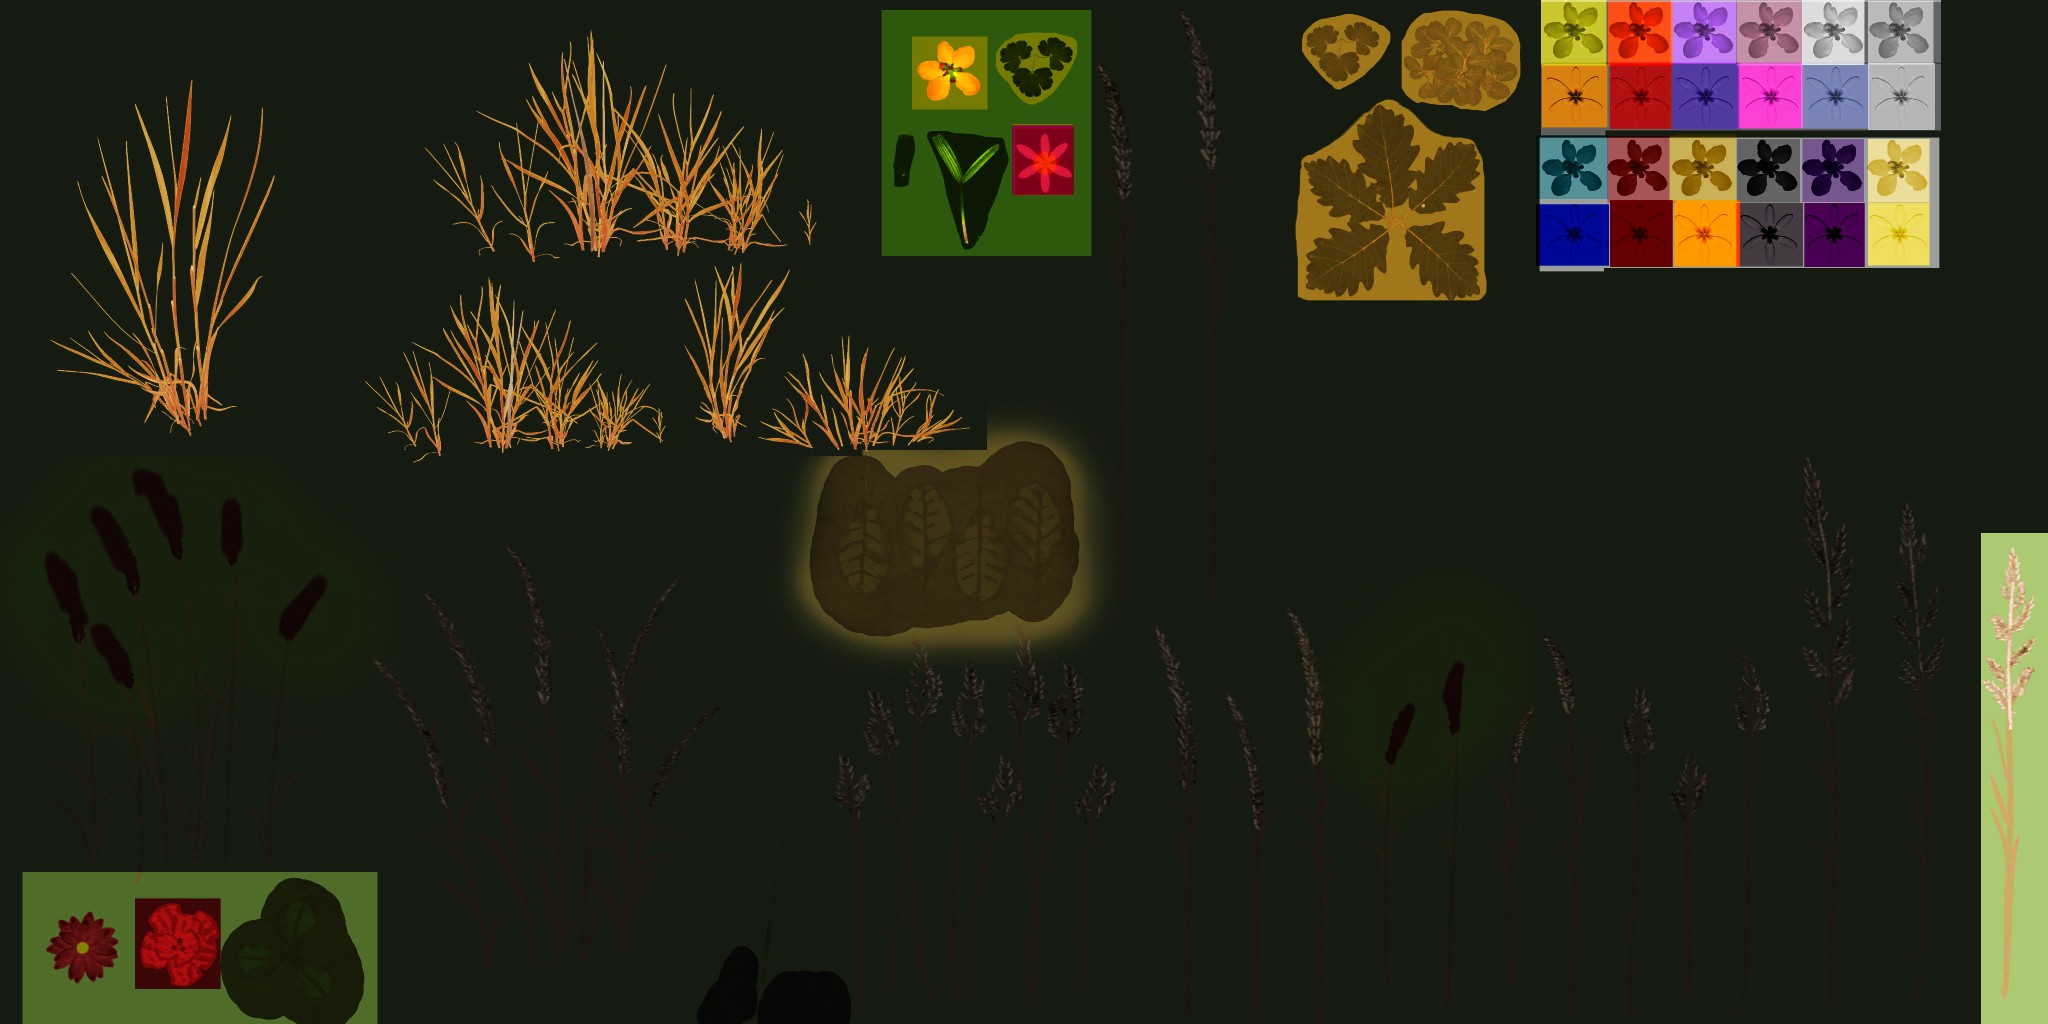
This doesn’t mean everything related to assets and organizing them is not well utilized, nope! There are defiantly great things, and one of the things that i liked the most, is the foliage atlases. So you can think about it as an atlas per area or per family of thing, that holds all the possible tree leaves forms for that area, all in one atlas. which is good idea, load it once and use it while playing in that area between minutes up to hour if you wish! Not only that, but the texture size decisions is the type of decisions that i like when it comes to “supporting” textures such as normal textures.
Third Party Frameworks
Since the first splashscreen i ever saw in a game, it became sort of addiction to look at the beginning of every game (perhaps the far end of the credits too) and see what are the 3rd party frameworks that the developer decided to go with in order to boost their beast game engine. There are things that became a trade mark, things that you see in every splash in every game you play. Anyways, when i played Elden Ring, i never saw any. The game starts with BandaiNamco splash, followed by FromSoftware splash, and then the game’s main menu. And when exit, the game just exist to black. Settings did not include any “credits” to let you launch the game credits as many other games do. So, this imply one thing…or perhaps two things. First, that the game does not rely on any third parties. And second, that the entire beast was built fully by From Software.
But this turned to be….a bit confusing…
When taking captures for the game menu, I was able to spot that 4k*2K atlas texture that is basically full of either licensing texts, or third party logos.

As you can see, Speedtree, Bink, Havok, Oodle, Wwise…This is always present. So, does this mean those 3rd party utilized for the game? Or, does this mean those were used at somepoint, may be a remains from old/previous engine, and not the case anymore? Or, may be the game is using them already but for Consoles, and their existence here is just a matter of crossplatform code not excluding those or even loading the entire 4k image at the wrong platform. Or maybe it’s just more simple than that, and someone forgot to put the spalshscreen to show at the right moment & it slipped from QA…I don’t know!!
Personally, will be biased towards the later possibility, as i was able to spot some Bink’s *.bk2 video files within the game install…
If you wondering what are this Japanese block of text is, after translating it, it’s a warning for illegal distribution without permission (not sure if it means the game, or the 3rd party files), but regardless what is the context of the warning, it’s the same case as the logos, i never saw that warning showing up on my screen at any moment!
Epilogue
Keep in mind that what i said above is only my point of view of reading many GPU captures and trying to connect the dots and reverse the frames to better understand them & to understand some of the decisions been taken about architecting them. Learning from other’s great ideas and learning from others’ mistakes is the ultimate goal for me behind those frames, so remember I’m not judging anyone here, I’m exploring, so take it with a grain of salt (as always).
I’m very glad that i was able to put this article in full, the second in a row, taking frame captures from games i play been a normal practice for over a decade, but every time i try to write something i fall in the busy circle of life, and the article end up in a long list of unfinished drafts. Thankfully this time, i was able to reach to the end of the article one more time, despite the fact that i started analyzing the game couple of weeks after the release, which means that article took near 3 months (if not more) of full weekends (and some insomnia nights during the week), so be easy on me if there is something missing or some typo[s]. There is still a lot of scrap notes on my desk that i did not cover or write down in this article, there also might be some things i ignored in purpose, and other parts may be unintentionally slipped from me, but the things i’ve listed is those things that matter for me when digging inside other games for knowledge.
I might not be the die-hard fan for the Souls genre, but as stated at the beginning of the article, i do like Miyazaki’s work, worlds, stories & lore[s], and if this is not enough reason to keep me playing that ~100 hours game and try to finish it, probably Melina will be enough reason, already loved her from a glance!

-m
Related Readings & Videos
What’s new in Direct3D 12
What’s New in DirectX 12? Understanding DirectML, DirectX Raytracing and DirectStorage
Feature levels in Direct3D
DXGI_FORMAT enumeration
Delta – Blog by 64 – Tone Mapping
Wikipedia – Tone Mapping
Tone mapping method comparisons
Advanced API Performance: Clears