Behind the Pretty Frames: Resident Evil
- Introduction
- Configs
- Behind the Frame
- D3D12
- Compute
- Frame
- Resident Vertex
- Copy & Clear
- Fast Clear/opy [Compute]
- Skinning [Compute]
- GPU Particles [Compute]
- Light Culling [Compute]
- Histogram Adjustment [Compute] [Not always]
- GPU Cluster Culling [Compute]
- Occlusion Culling (NDC)
- Instancing [Compute]
- Indirect Drawing
- GBuffer/Deferred
- Far Cubemap
- Fill Velocity [Compute]
- SSSSS [Compute]
- HI-Z Tracing [Compute] [Not always]
- AO
- Particle Depth Emitters [Compute]
- Indirect Illumination [Compute]
- Shadow Pass[es]
- Lighting Billboard Particles [Compute]
- Deferred Pass
- SSR [Compute] [Not always]
- Volumetric Fog
- FX / GPU Particles 1
- Volumetric light
- Light Shaft
- FX / Particles 2
- Post Processing
- Lens Flares Generate [Not always]
- Anti Aliasing (FXAA, TAA, FXAA+TAA) [Not always]
- Motion Blur
- DOF
- Lens Flare Composite [Not always]
- Soft Bloom
- Sub-Post-Processing
- AMD Fidelity FX [Compute]
- UI
- Output Color Adjustment
- Present
- Dithering
- RTX ON
- Interlaced Rendering
- Engine General Observations
- Epilogue
- Related Readings & Videos
Introduction


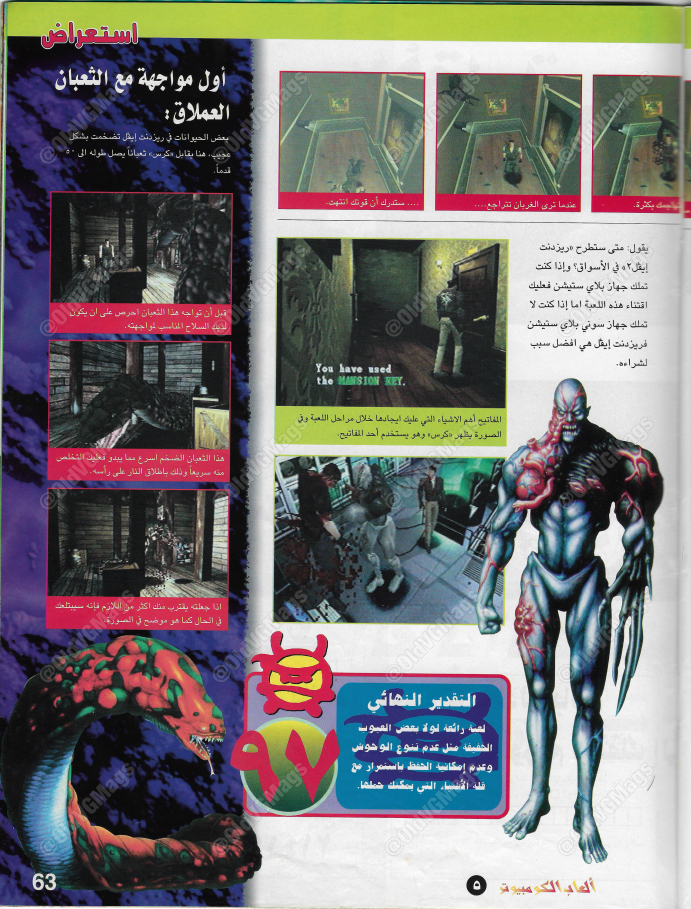

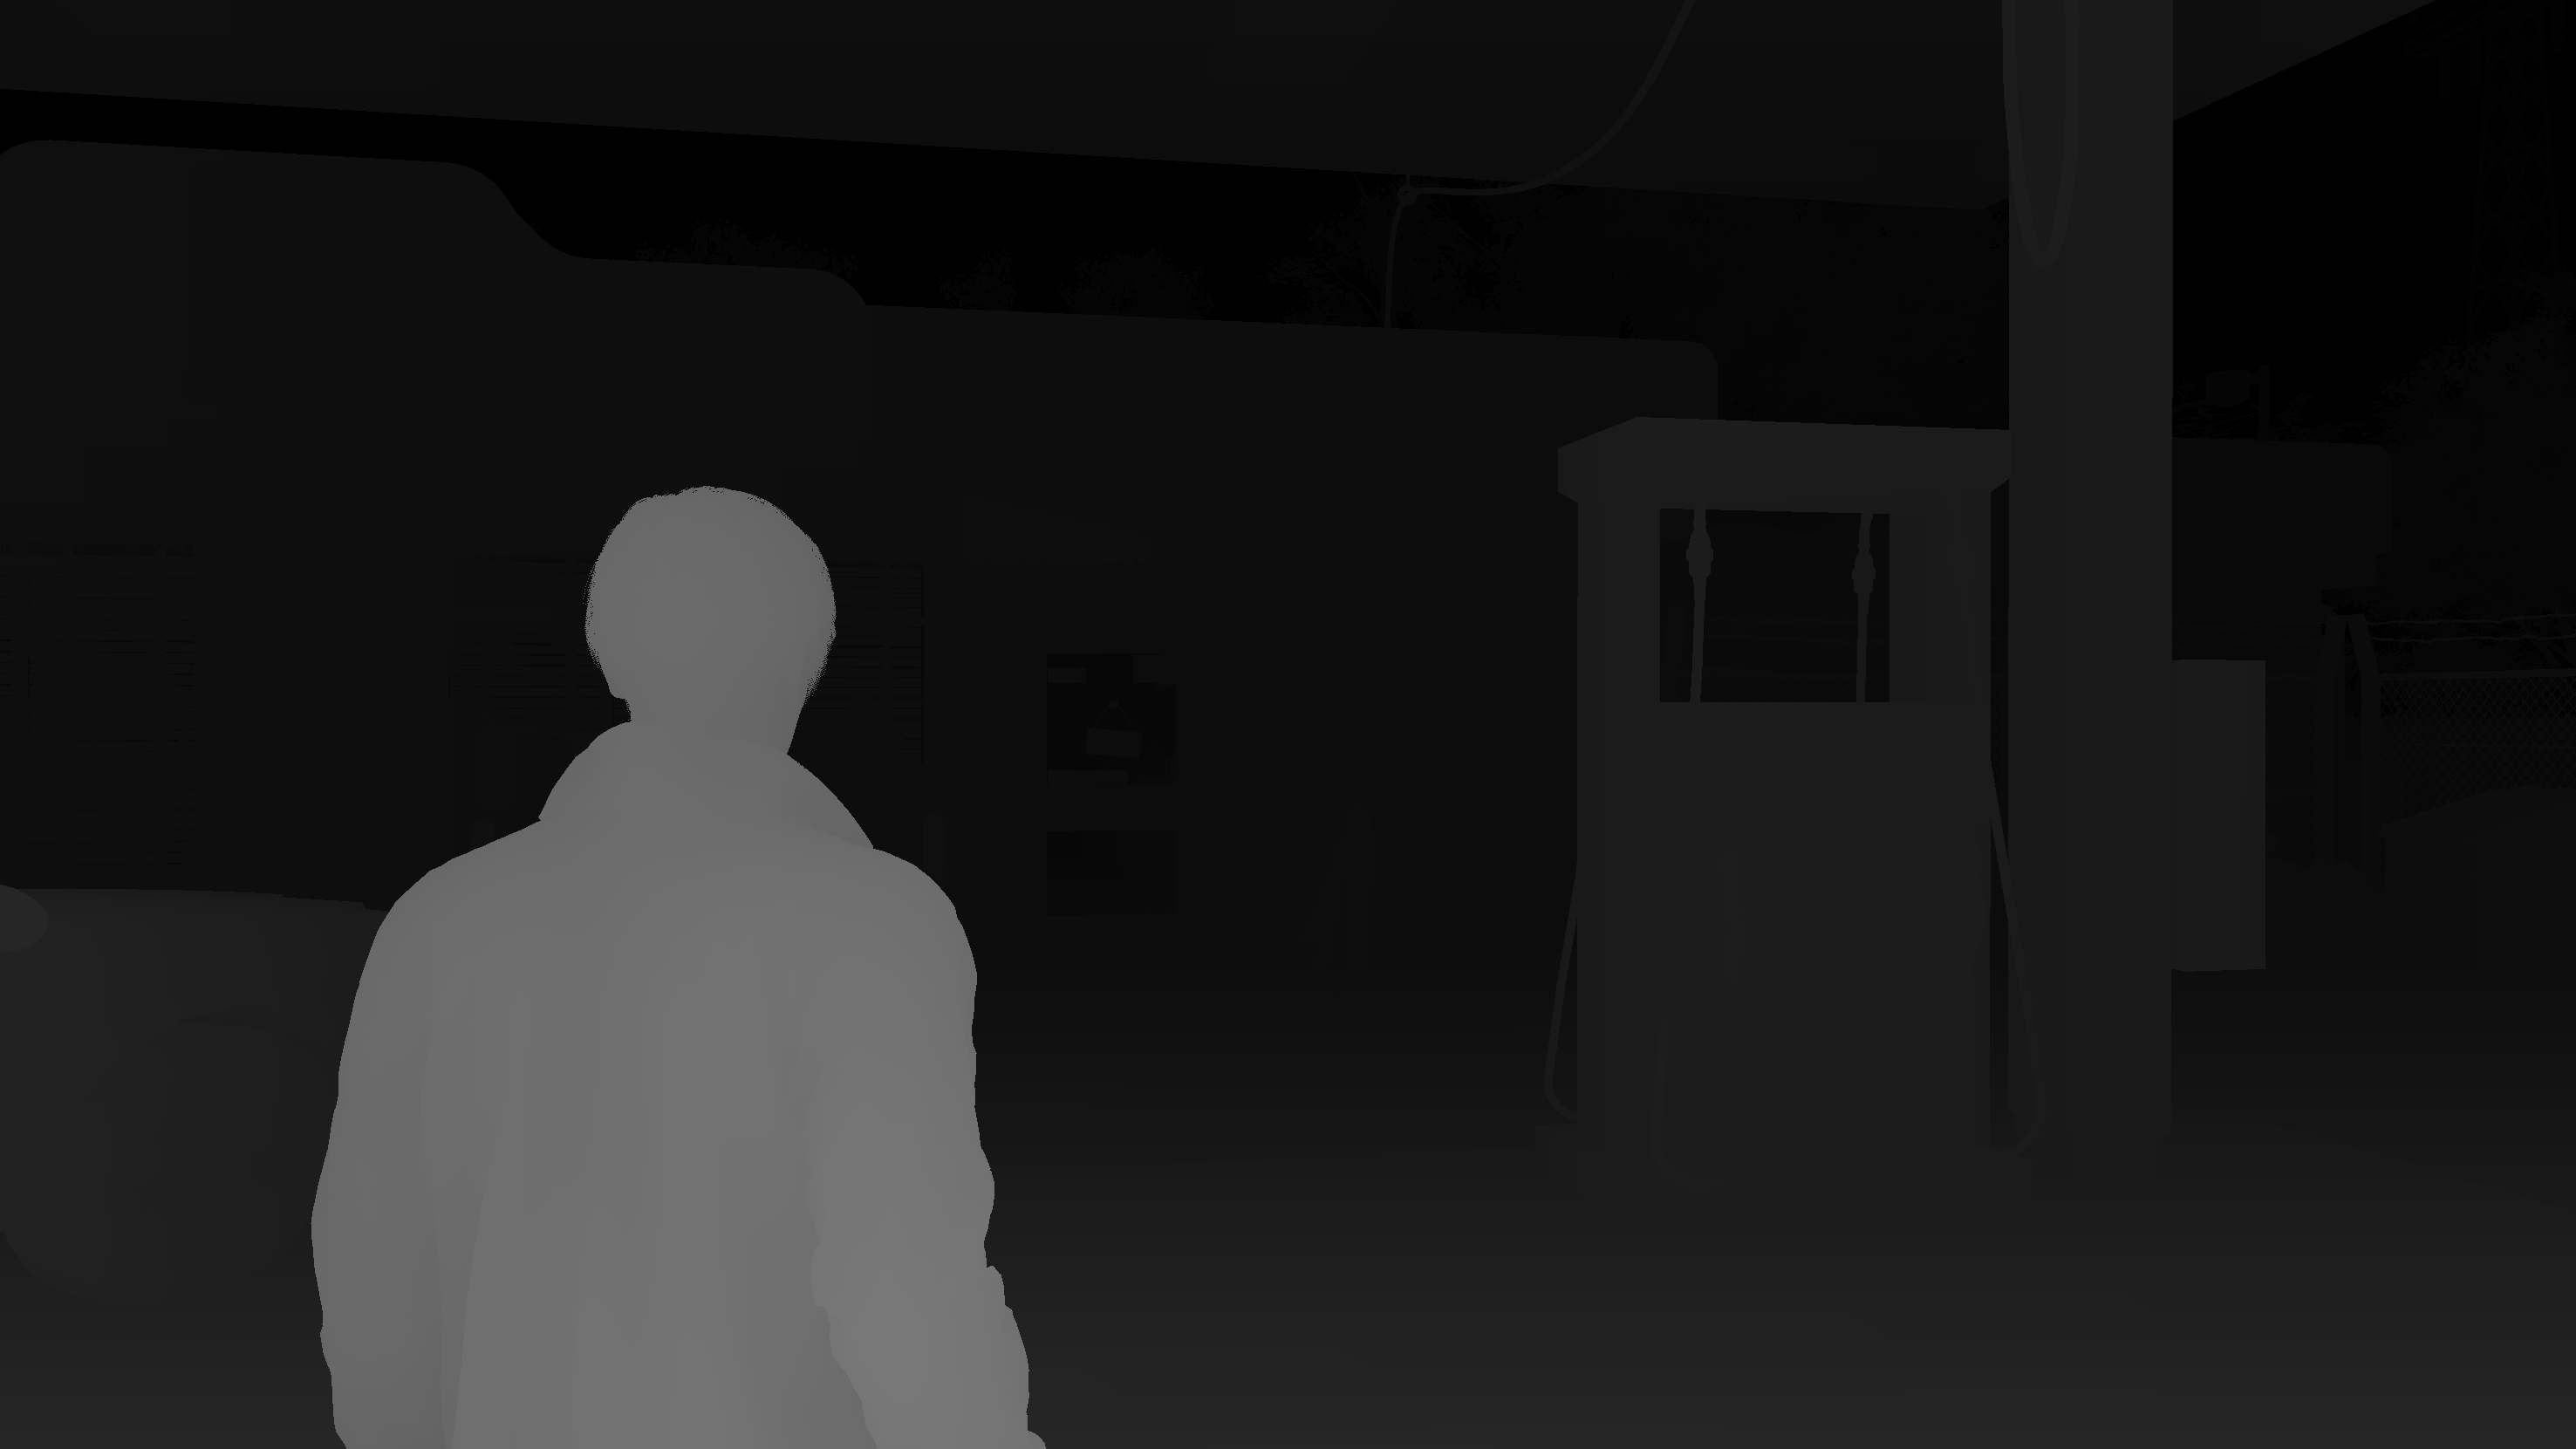
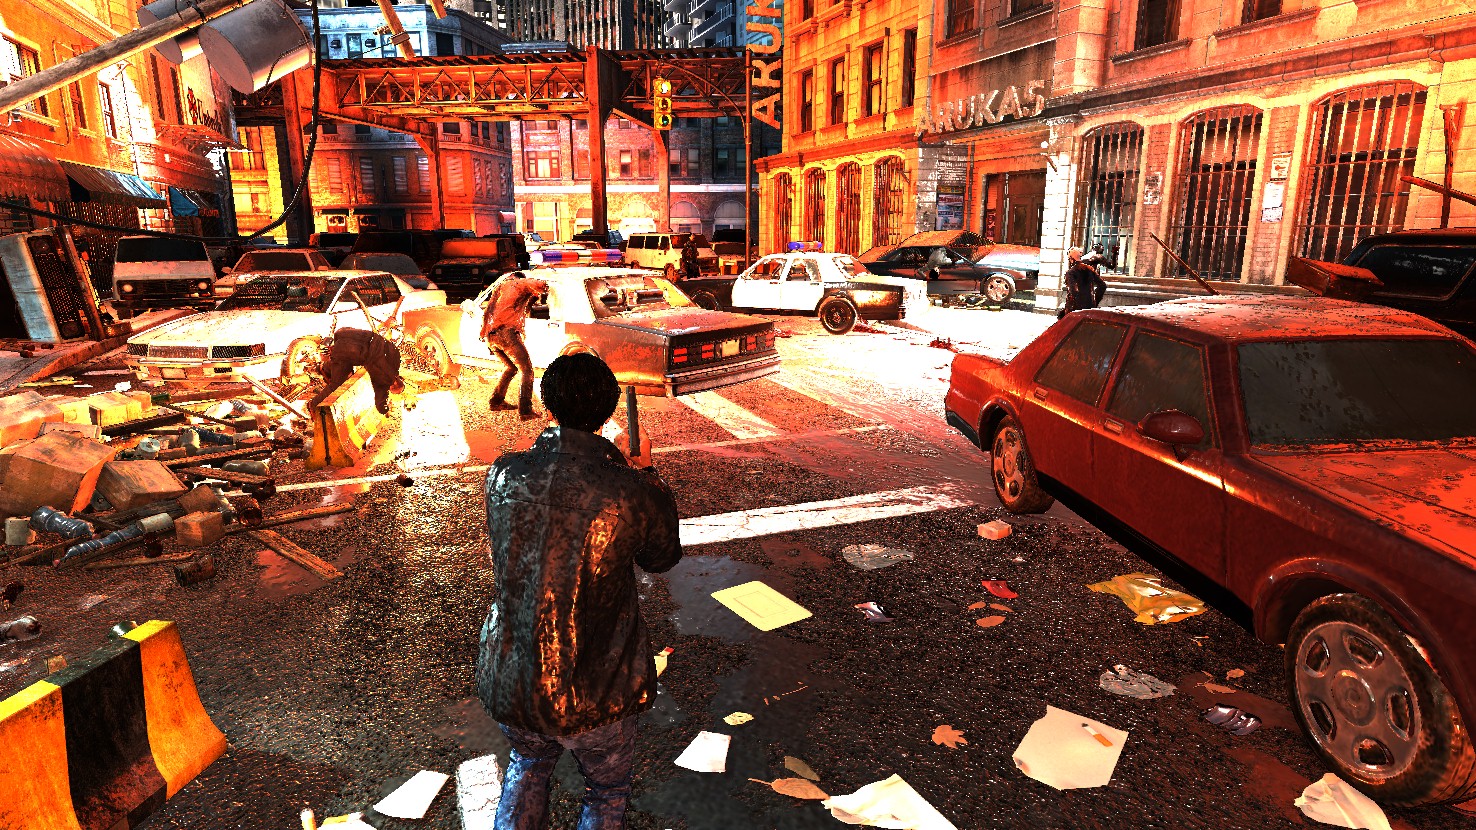
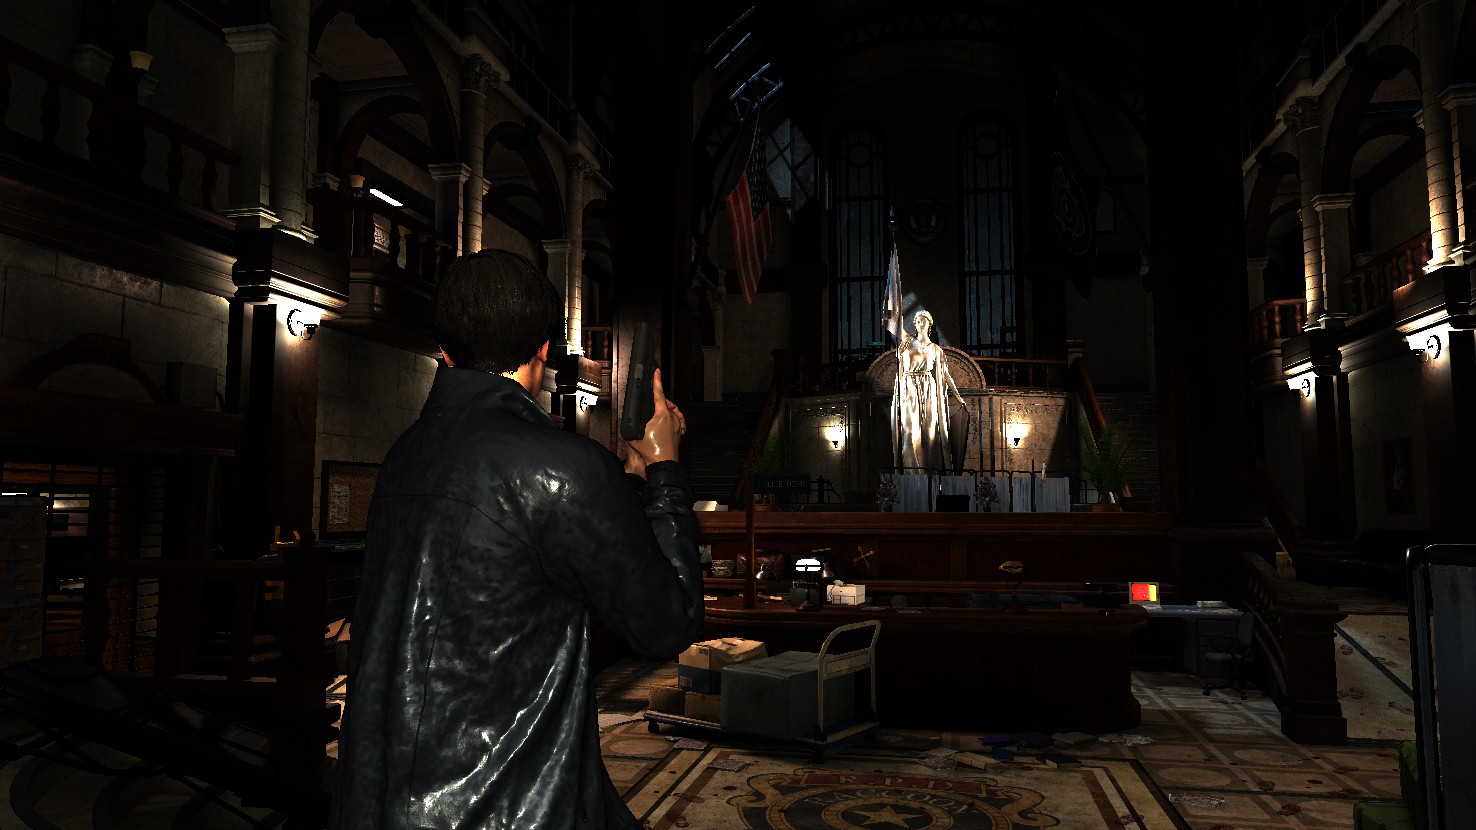
Resident Evil…what a franchise…regardless if you’re old gamer or a new gamer, you can’t have a gaming life without trying at least a single RE game. Horror games have not been my favorite recently, but back in the day Resident Evil, Silent Hill & Alone in The Dark, been on the top of my list. Can’t tell you how many times i did scream while playing those low-poly-covered-with-linearly-interpolated-and-very-pixelated-textures games with their SUPER REALISTIC (at the time) level backgrounds & their amazingly brilliant Tank Control design that made me afraid to go out of the view…Oh boy, good old games! I can’t recall how many times i had to cut pages from the (very expensive to ship to my country) gaming magazines to decorate my room & my reading desk!
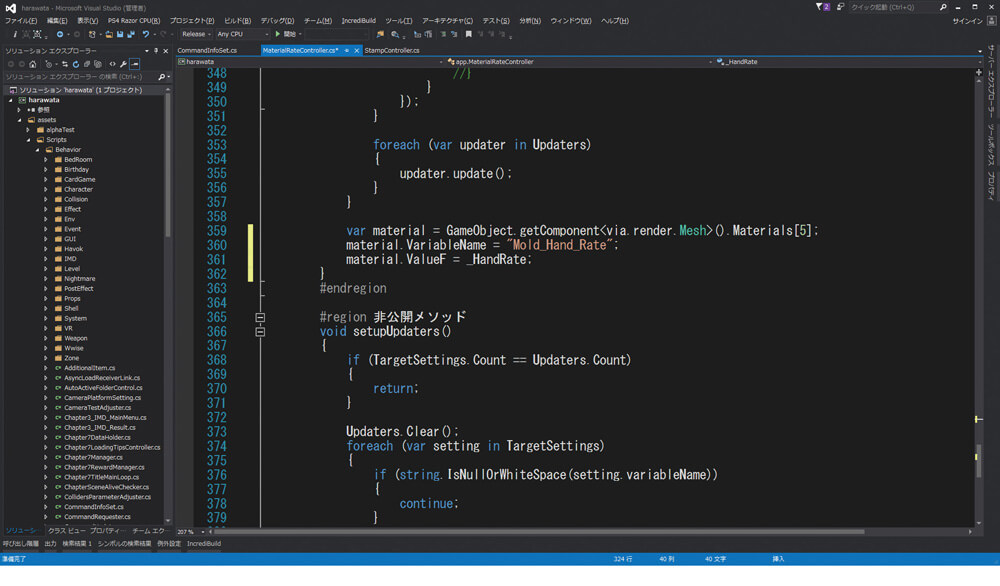
When RE7 released few years ago, it was a good opportunity to revisit that franchise after quite sometime of never playing any. It was great game, i did not complete it indeed because at that time it was around me everywhere, all people at office playing it all the time, during lunch, early morning and after work, anytime i just walk around, i find at least 2 playing it, even on the PSVR, so it was totally spoiled for me. BUT, at that time a Chinese friend who was learning Japanese in order to go to Japan and to work for Capcom (he did it eventually & joined Capcom’s teams couple of years after that situation) sent me an amazing article that is fully in Japanese. He knows that i’m always into any info about in-house engines, and he was hoping this article helps me to learn something new. And oh boy!! once i saw the article and went through the images & tried to google translate the text, i loved to learn more about that RE Engine (with fingers cross, i hoped to ship something with it) , i wanted to learn more about that thing that looks like a perfect balance between the simple to pick up engine with heavily dependance on Python, C# and VM scripting (such as Unity3d or Godot), and at the other hand that mastery of visual fidelity, best tooling and technology (like Frostbite, Snowdrop, Anvil, Northlight, Glacier, RAGE…etc.). I wanted to learn about that engine that has many rad ideas, things such as not packaging for target platform,…things such as modifying a gameplay C# code while the game already running and see the changes right away, that was interesting enough in 2017.. And hence the decision was taken, to try to hunt further info about the engine, and to try to breakdown any RE-Engine based game…But as it’s easy to get hyped, it’s even easier to lose interest due to the lack of time or resources…
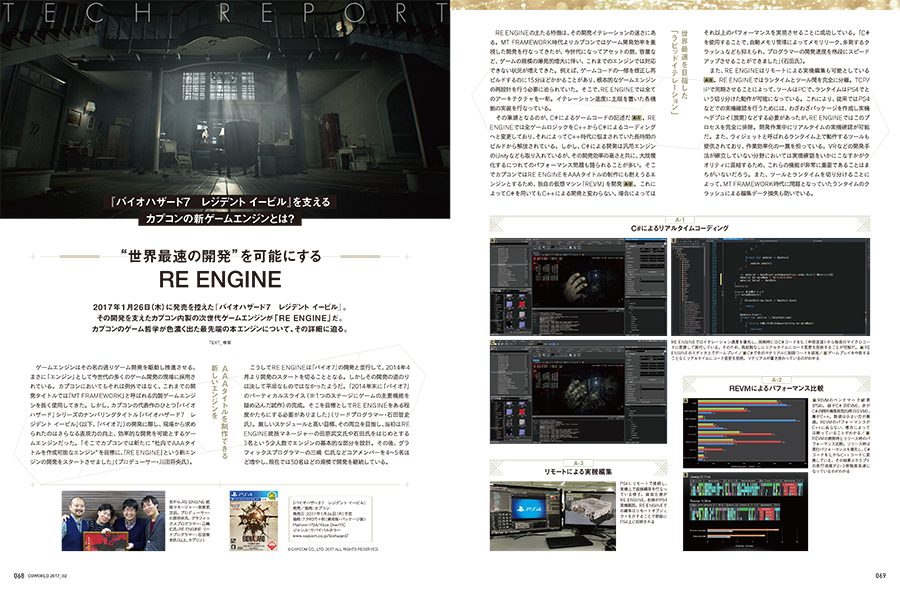
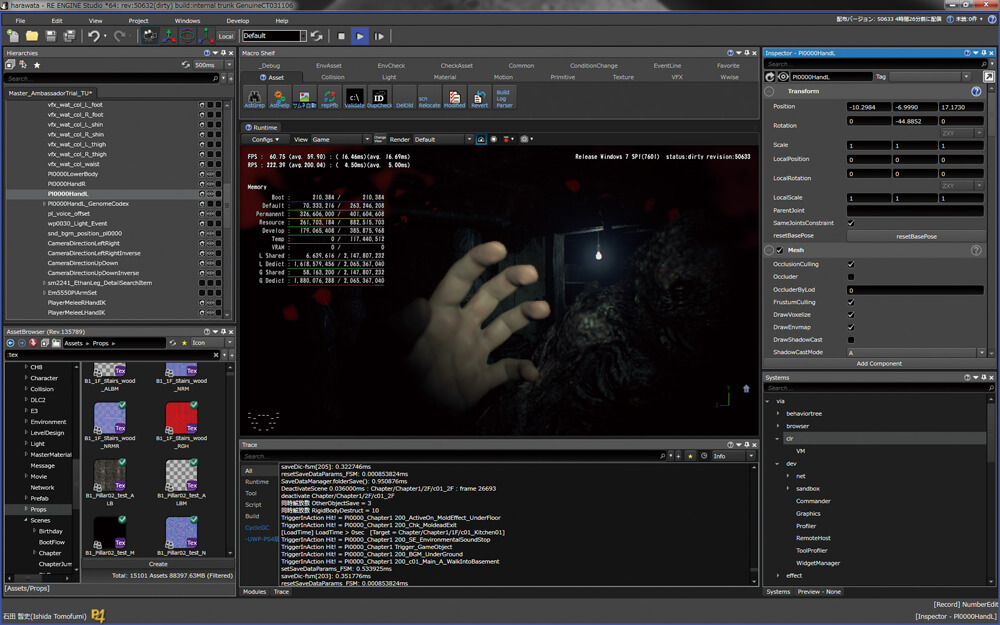
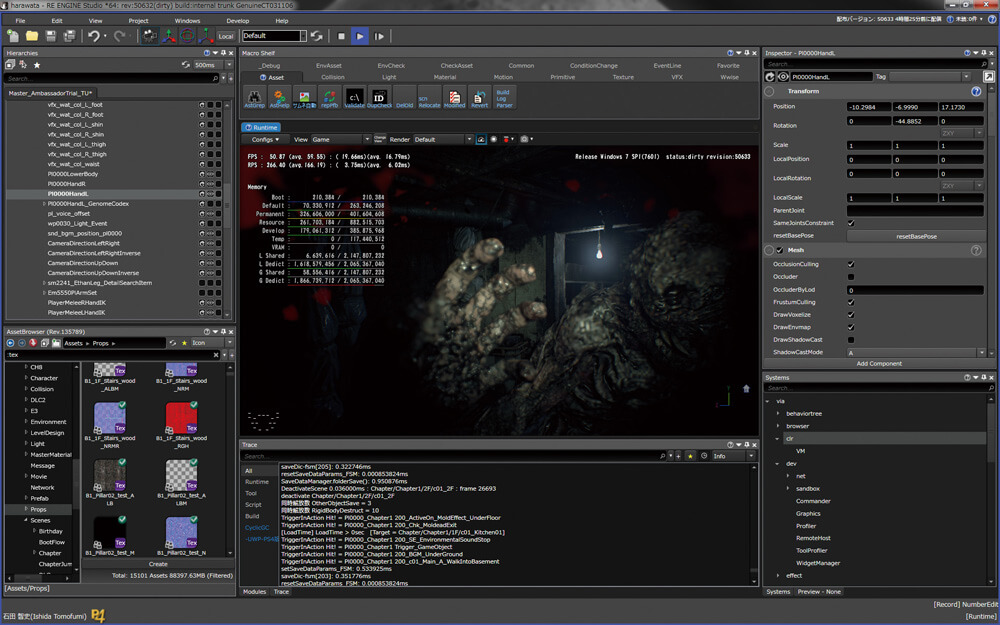
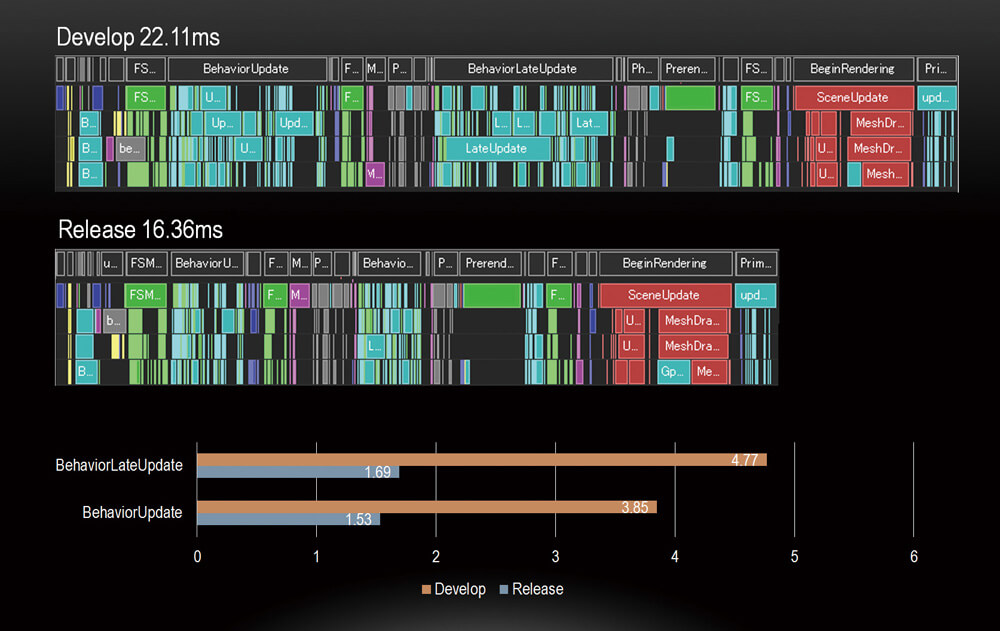
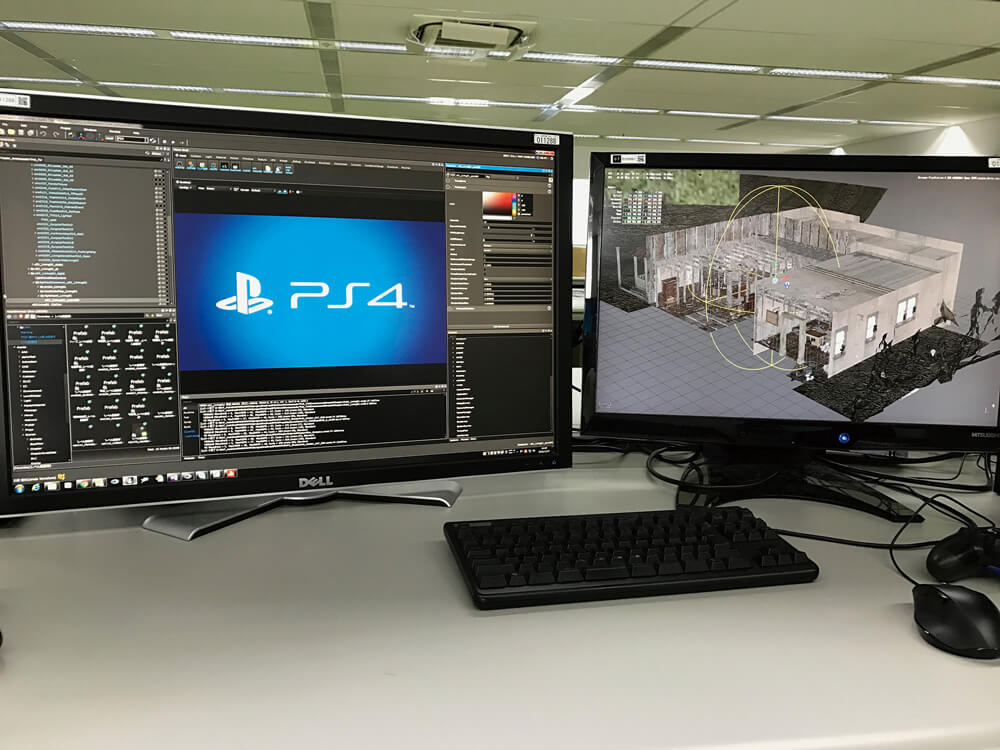
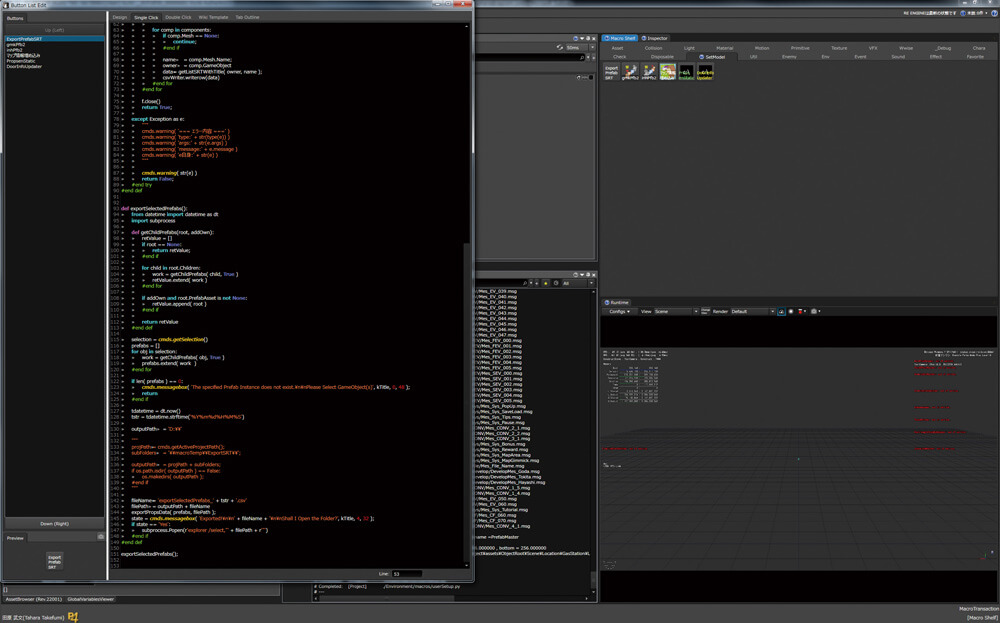
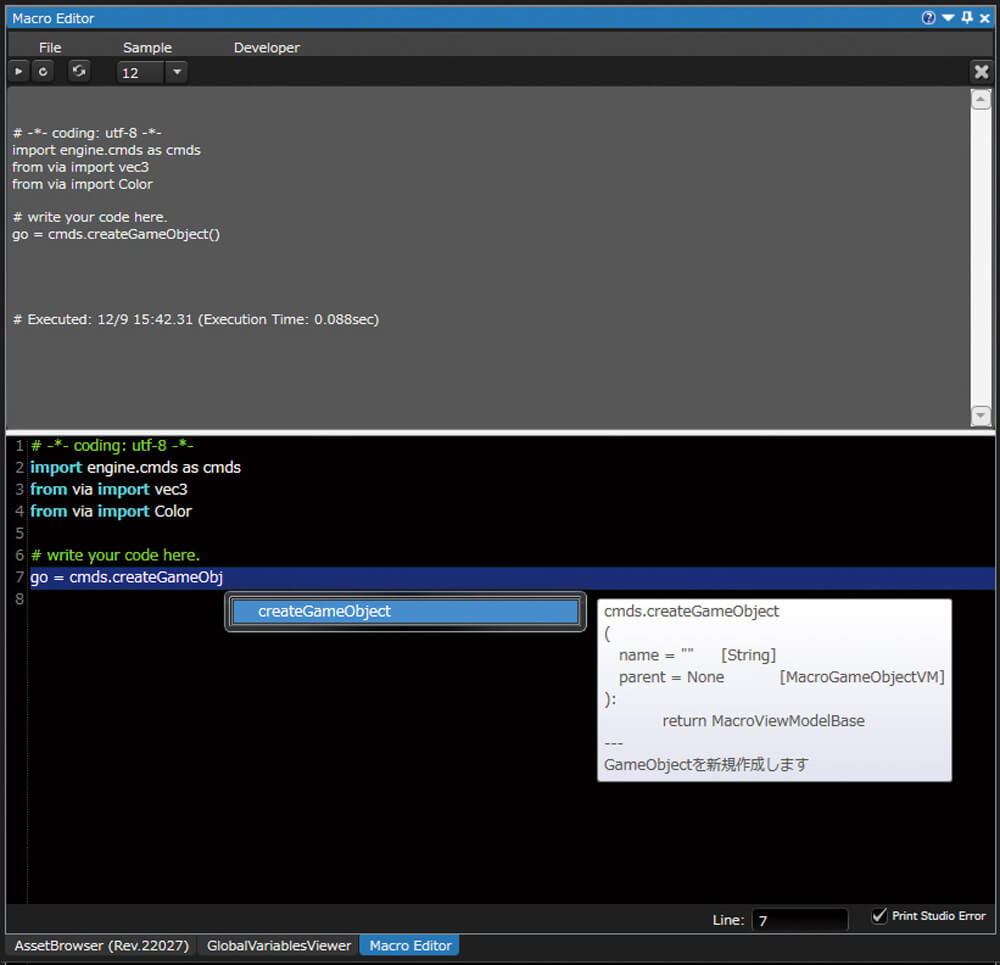
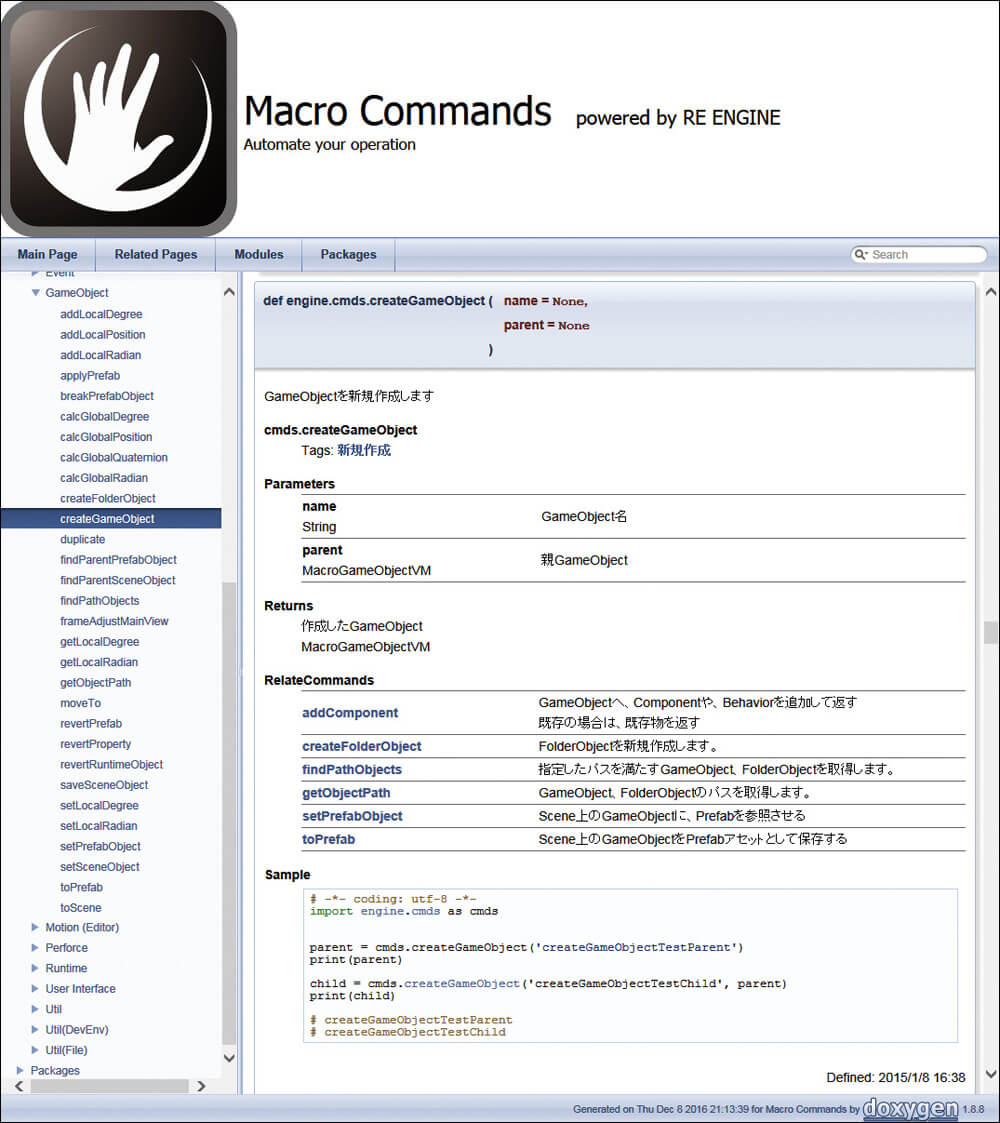
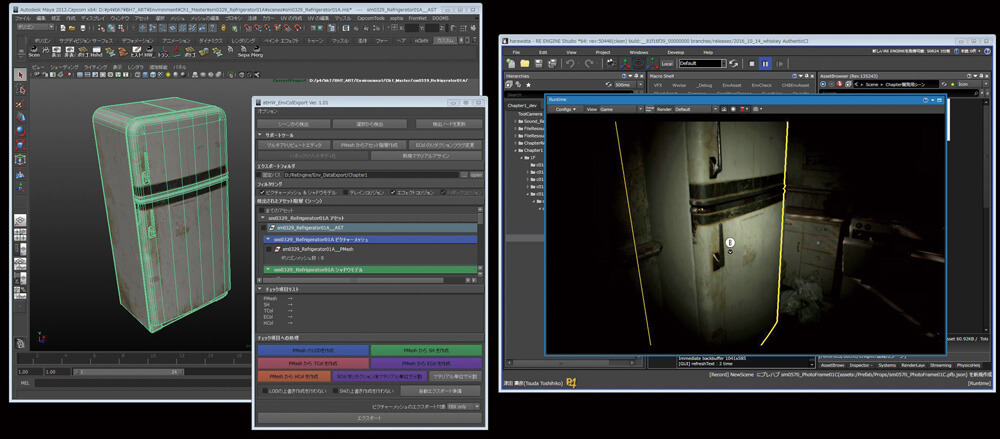
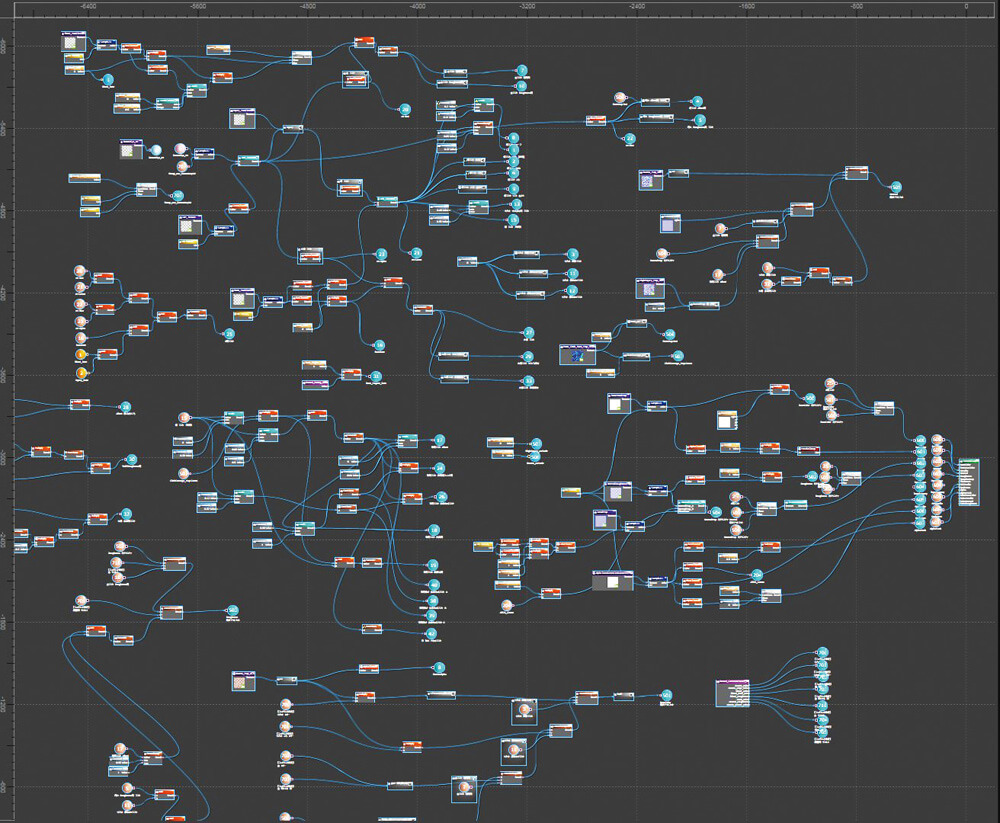
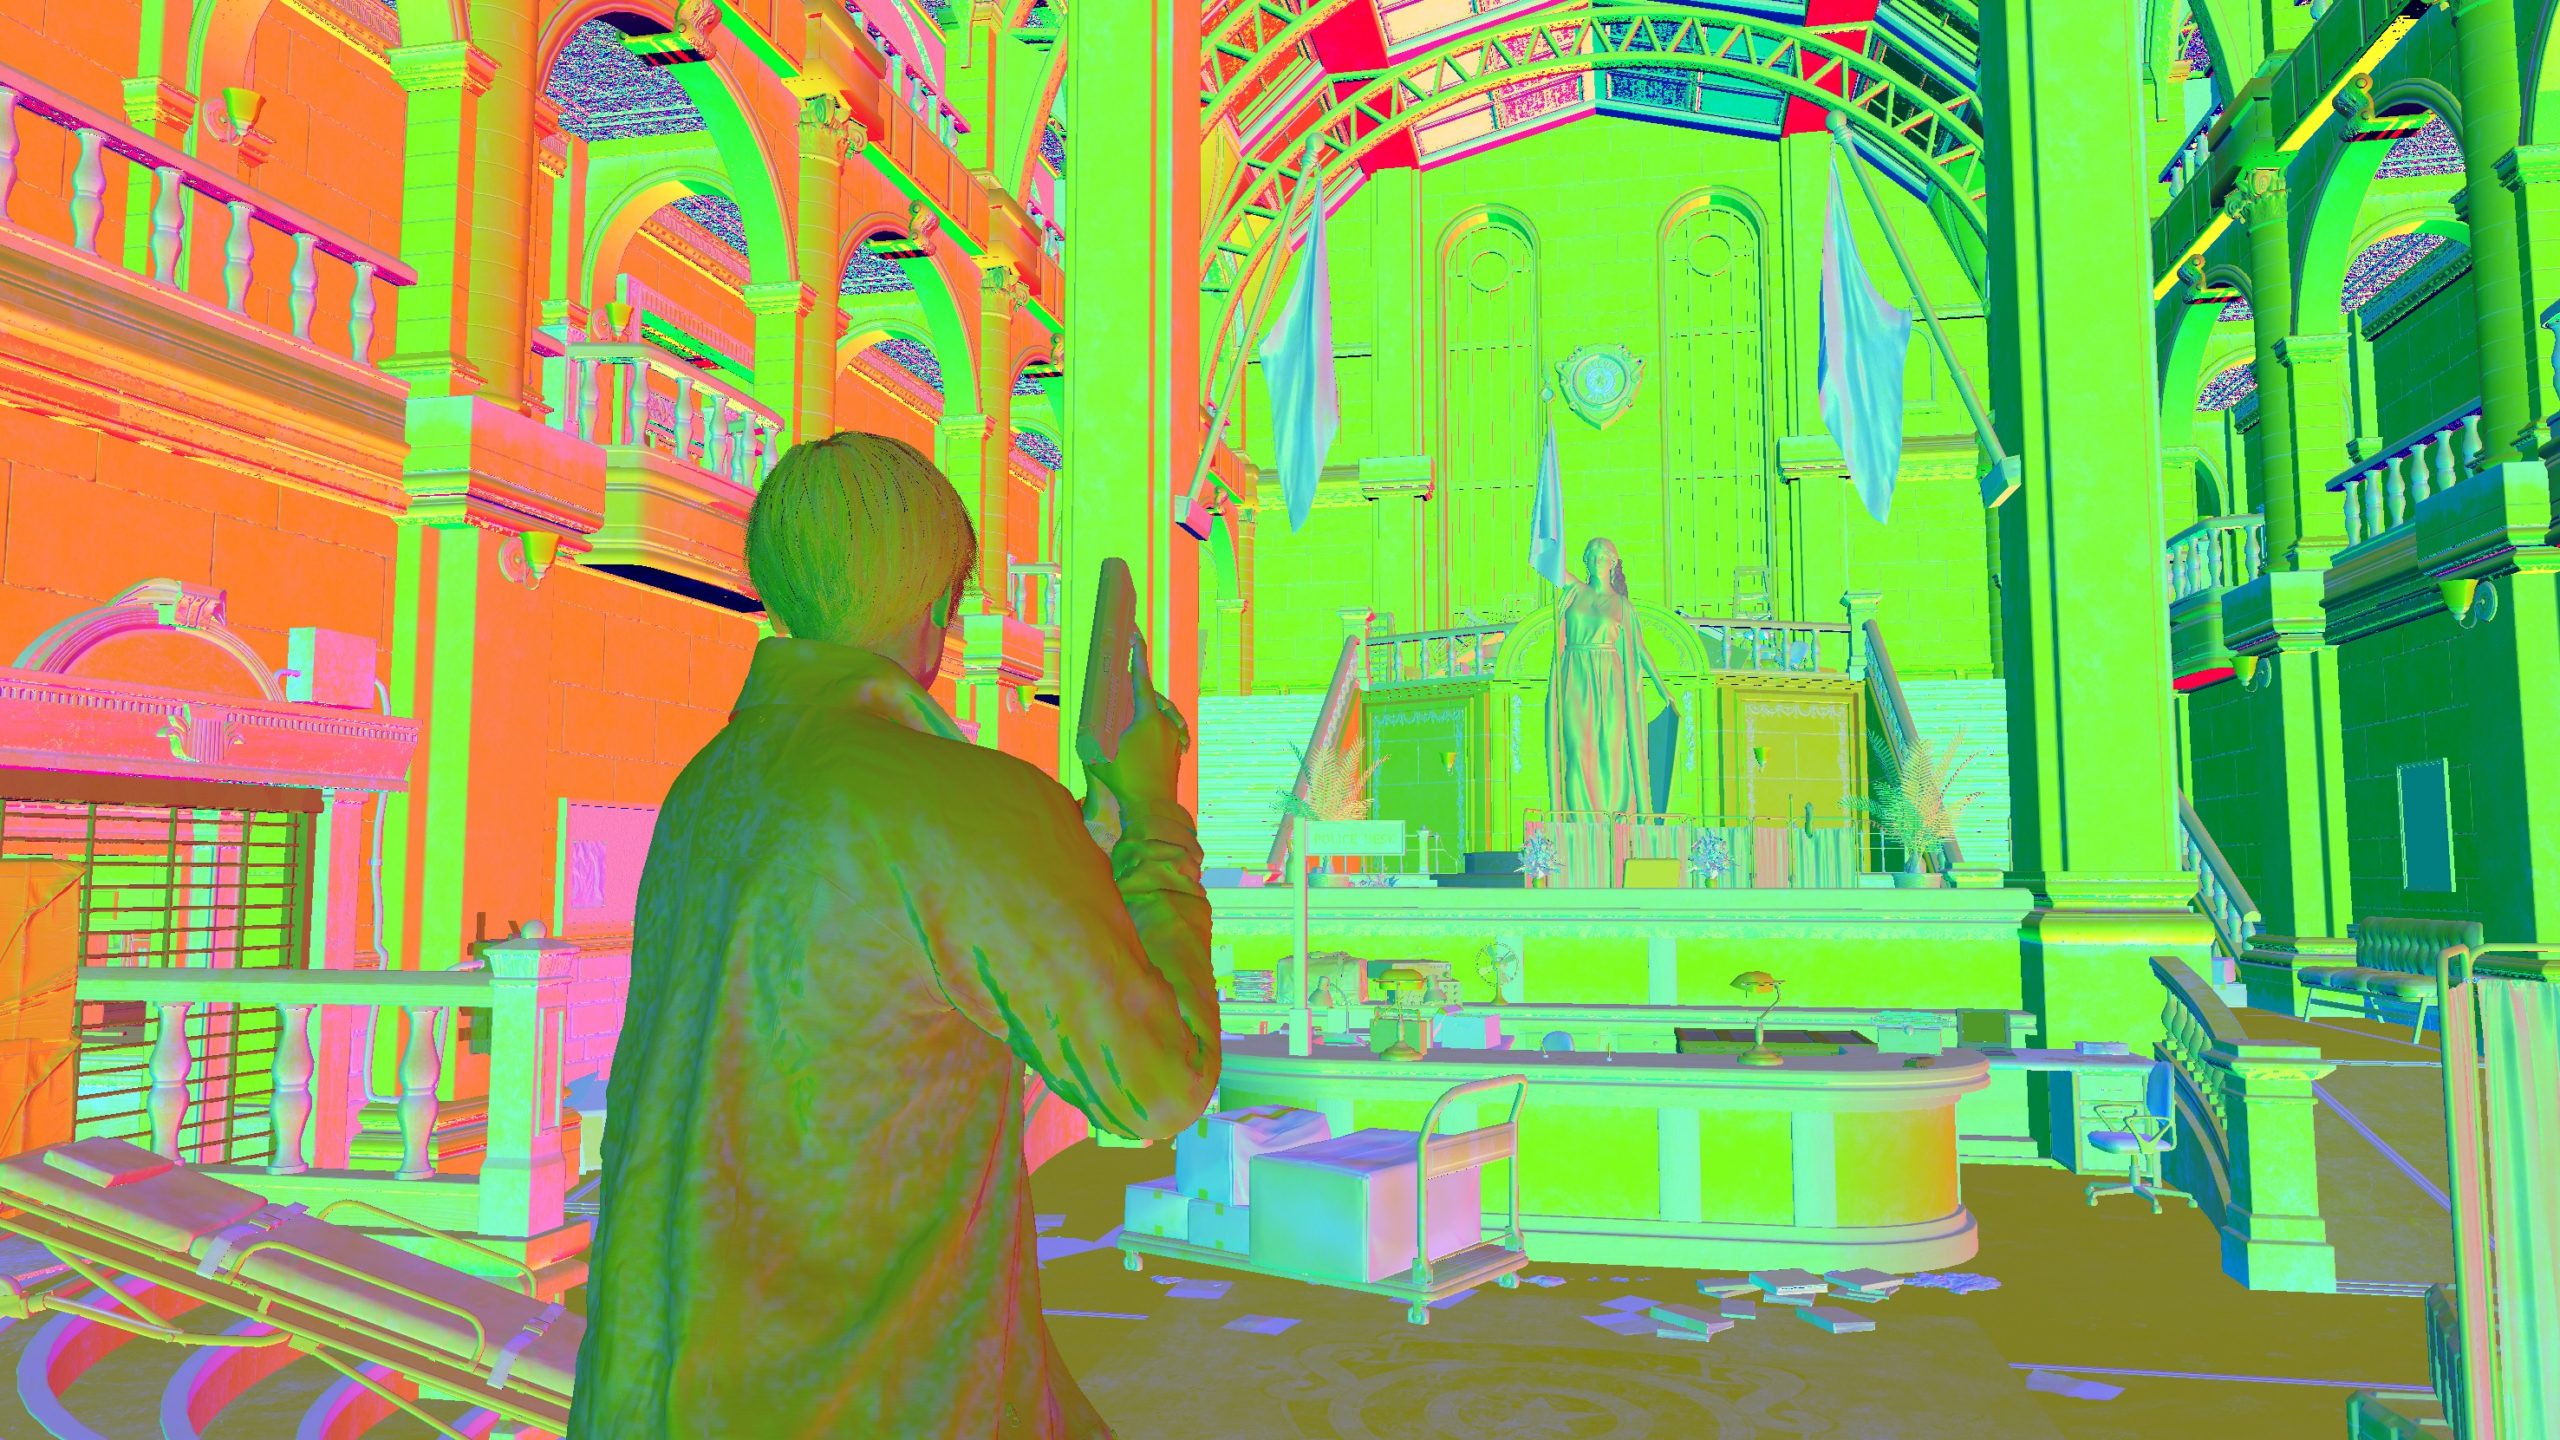
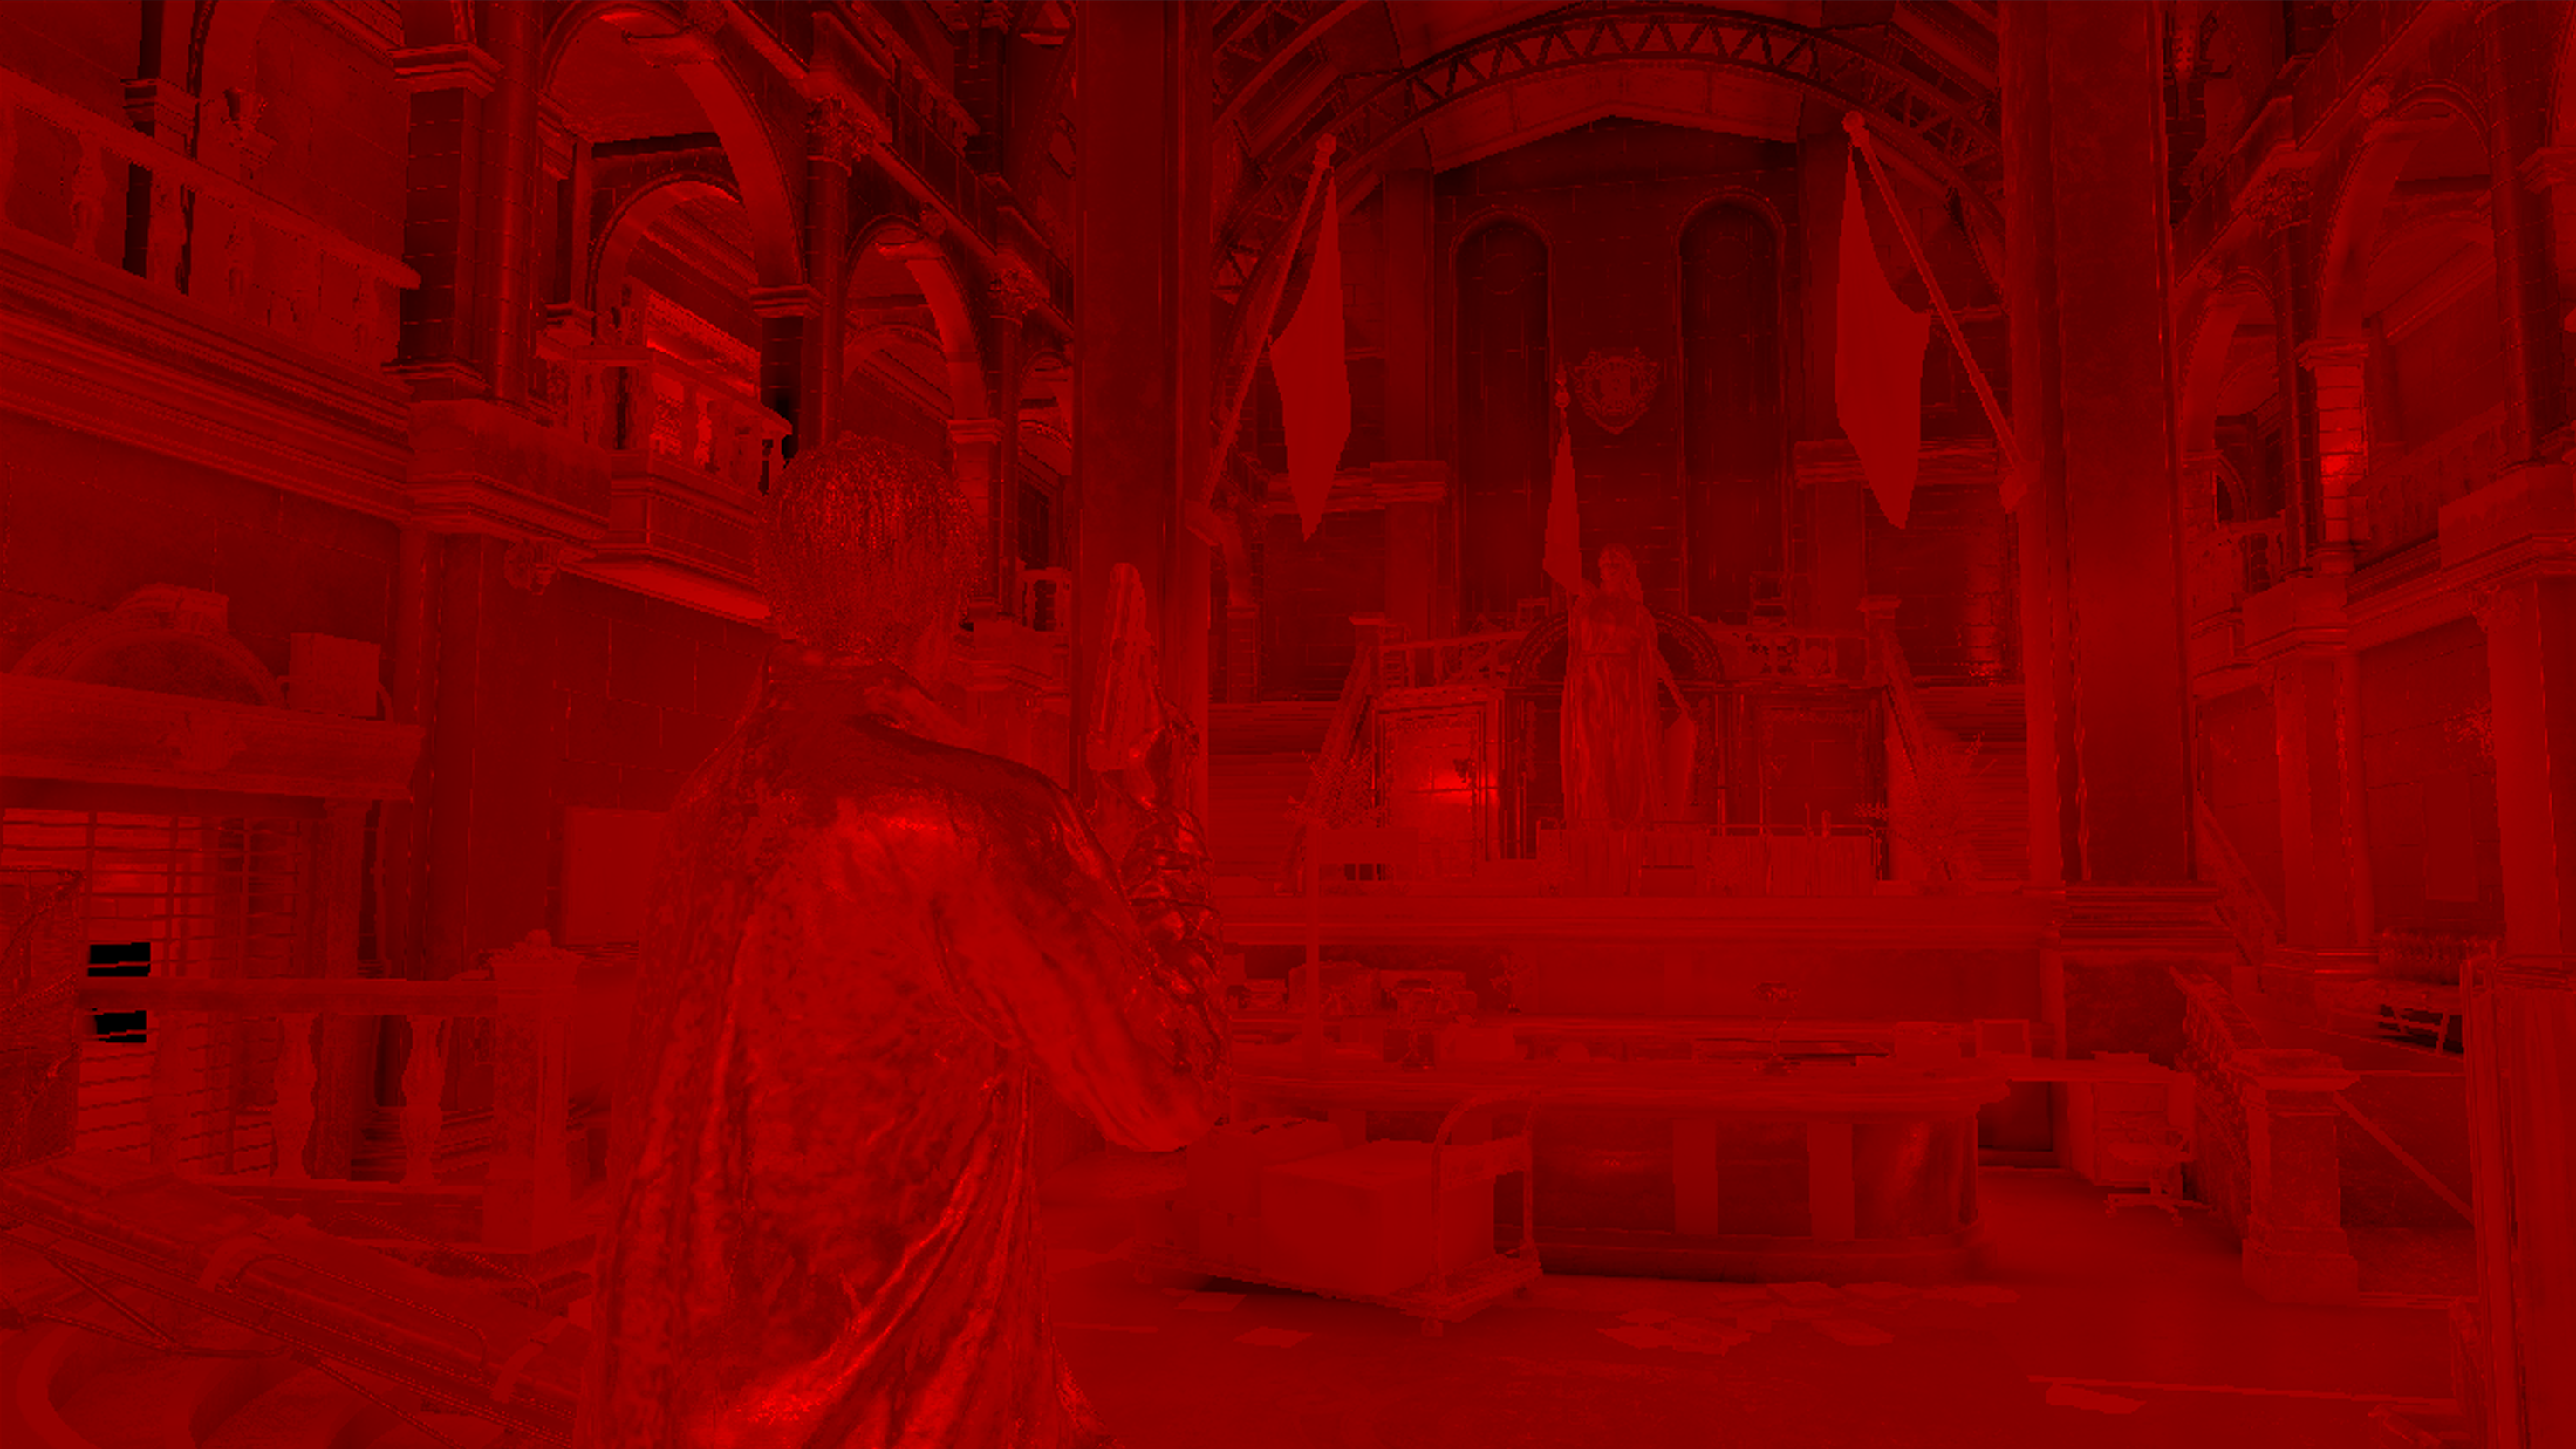
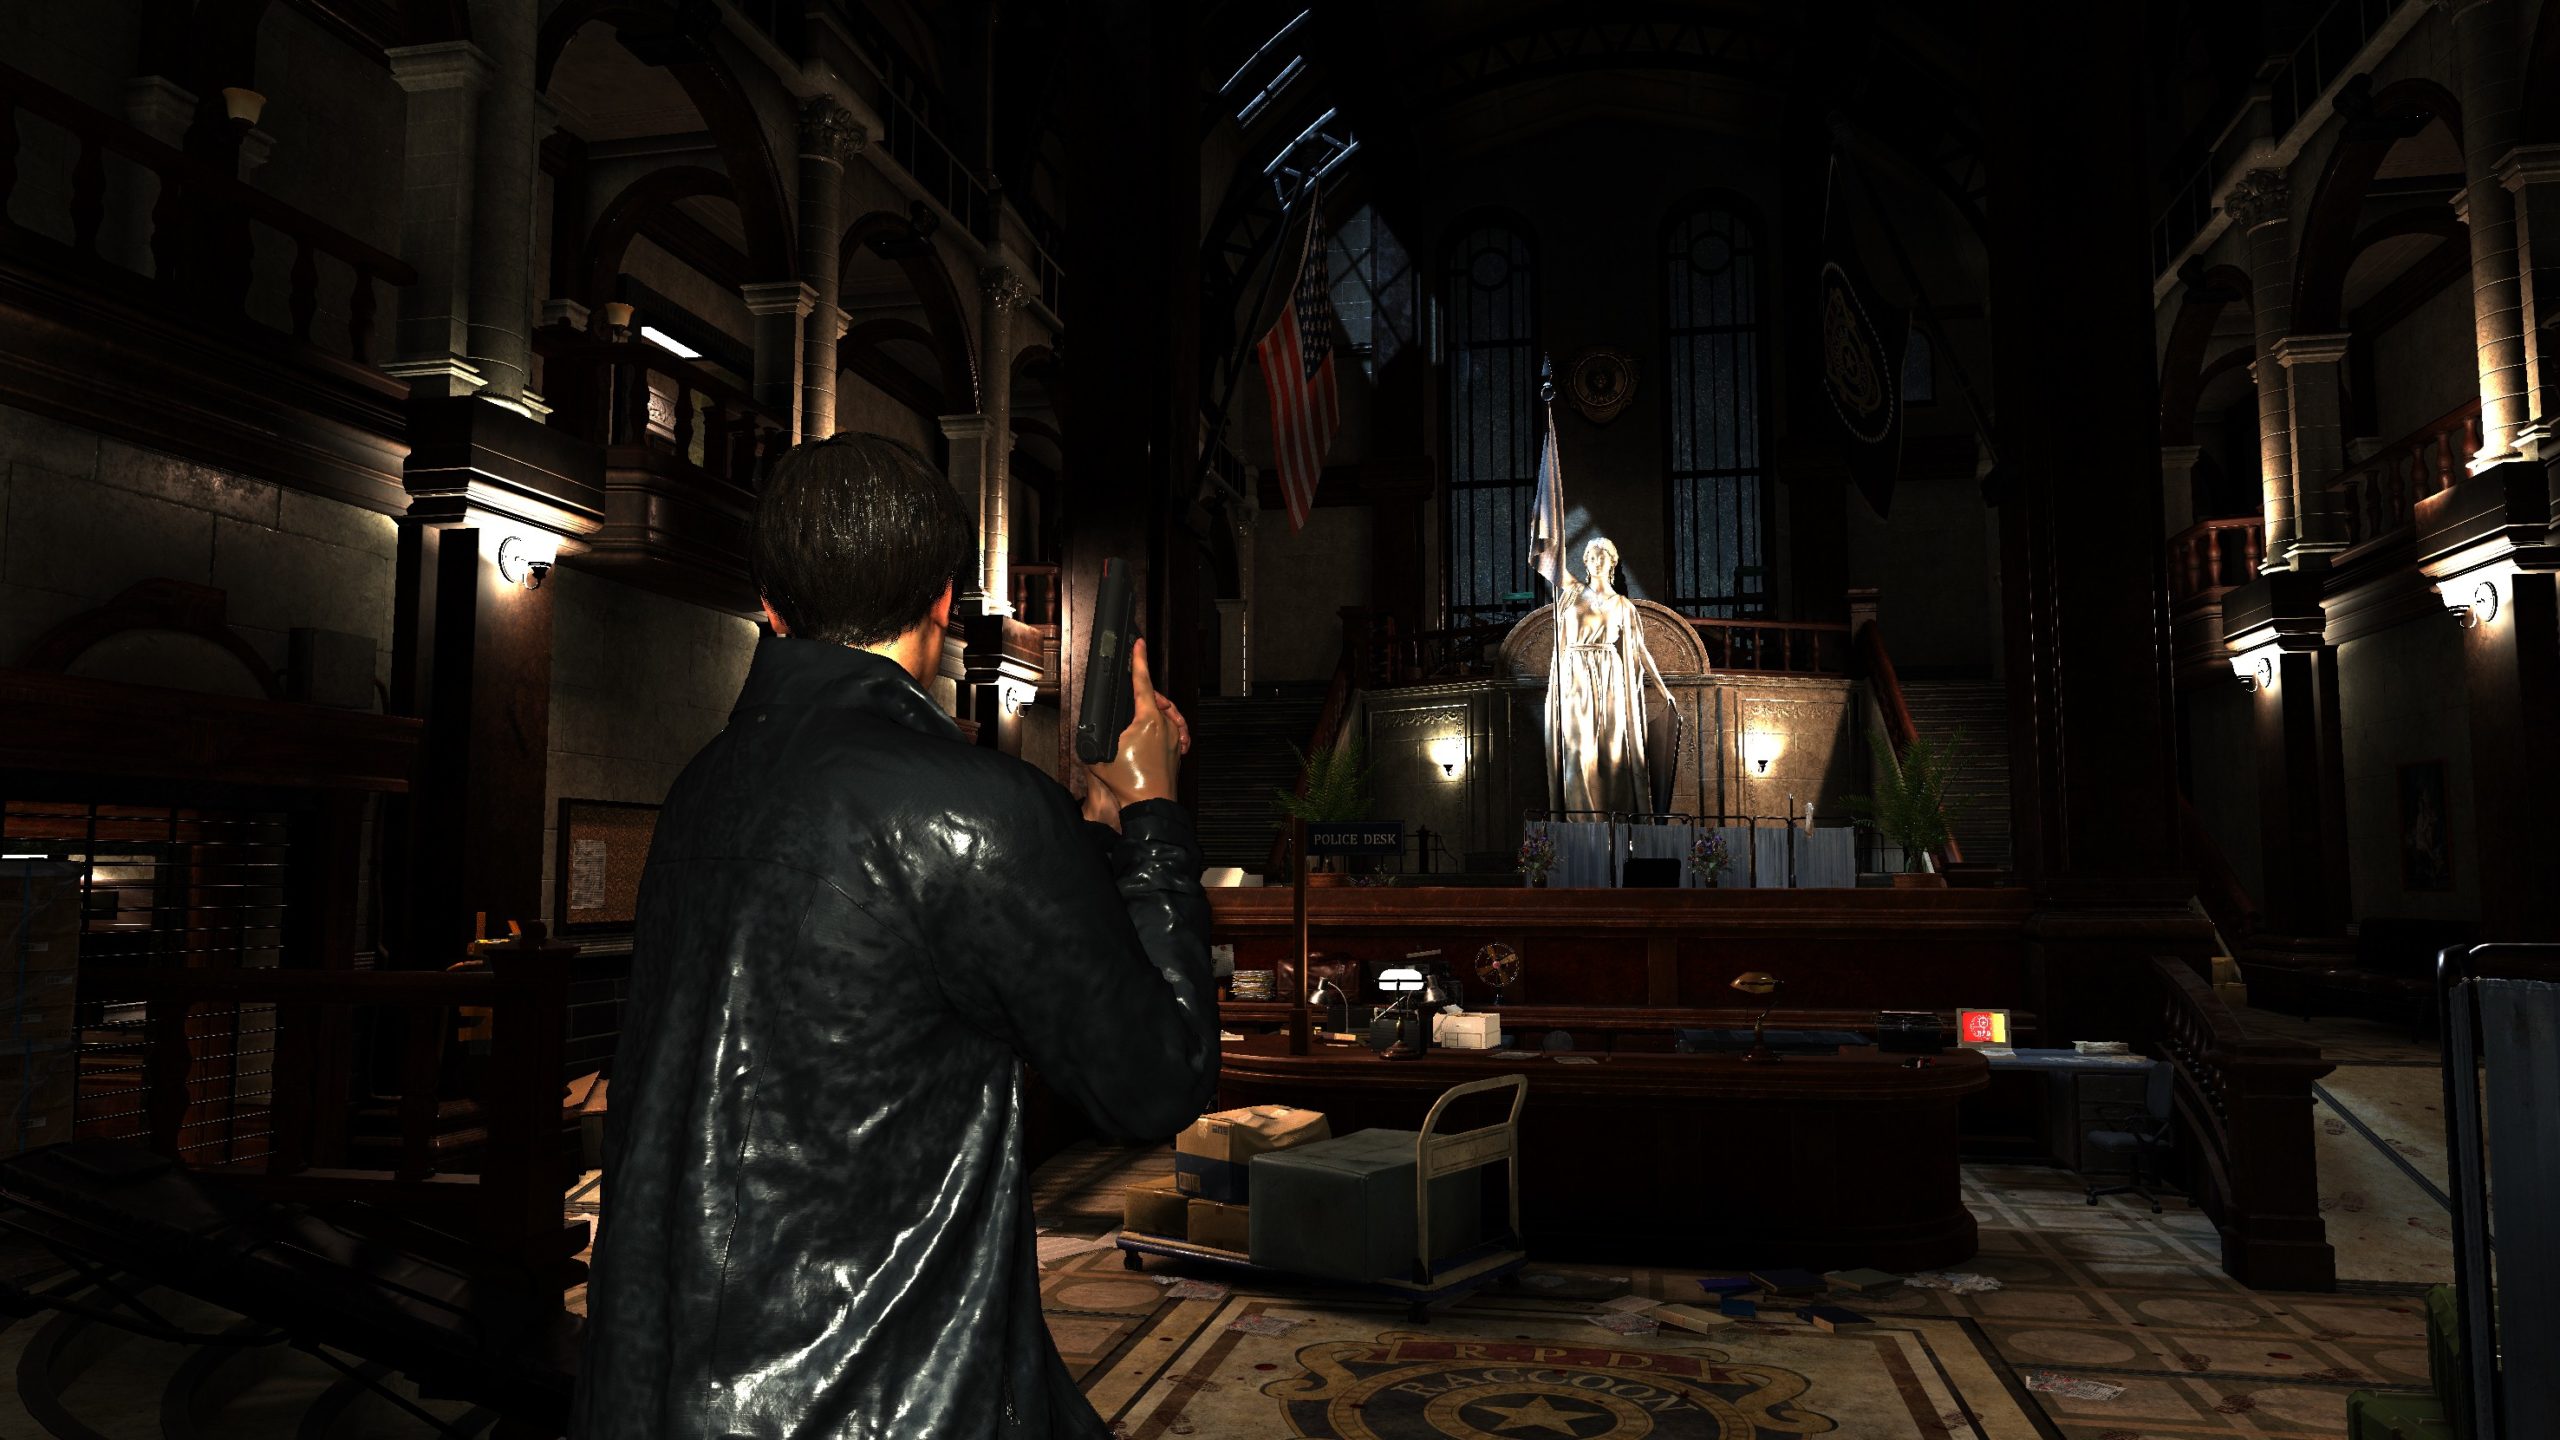
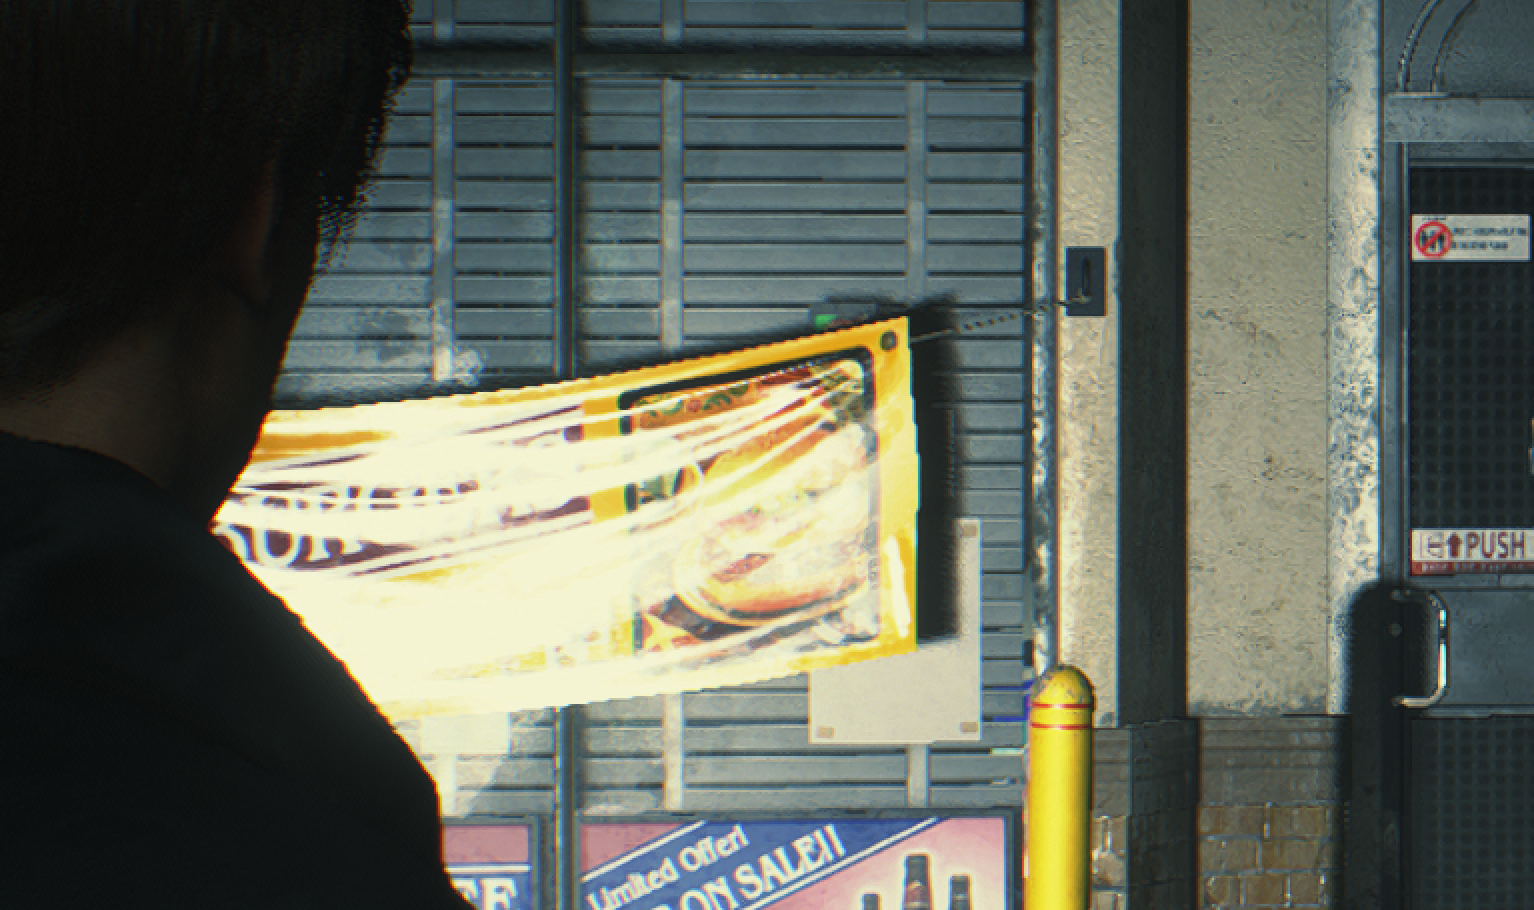
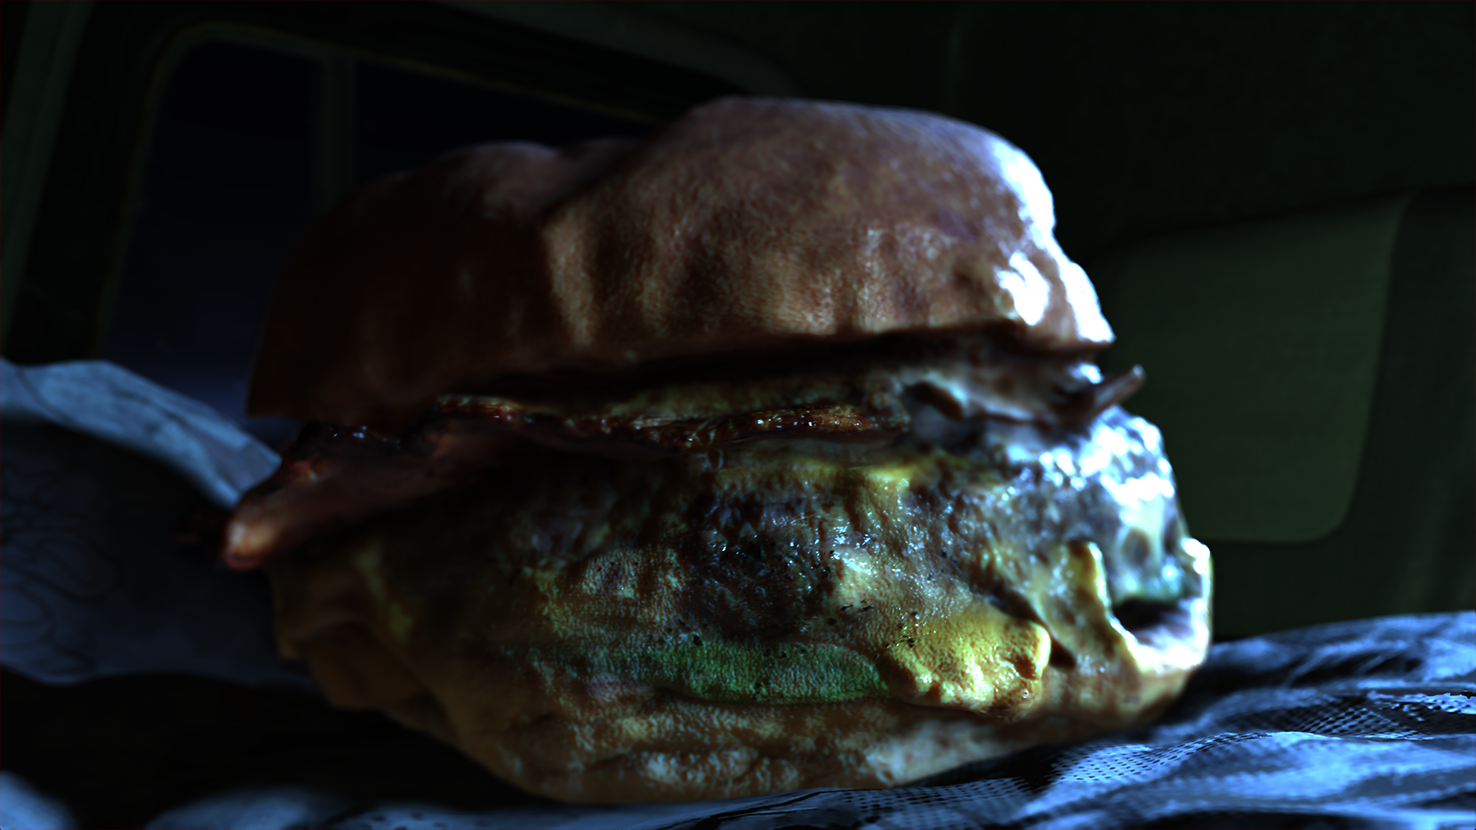
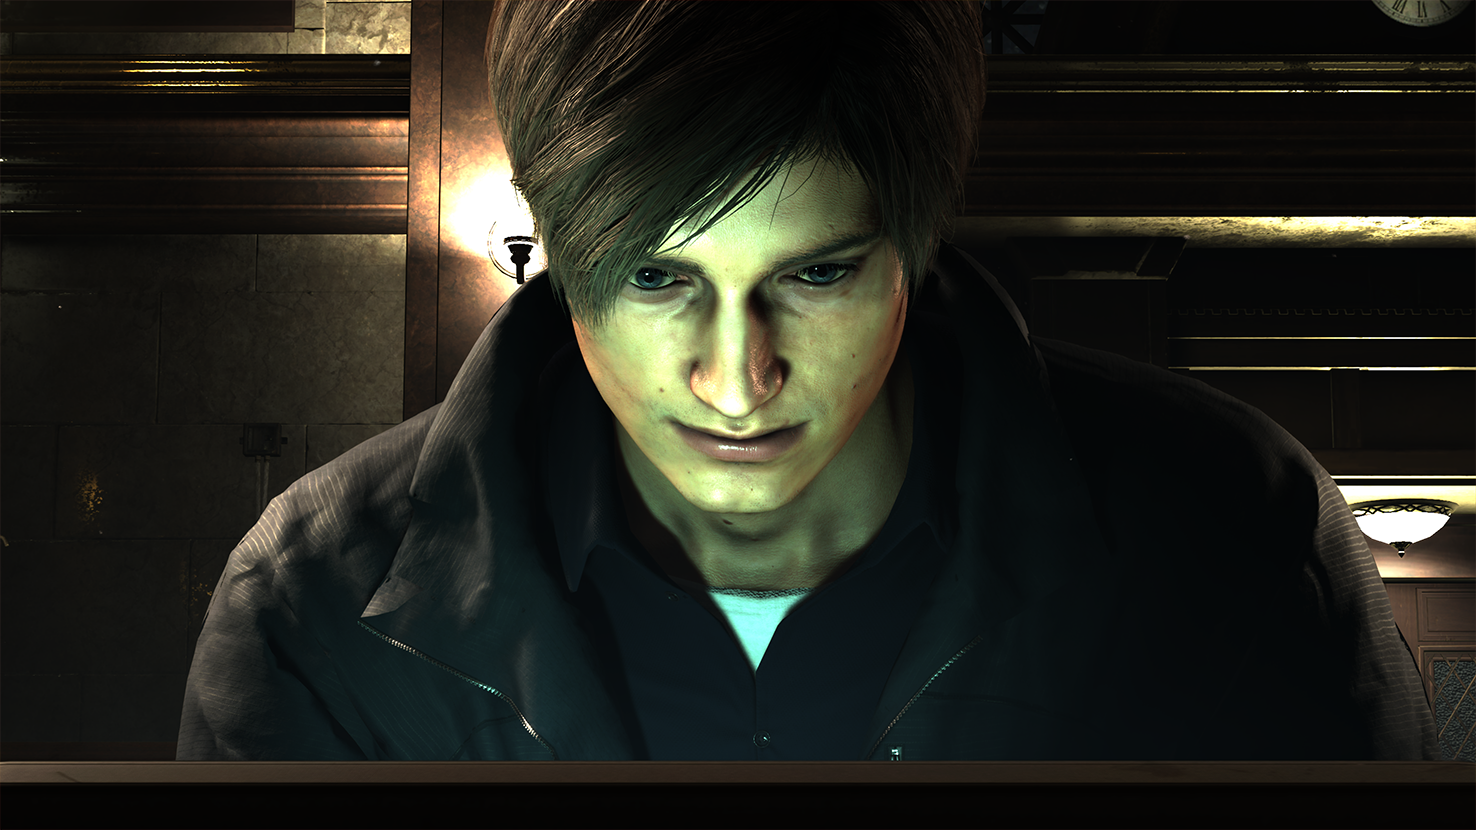
i am leaving some of the article images here for reference, just in case the Japanese site vanished or not opening for someone
Years passed, games released, RE Engine became more known to the public, at least as “name”, but still i did not go further than the Japanese article. Until one day i was browsing twitter, and saw an announcement for a new video from the folks of Digital Foundry about the latest patch for Resident Evil 2 Remake, i went through the video and then back to the tweet replies to go through the interesting comments in there.
And by only watching the video, and going through the replies to that tweet, was enough to put some alcohol on the old hidden wound called “dig more into RE Engine”…and hence, i decided to dig some RE games (mainly RE2, but RE3, RE8 & RE Resistance is a good candidate to do some compares).
As you might’ve noticed that the article name is just “Resident Evil”, and i did not pick a number. This is not a mistake, and it was in purpose. Where the article driving force was to check something in RE2 as mentioned above, but i did get RE3 as well as REVillage alongside, so i can look at all of them at the same time. When i started with RE2 i knew it was D3D11 game, but seem the latest update was not only adding raytracing, but a full D3D12 support, as well as it seem to be “migrating” the entire game to a newer version of the engine. And because of that (and it’s a little no-brainer), when you’ve 3 games using the same engine, all of them from the same company, all of them is the same franchise, and all of them are updated at roughly the same timeframe, this mean one thing, all of them are using the “exact” same technology or more to mean Engine version. There are defiantly some minor difference, but i believe starting RE7 ending up with the latest update for RE2 & RE3, pretty much exact same engine version is used, and there is no wonder if RE7 is patched in the future with a new D3D12 patch. But all in all, i do anticipate a patch someday for REVillage and REResistance someday soon.
Not only that, i do have gut feeling that, the RE4 announcement from capcom during the Summer Game Fest, has a huge contribution in that. If they’re working on the new RE4 for the current gen, with some new features, possibly raytracing and other fancy stuff, so why not migrate the current game (RE2, RE3 & Village) which running on an older fork of the same engine to the RE4 newer version of the engine, and keep all of them in sync, and at the same time test the latest version of the engine in an already released games instead of risking releasing RE4 with a broken engine….it’s just an assumption.
Anyways, you can say, if i’m not bounding myself to a format for the naming of those behind the frames articles, i would have named this one Behind the Pretty Frames: RE Engine.
Totally Not Important Note
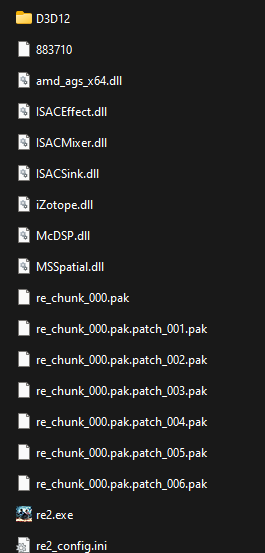
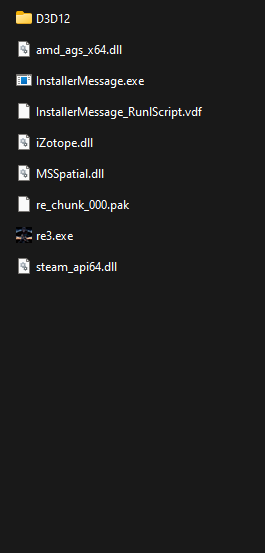
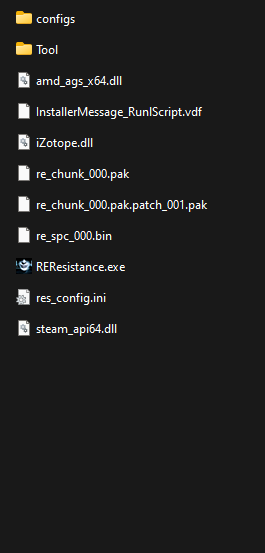
Unfortunately i had to re-purchase RE2 & RE3 on Steam (i had those on PS4 already), but i needed PC versions to do the study, and sadly both versions did not have a demo available for PC. RE Resistance i do already own on steam, but won’t count a lot on it, because i can’t find a stable session easily. At the other hand, for REVillage which i also have (but on Xbox Series X this time) i found it already have a demo available on steam, so i used that steam demo in order to not waste anymore money on re-purchasing games i already own! I’m not a big fan of purchasing the same game more than one time for multiple platforms….unless it is a Max Payne or Rayman Legends, i owned & played both on every platform they shipped for!
Configs
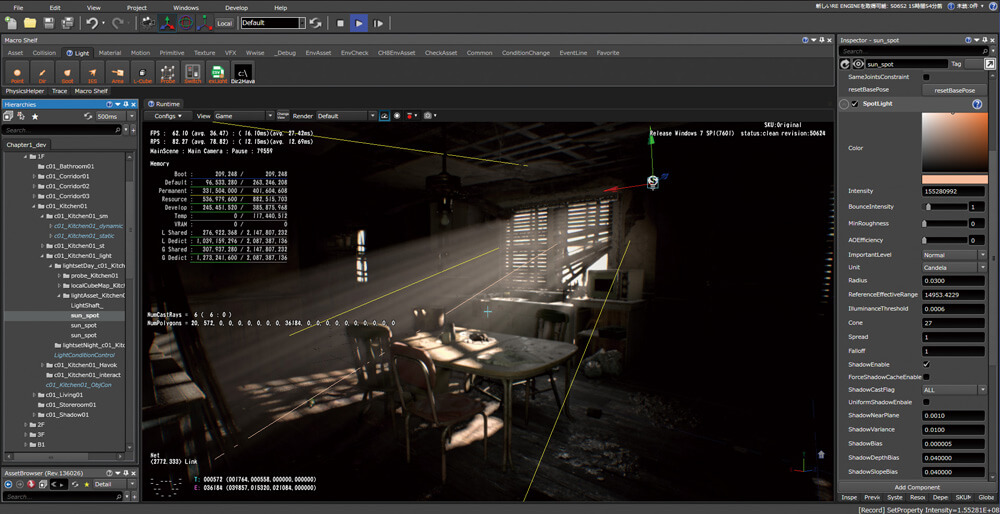
I still captures from only one of my PCs, it is already challenging to capture from multiple games to compare at the same time, and i didn’t want to install all the 4 games and capture from them from 2 PC..that would never end this study! The PC i’m using still the same one from Elden Ring’s study, which is the RTX 3080, Ryzen 5950x and 32G RAM. And the graphics settings is set as the screenshot below
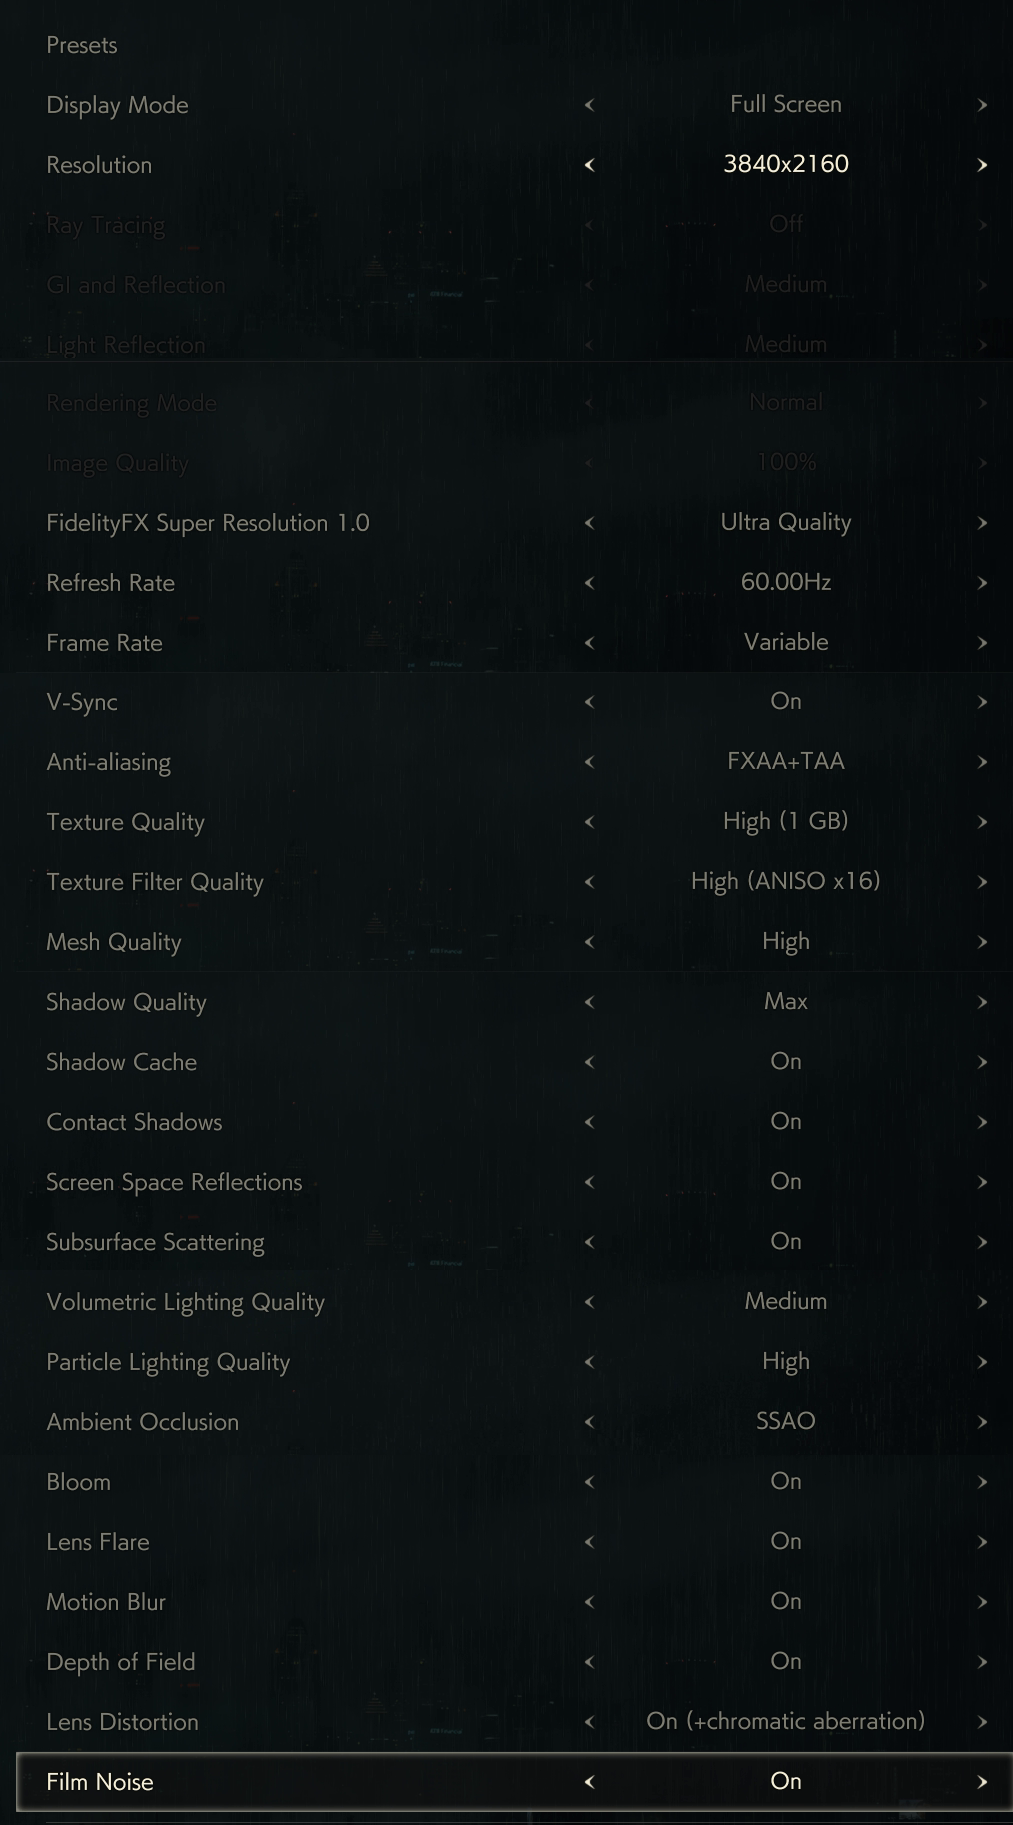
i went with 4k 3840*2160 (UHD-1) not because i love and enjoy big resolutions, but because the game defaulted to it initially and i found it a good idea to test upscaling features (FSR or Interlaced). Also as you might notice that the Raytracing is disabled, but those settings in the screenshot is for the general frame study in default (most common) configs. Unfortunately when raytracing is enabled, capturing from GPU fails. So there won’t be much details about Ray Tracing yet. Later on in the article, there are dedicated sections to discuss things that are using slightly different graphics settings. So if there is any change made in the configs, it will be mentioned at it’s dedicated section of the article. Otherwise, everything was captured with the settings in the previous image.
Resolution Note
Because we’re on 4K and upscaling, so you don’t expect to see the native final resolution everywhere. There is “multiple” Render resolutions, but there is single Output Resolution. So there will be variations along the frame’s lifetime, where the 4k is mostly the final delivery, but most of the time, render targets are in one of those two resolutions:
2953 * 1661 – GBuffer, Velocity,…etc.
1476 * 830 – DOF, SSR, Bloom,…etc.
and of course:
3840 * 2160 – Final output
Still on my old habit, i do take multiple captures for multiple areas to cover, figure out and understand topics better, as one capture could hold more clear insight about something than another capture. Also i do take multiple of captures for the same capture as the same area/view, just in case.
There are gameplay as well as Cinematic captures, and as you might’ve noticed from earlier articles, that i’ll be more biased to refer to the captures from the cinematic sequences rather than captures from actual gameplay most of the time, not for anything but because game engines usually push the bar during runtime cinematics. Still both are at runtime, and both at the same engine, and both are using and having pretty similar render queues.
All captures are taken from the Build ID 8814181 which was released mid-late June 2022 (around the DF video). Thankfully i wanted to store captures before the game get any patches or updates, so i found a magical steam option that will delay any auto-updates until i launch the game (sadly there is not option to disable auto-updates), so i decided to enable that for the game, so at least when it updates i get a heads up, so i know the captures are from different config. BUT, i then decided to take as many captures as i want to cover as many things as i wish, and can’t tell you how glad i’m for doing that. Because by 5th of July when i tried to launch the game to take a small capture, i found it popping to me that it need to install an update first!


Hooray!!! +1 more good decision in life!!
Behind the Frame
D3D12
At the far opposite from the last D3D12 game i did dig, RE seem to well utilize the API. Starting from hardware raytracing, to using a lot of compute, intention to use shading rates, indirect drawing (while indirect draw isn’t exclusive D3D12, but game like Elden Ring for example didn’t use!), AMD FidelityFX multiple features, bindless,… and many more D3D12 specific API commands that are not commonly used (at least in the past few games i’ve checking, including Elden Ring) .
And a heads-up, all shaders are compiled under SM6.0 .
Compute
Just a heads up, apart form compute being utilized among the frame draws, for post processing and some effects (check Draw section), compute is heavily utilized in many many other areas that is preparing for the frame or just contributing from behind the scenes without any direct draws. i love compute, and i love when i see game/engine is heavily utilizing that. So, i guess it’s the time, to use that meme from the God of War study.

RE Engine, you well deserved my compute meme!
To give you an idea about what compute usage in a typical RE Engine frame (Cinematic or Gameplay, not difference), i’ll leave below just the summary for the utilization in dispatch order. But the details of those usages i prefer to put in the correct order at the Draw Section.
Compute Dispatches Queue (in execution order)
- Fast Clear/Copy
- Skinning
- GPU Particles
- Light Culling
- Histogram Adjustment
- GPU Culling
- Instancing
- SSSSS
- Velocity
- HI-Z Tracing
- Compress Depth Normal
- AO
- Particle Collision
- Indirect Illumination
- SSR
- Deinterlace
- Motion Blur
- DOF
- FSR
- CAS
Frame
Resident Vertex
RE got it’s own share of the vertex descriptions variations. It’s not quite a few, it’s more than that, which is not something i’m big fan of (in general things that can get error prone), but it is what it is. Below are the only ones i was able to spot, there might be others that slipped from me, but those ones are the ones i’ve been seeing for days across all my captures.
Resident Evil’s Vertex Description – Most Meshes (Walls, Cars, Rocks, Buildings,…etc.)
POSITION   R32G32B32_FLOAT           0
NORMAL     R8G8B8A8_SNORM            0
TANGENT    R8G8B8A8_SNORM            4
TEXCOORD   R16G16_FLOAT              0
TEXCOORD   R16G16_FLOAT              0
Resident Evil’s Vertex Description – Skinned Meshes (Heads,…etc.)
POSITION   R32G32B32_FLOAT           0
NORMAL     R8G8B8A8_SNORM            0
TANGENT    R8G8B8A8_SNORM            4
TEXCOORD   R16G16_FLOAT              0
TEXCOORD   R16G16_FLOAT              0
INDEX      R8G8B8A8_UINT             0
INDEX      R8G8B8A8_UINT             4
WEIGHT     R8G8B8A8_UNORM            8
WEIGHT     R8G8B8A8_UNORM            12
Resident Evil’s Vertex Description – Skinned Meshes (Cables, Wires, Bottles,…etc.)
POSITION   R32G32B32_FLOAT           0
NORMAL     R8G8B8A8_SNORM            0
TANGENT    R8G8B8A8_SNORM            4
TEXCOORD   R16G16_FLOAT              0
TEXCOORD   R16G16_FLOAT              0
INDEX      R8G8B8A8_UINT             0
WEIGHT     R8G8B8A8_UNORM            8
WEIGHT     R8G8B8A8_UNORM            12
Resident Evil’s Vertex Description – Skinned Meshes (Hair, Eyelashes,…etc.)
POSITION   R32G32B32_FLOAT           0
NORMAL     R8G8B8A8_SNORM            0
TANGENT    R8G8B8A8_SNORM            4
TEXCOORD   R16G16_FLOAT              0
TEXCOORD   R16G16_FLOAT              0
INDEX      R8G8B8A8_UINT             0
WEIGHT     R8G8B8A8_UNORM            8
Resident Evil’s Vertex Description – Skinned Meshes (Banners,…etc.)
POSITION   R32G32B32_FLOAT           0
NORMAL     R8G8B8A8_SNORM            0
TEXCOORD   R16G16_FLOAT              0
INDEX      R8G8B8A8_UINT             0
WEIGHT     R8G8B8A8_UNORM            8
Resident Evil’s Vertex Description – Characters/GPU-Skinned (Eyes, Hands, Shoes, Pants, Jacket, Shirt, Shirt Buttons,…etc.)
POSITION   R32G32B32_FLOAT           0
POSITION   R32G32B32_FLOAT           0
NORMAL     R8G8B8A8_SNORM            0
TANGENT    R8G8B8A8_SNORM            4
TEXCOORD   R16G16_FLOAT              0
TEXCOORD   R16G16_FLOAT              0
Resident Evil’s Vertex Description – Volumes (Screen Quad, Cube volumes, Decals Projector, Triggers/Hit Boxes,…etc.)
POSITION R32G32B32_FLOAT 0
Copy & Clear
This is similar architecture to what been discussed earlier at Elden Ring article, except here it doesn’t occupy much of the frame time & and it issues much less commands. With maximum of around 3.5k of total commands of CopyDescriptorsSimpl, CreateUnorderedAccessView and CreateConstantBufferView to prepare.

Fast Clear/opy [Compute]
An early compute pass with a handful amount of dispatches that is doing copy & clear from a StructuredBuffer to RWStructuredBuffer… From a D3D12_RESOURCE_STATE_GENERIC_READ to a D3D12_RESOURCE_STATE_UNORDERED_ACCESS. The cool thing here that during all dispatches of the fast copy, the source is always the same buffer, but the target differs, that buffer (with it’s ID/Index) i can see it used pretty much everywhere across the frame, as if it is used as main buffer to keep all data needed between frames, and then the data copied over when needed (like now at the start of a new frame).
The size of that big boy storing everything is [8388608] integer elements (*4 per int = 33554432 = 33.5mb buffer)…just saying…
This is not the only “Fast Copy” compute pass across a RE frame, there are quite a few here & there, i won’t bother mentioning them, only wanted to mention that one, because it is the 1st one of that pass type, and because it is the longest one of them and the most “impactful” one.
Skinning [Compute]
GPU skinning in the compute is not something new, and been known for quite sometime. But despite that simple fact, we still don’t see it utilized heavily in games (i’m talking more of course about the AAA space, where performance vs “realism” quality is always a fight). It is an amazing surprise for me to find that RE Engine is doing that. i can’t even remember what was the last game i dig that used such a technique. The technique is simple and straightforward, but it is very very beneficial at many aspects (well, not every aspect). i won’t go in details about what are the advantages of this technique, but i would recommend checking the article written by János of Wicked Engine quite sometime ago about the implementation of similar technique in Wicked Engine.
This compute pass starts with a copy of buffers, i believe it’s the data from previous frame, so it can be utilized with current frame to (shortly after that pass) calculate velocities that will be needed later for many things such as post processors like TAA or Motion Blur.
With a good large list of buffers (Skinning Matrices, Instance World Info, Bindless Redirect Table, Input Byte Buffer, Weight List) the compute takes the params below to kick in the job (the buffers used vary based on the active sub-step of the skinning pass step).
CB CS Skinning
struct cbCSSkinning
{
	uint cVertexCount;
	uint cUVCount;
	uint cbCSSkinningReserved;
	uint cVertexPositionByteOffset;
	uint cVertexNormalByteOffset;
	uint cVertexTexcoordByteOffset;
	uint cVertexTexcoord2ByteOffset;
	uint cVertexSkinWeightByteOffset;
	uint cVertexSkinWeight2ByteOffset;
	uint cDstVertexPositionByteOffset;
	uint cDstVertexPrevPositionByteOffset;
	uint cDstVertexNormalByteOffset;
}
CB CS Blend Shape
struct cbCSBlendShape
{
	uint cVertexCount;
	uint cUVCount;
	uint reserved;
	uint cVertexPositionByteOffset;
	uint cVertexNormalByteOffset;
	uint cVertexTexcoordByteOffset;
	uint cVertexTexcoord2ByteOffset;
	uint cVertexSkinWeightByteOffset;
	uint cVertexSkinWeight2ByteOffset;
	uint cDstVertexPositionByteOffset;
	uint cDstVertexPrevPositionByteOffset;
	uint cDstVertexNormalByteOffset;
	uint cChannelVertexCount;
	uint cUsingChannelOffset;
	uint cUsingChannelCount;
	uint cBlendShapeOffset;
	uint3 blendshape_reserved0;
	uint cBlendShapeStride;
	float3 cBlendShapeSubtractOffset;
	uint cTargetUV;
	float3 cBlendShapeSubtractRange;
	uint cChannelIndex;
}
CB CS Calculate Normal
struct cbCSCalculateNormal
{
	uint cTotalVertexCount;
	uint cIndexCount;
	uint cBaseVertexLocaioin;
	uint cVertexCurrentPositionByteOffset;
	uint cSrcIBBaseAddr;
	uint cDstIBBaseAddr;
	uint cDstVertexNormalByteOffsetCluster0;
}
Seems we off to a good start with that engine already!
GPU Particles [Compute]
Right away after GPU skinning (always) the GPU particles simulation updates kicks in. Yet this is only to simulate movement & updates. This is only one type of particles in the game, and yet it’s only sim, no rendering. Rendering this GPU particles (as expected) is happening very late, just right before post processing.
This happens in 3 different phases
– Calculate Node Stretch Billboard
– Single Emit[s]
– SingleUpdate[s]
For the purpose of sim-ing those GPU particles, a good respectful amount of buffers (Constant and UAVs) passed to all the dispatches of that (fairly long) compute pass.
Node Billboard Particles
struct NodeStretchBillboardParticle
{
	float3 position;
	float size;
	float2 rotation;
	float2 scale;
	float4 tangent;
	int color;
	float ratio;
	float birthOffset;
	float velocity;
	float2 texRect;
	int texIndex;
	float texTimer;
	float3 frontDiffuse;
	float texSpeed;
	float4 fogInfluence;
	float3 random;
	int uvsAttribute;
	float3 blendParam;
	int blendColor;
	int2 randomSeed;
	int alive;
	int vanishFrameRemaining;
	int loopsRemaining;
	float reserved0;
	float reserved1;
	float reserved2;
}
Node Billboard Constant
struct NodeBillboardConstant
{
	float4x4 world;
	float4x4 particlePath;
	float4x4 boundingBox;
	uint4 color;
	float2 size;
	float2 rotate;
	float2 rotateAnim;
	float2 scaleAnim;
	float2 birthOffset;
	float2 velocityCoef;
	float2 texDimension;
	float2 texAnimSpeed;
	float2 stretchSize;
	float time;
	float pathDirection;
	float reserved0_NodeBillboardConstant;
	uint attribute;
	uint patternNum;
	uint uvSequenceAttribute;
	uint4 blendColor;
	float3x4 blendParam;
	uint2 loopCountRange;
	uint particleNum;
	uint vanishFrame;
	float lightShadowRatio;
	float backfaceLightRatio;
	float directionalLightShadowRatio;
	float reserved1_NodeBillboardConstant;
}
Emitter Instances
struct EmitterInstance
{
	int maxParticle;
	int spawnNum;
	int segmentNum;
	int constantBufferSize;
	int2 randSeed;
	float emitterTime;
	int totalSpawnNum;
	int[] propertyOffsets;         //5
	int partsStartNoCounter;
	int particleBinaryHead;
	int propertyStride;
	int particleCount;
	int particleMaxId;
	int preParticleCount;
	int preParticleMaxId;
}
Emitter
struct Emitter
{
	float4x4 cbWMatrix;
	float4x4 cbTransform;
	float3x4 cbInverseEmitWMatrix;
	float2 cbExtension1;
	float2 cbExtension2;
	float2 cbRangeX;
	float2 cbRangeY;
	float2 cbRangeZ;
	uint2 cbRangeDivide;
	float3 cbWorldOffset;
	int cbSpawnNum;
	uint cbFlags;
	float cbDeltaTime;
	float cbLoopFrameTime;
	float cbMaxScale;
	float cbLightShadowRatio;
	float cbBackfaceLightRatio;
	float cbDirectionalLightShadowRatio;
	int cbSpawnHead;
}
Extend Particle Vertex Constant
struct ExtentParticleVertexConstant
{
	uint cbParticleBufferByteOffset;
	uint cbParticleLength;
	uint cbEPVCReserved0;
	uint cbEPVCReserved1;
	uint4 cbExtendHeaders0;
}
That is the particle related stuff, but there are also forces and environment related forces
CB Vortexel Turbulence
struct cbVortexelTurbulence
{
	uint3 cbTurbulenceResolution;
	float cbTurbulenceDelta;
	float3 cbTurbulenceMinPosition;
	float cbTurbulenceSpread;
	float3 cbTurbulenceMaxPosition;
	float cbTurbulenceVoxelSize;
	float3 cbTurbulenceGlobalVelocity;
	float cbTurbulenceSpeedLimit;
	uint cbTurbulenceAccelEmitterNum;
	uint cbTurbulenceOverwriteEmitterNum;
	float cbGenerateGlobalVelocityPressureMin;
	float cbGenerateGlobalVelocityPressureMax;
	float cbOcclusionRateGamma;
	float cbOcclusionRateMin;
	float cbOcclusionRateMax;
	uint cbTurbulenceVelocityEmitterNumMax;
	int3 cbTurbulenceOffset;
	uint cbTurbulenceReseved0;
}
Vector Field
struct VectorField
{
	float cbLacunarity;
	float cbFrequency;
	float cbAmplitude;
	float cbGain;
	float cbLFO;
	float cbBlend;
	float cbTexelSize;
	float cbVectorFieldScale;
	float cbVectorFieldFlags;
	float cbVectorFieldRotation;
	float cbVectorFieldCoef;
	float cbEdgeOffset;
	float cbGlobalLocalFlag;
	float cbTargetCount;
	float cbLocalToGlobalBlend;
	float cbGlobalVelocityBlend;
	float cbVectorFieldFalloff;
	float cbPerGlobal;
	float cbVectorFieldSmoothBlend;
	float cbVectorFieldReserved0;
	float cbVectorFieldReserved1;
	float cbVectorFieldReserved2;
}
Global Vector Field Data
struct GlobalVectorFieldData
{
	float4 cbGlobalVFScale;
	float4 cbGlobalVFRotation;
	float4 cbGlobalVFTranslation;
	float cbGlobalVFFrequency;
	float cbGlobalVFGain;
	float cbGlobalVFSize;
	float cbGlobalVFEdgeOffset;
	float cbGlobalVFRate;
	uint cbGlobalVFIdleTime;
	uint cbGlobalVFIdleTimeRange;
	float cbGlobalFalloff;
}
Global Vector Field
struct GlobalVectorFieldData
{
	GlobalVectorFieldData[] GlobalVectorFieldData;     //6 elements usually
}
Field Attribute
struct FieldAttribute
{
	float4x4 localMatrix;
	float3 localPosition;
	float flags;
	float3 localVectorField;
	float reserved0;
	float3 globalVectorField;
	float globalVectorFieldRate;
	float4 lastVectorFieldVelocity;
	float4[] lastGlobalVectorFieldVelocity;    //6
	float[] globalVectorFieldInfluenceFrame;   //6
	float reserved1;
	float reserved2;
}
And of course there are some 3d textures used for the Particle Flow, Velocity map, and Global Vector Field values (can say it’s a representation of a 3d volume in the 3d world).
Particle Flow 3DTexture – 64*64*64 – BC1_UNORM
Among other UAVs such as ParticleStructures, ParticleProperties, GPUParticleBuffer, which i was not able to fetch further info about.
Light Culling [Compute]
RE Engine is based on a “Clustered Deferred” rendering system in order to server the level design requirements and the “Metroidvania” play style of keep going back and forth between the rooms. And hence, light culling became important to the developers, which can only be made possible through “Clustered”. Not only that, but also adopting such a system will keep the quality bar high & consistent across all the platforms (previous gen & current gen), while allowing the game to run on stable (and good) framerate on things such as PSVR.
Light Info
struct LightInfo
{
	uint PunctualLightCount;
	uint AreaLightCount;
	uint PunctualLightFowardCount;
	uint AreaLightFowardCount;
	float2 LightCullingScreenSize;
	float2 InverseLightCullingScreenSize;
	float LightCullingOffsetScale;
	uint RT_PunctualLightCount;
	uint RT_AreaLightCount;
	uint CubemapArrayCount;
	float3 DL_Direction;
	uint DL_Enable;
	float3 DL_Color;
	float DL_MinAlpha;
	float3 DL_VolumetricScatteringColor;
	uint DL_Reserved;
	float4x4 DL_ViewProjection;
	float DL_Variance;
	uint DL_ArrayIndex;
	uint DL_TranslucentArrayIndex;
	float DL_Bias;
	float3 Cascade_Translate1;
	float Cascade_Bias1;
	float3 Cascade_Translate2;
	float Cascade_Bias2;
	float3 Cascade_Translate3;
	float Cascade_Bias3;
	float2 Cascade_Scale1;
	float2 Cascade_Scale2;
	float2 Cascade_Scale3;
	uint SDSMEnable;
	uint SDSMDebugDraw;
	float4 CascadeDistance;
	float3 Atmopshere_Reserved;
	uint Atmopshere_Flags;
	uint lightProbeOffset;
	uint sparseLightProbeAreaNum;
	uint tetNumMinus1;
	uint sparseTetNumMinus1;
	float smoothStepRateMinus;
	float smoothStepRateRcp;
	float _LightProbeReserve1;
	float _LightProbeReserve2;
	float3 AOTint;
	float _AOReserve1;
	float3 LightProbe_WorldOffset;
	float LightProbe_Reserved;
}
Light Parameter SRV
struct LightParameterSRV
{
	float3 position;
	float boundingRadius;
	float3 direction;
	float falloff;
	float4 attenuation;
	float3 color;
	float tolerance;
	int shadowIndex;
	int iesId;
	int2 reserved;
}
Light Frustum UAV
struct FPlanes
{
	float[] planes;    //6
}
Light Culling Param SRV
struct LightCullingParam
{
	FPlanes planes;
	int roid;
	int[] reserved;    //3
}
Scene Info
struct SceneInfo
{
	float4x4 viewProjMat;
	float3x4 transposeViewMat;
	float3x4 transposeViewInvMat;
	float4[] projElement;
	float4[] projInvElements;
	float4x4 viewProjInvMat;
	float4x4 prevViewProjMat;
	float3 ZToLinear
	float subdivisionLevel;
	float2 screenSize;
	float2 screenInverseSize;
	float2 cullingHelper;
	float cameraNearPlane;
	float cameraFarPlane;
	float4[] viewFrustum;          //6 areas
	float4 clipplane;
	float2 vrsVelocityThreshold;
	uint renderOutputId;
	uint SceneInfo_Reserve;
}
That struct is of course passed a lot across the frame lifetime to all sorts of shaders & stages, not only in light culling, but 1st appearance was here i believe in that compute pass.
That’s not only everything, there are also buffers that were hard to fetch anything beyond their names, such as LightSphereSRV, LightCullingListUAV, LightCullingListCountUAV.
The final output of that compute pass is stored for later use, it is stored in a light culling volume (UAV) 3DTexture that is 32*80 with a 32 slices of the format R32_UINT. Below how it looks in atlas view (8 slices per row, total 4 rows each 80 pixels h) or animated view.


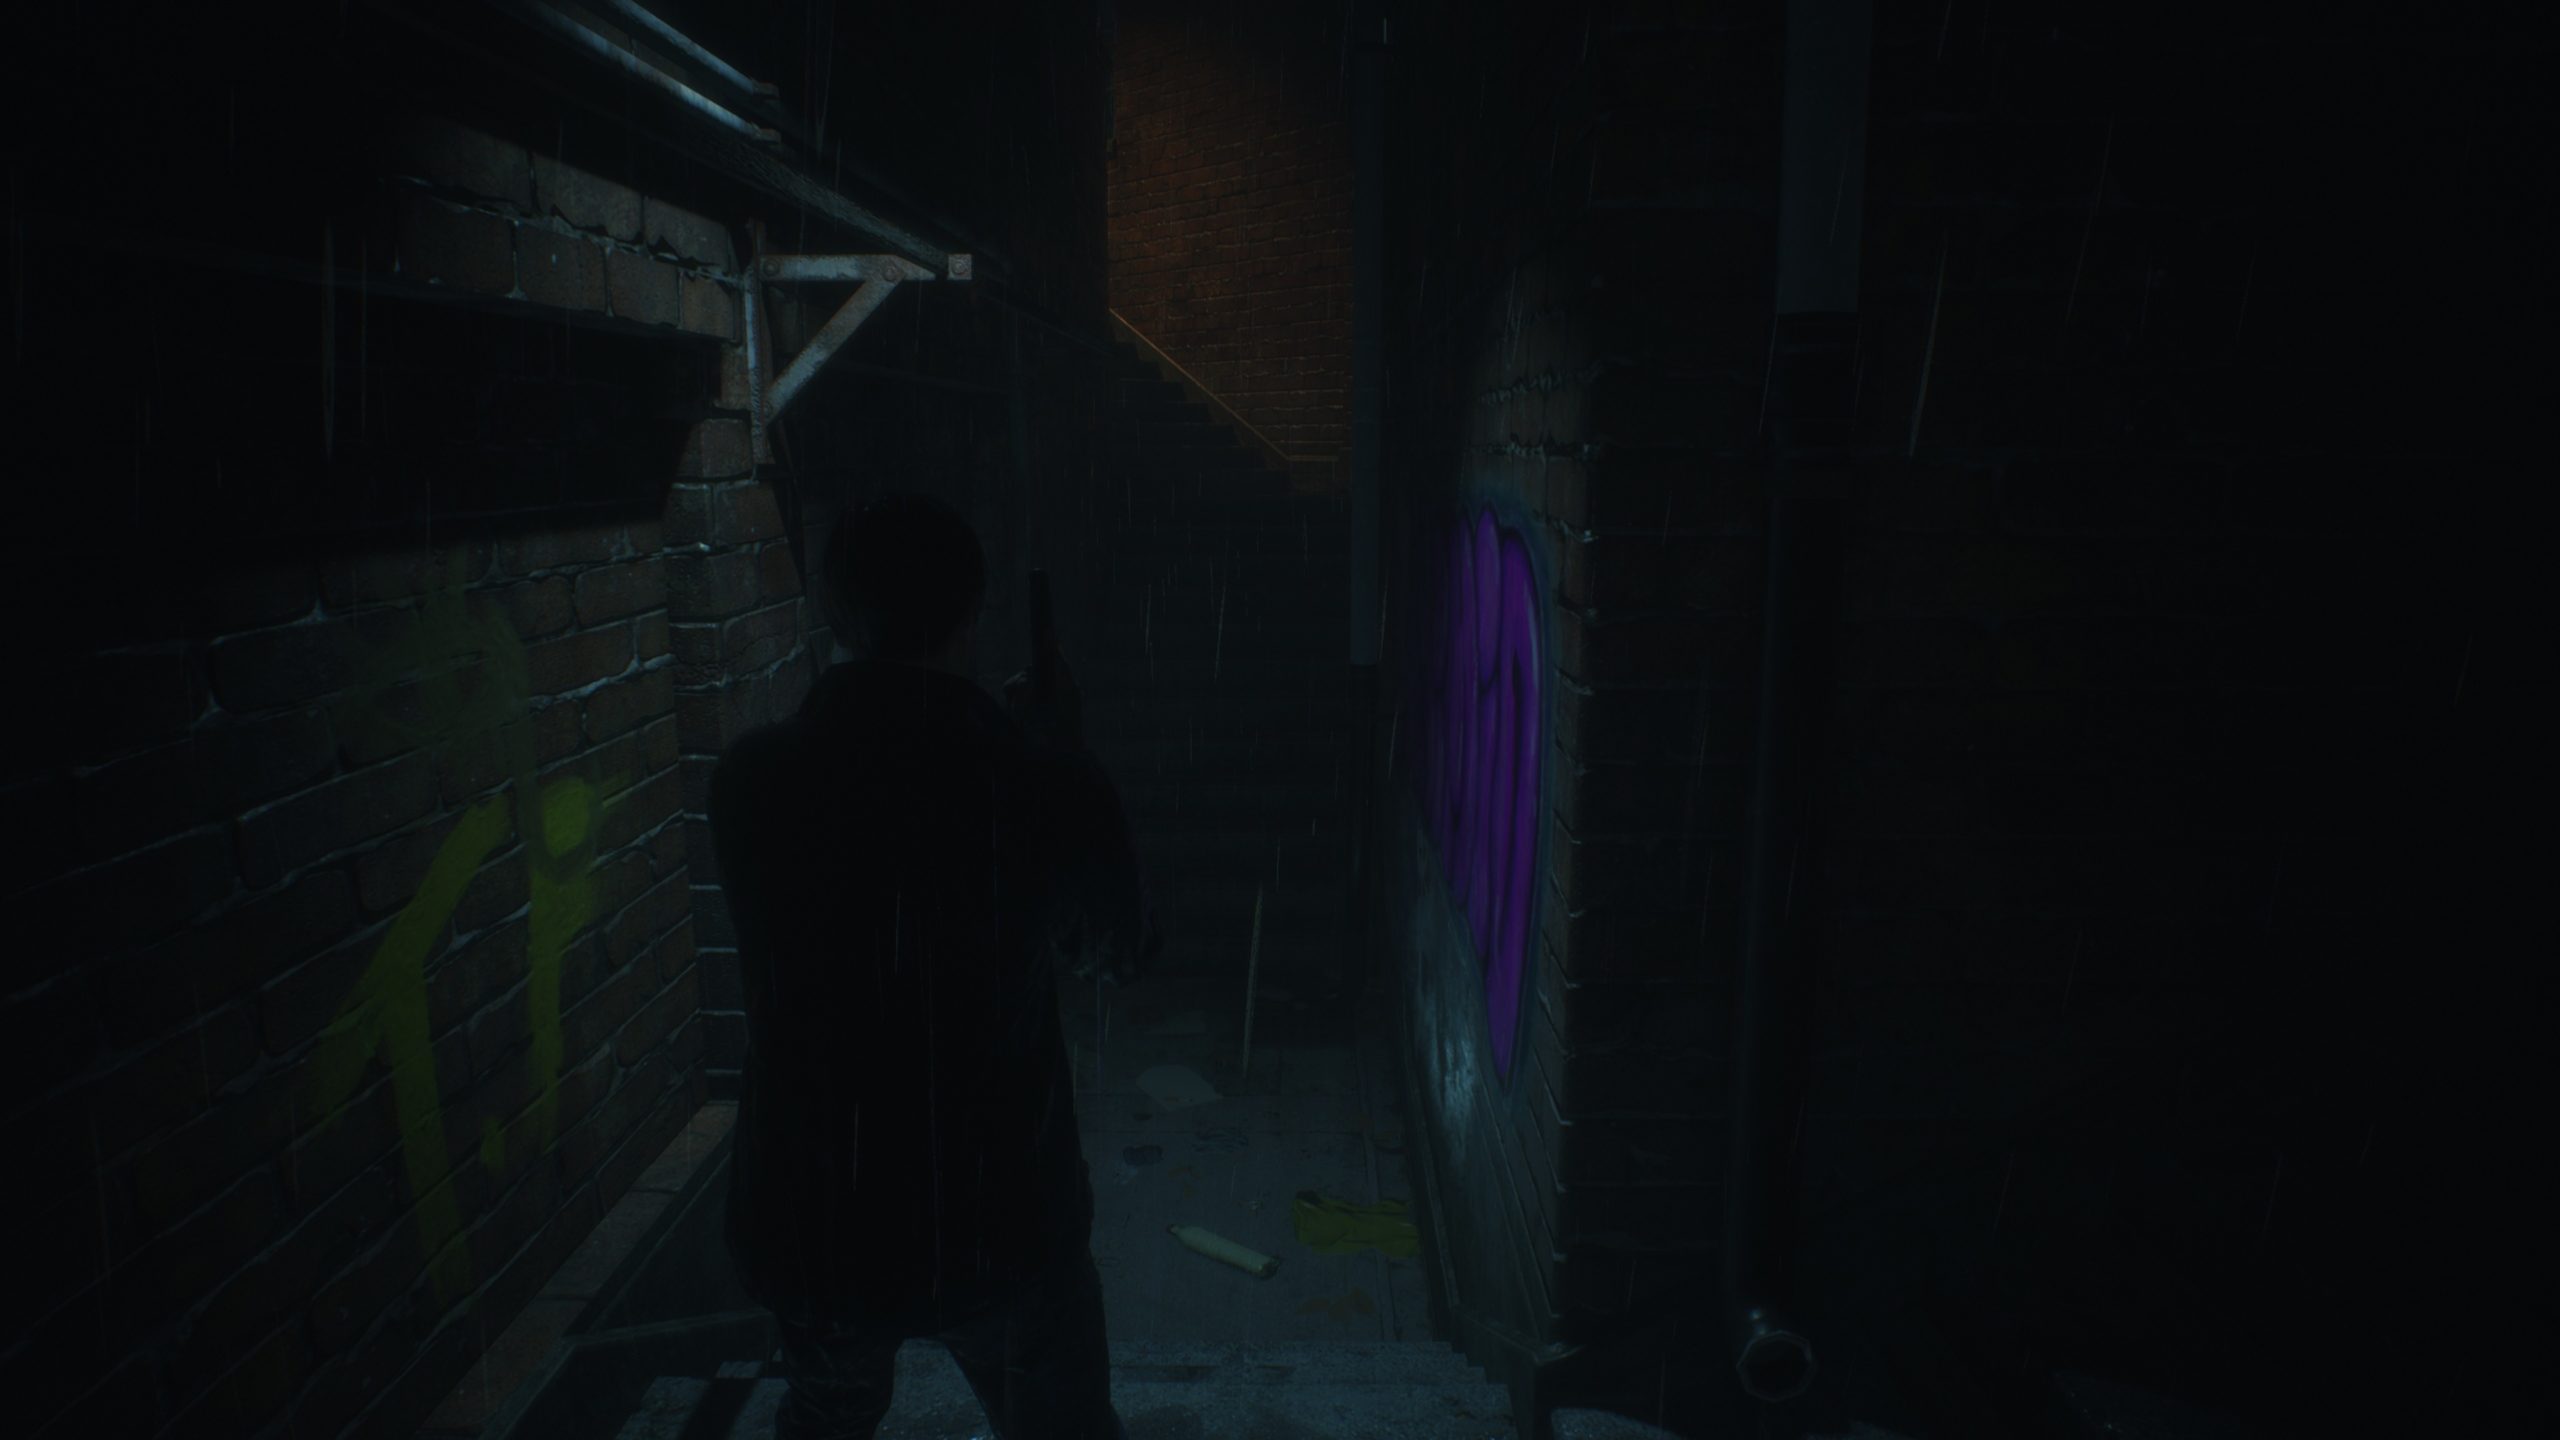
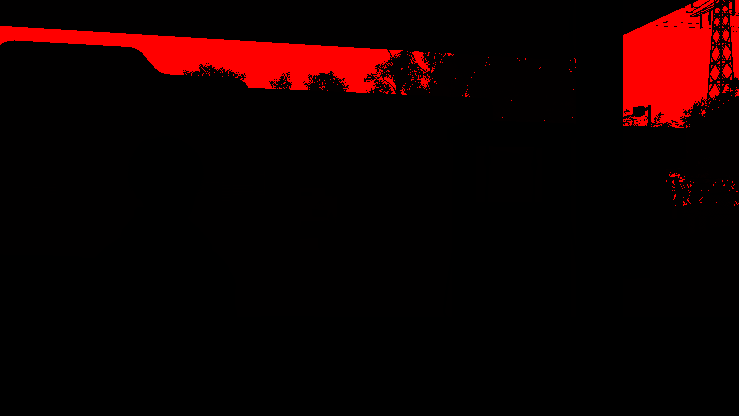
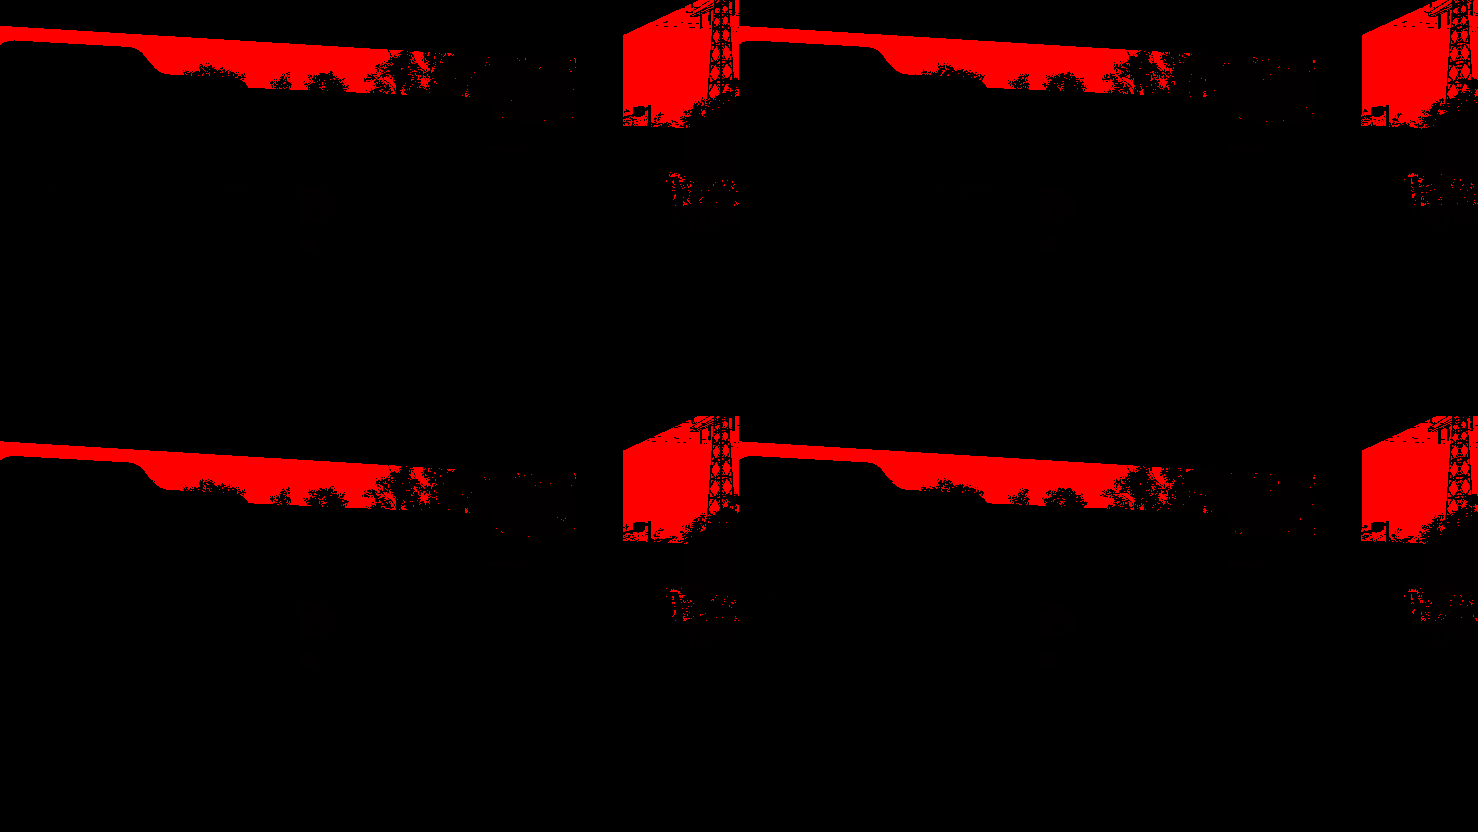
Histogram Adjustment [Compute] [Not always]
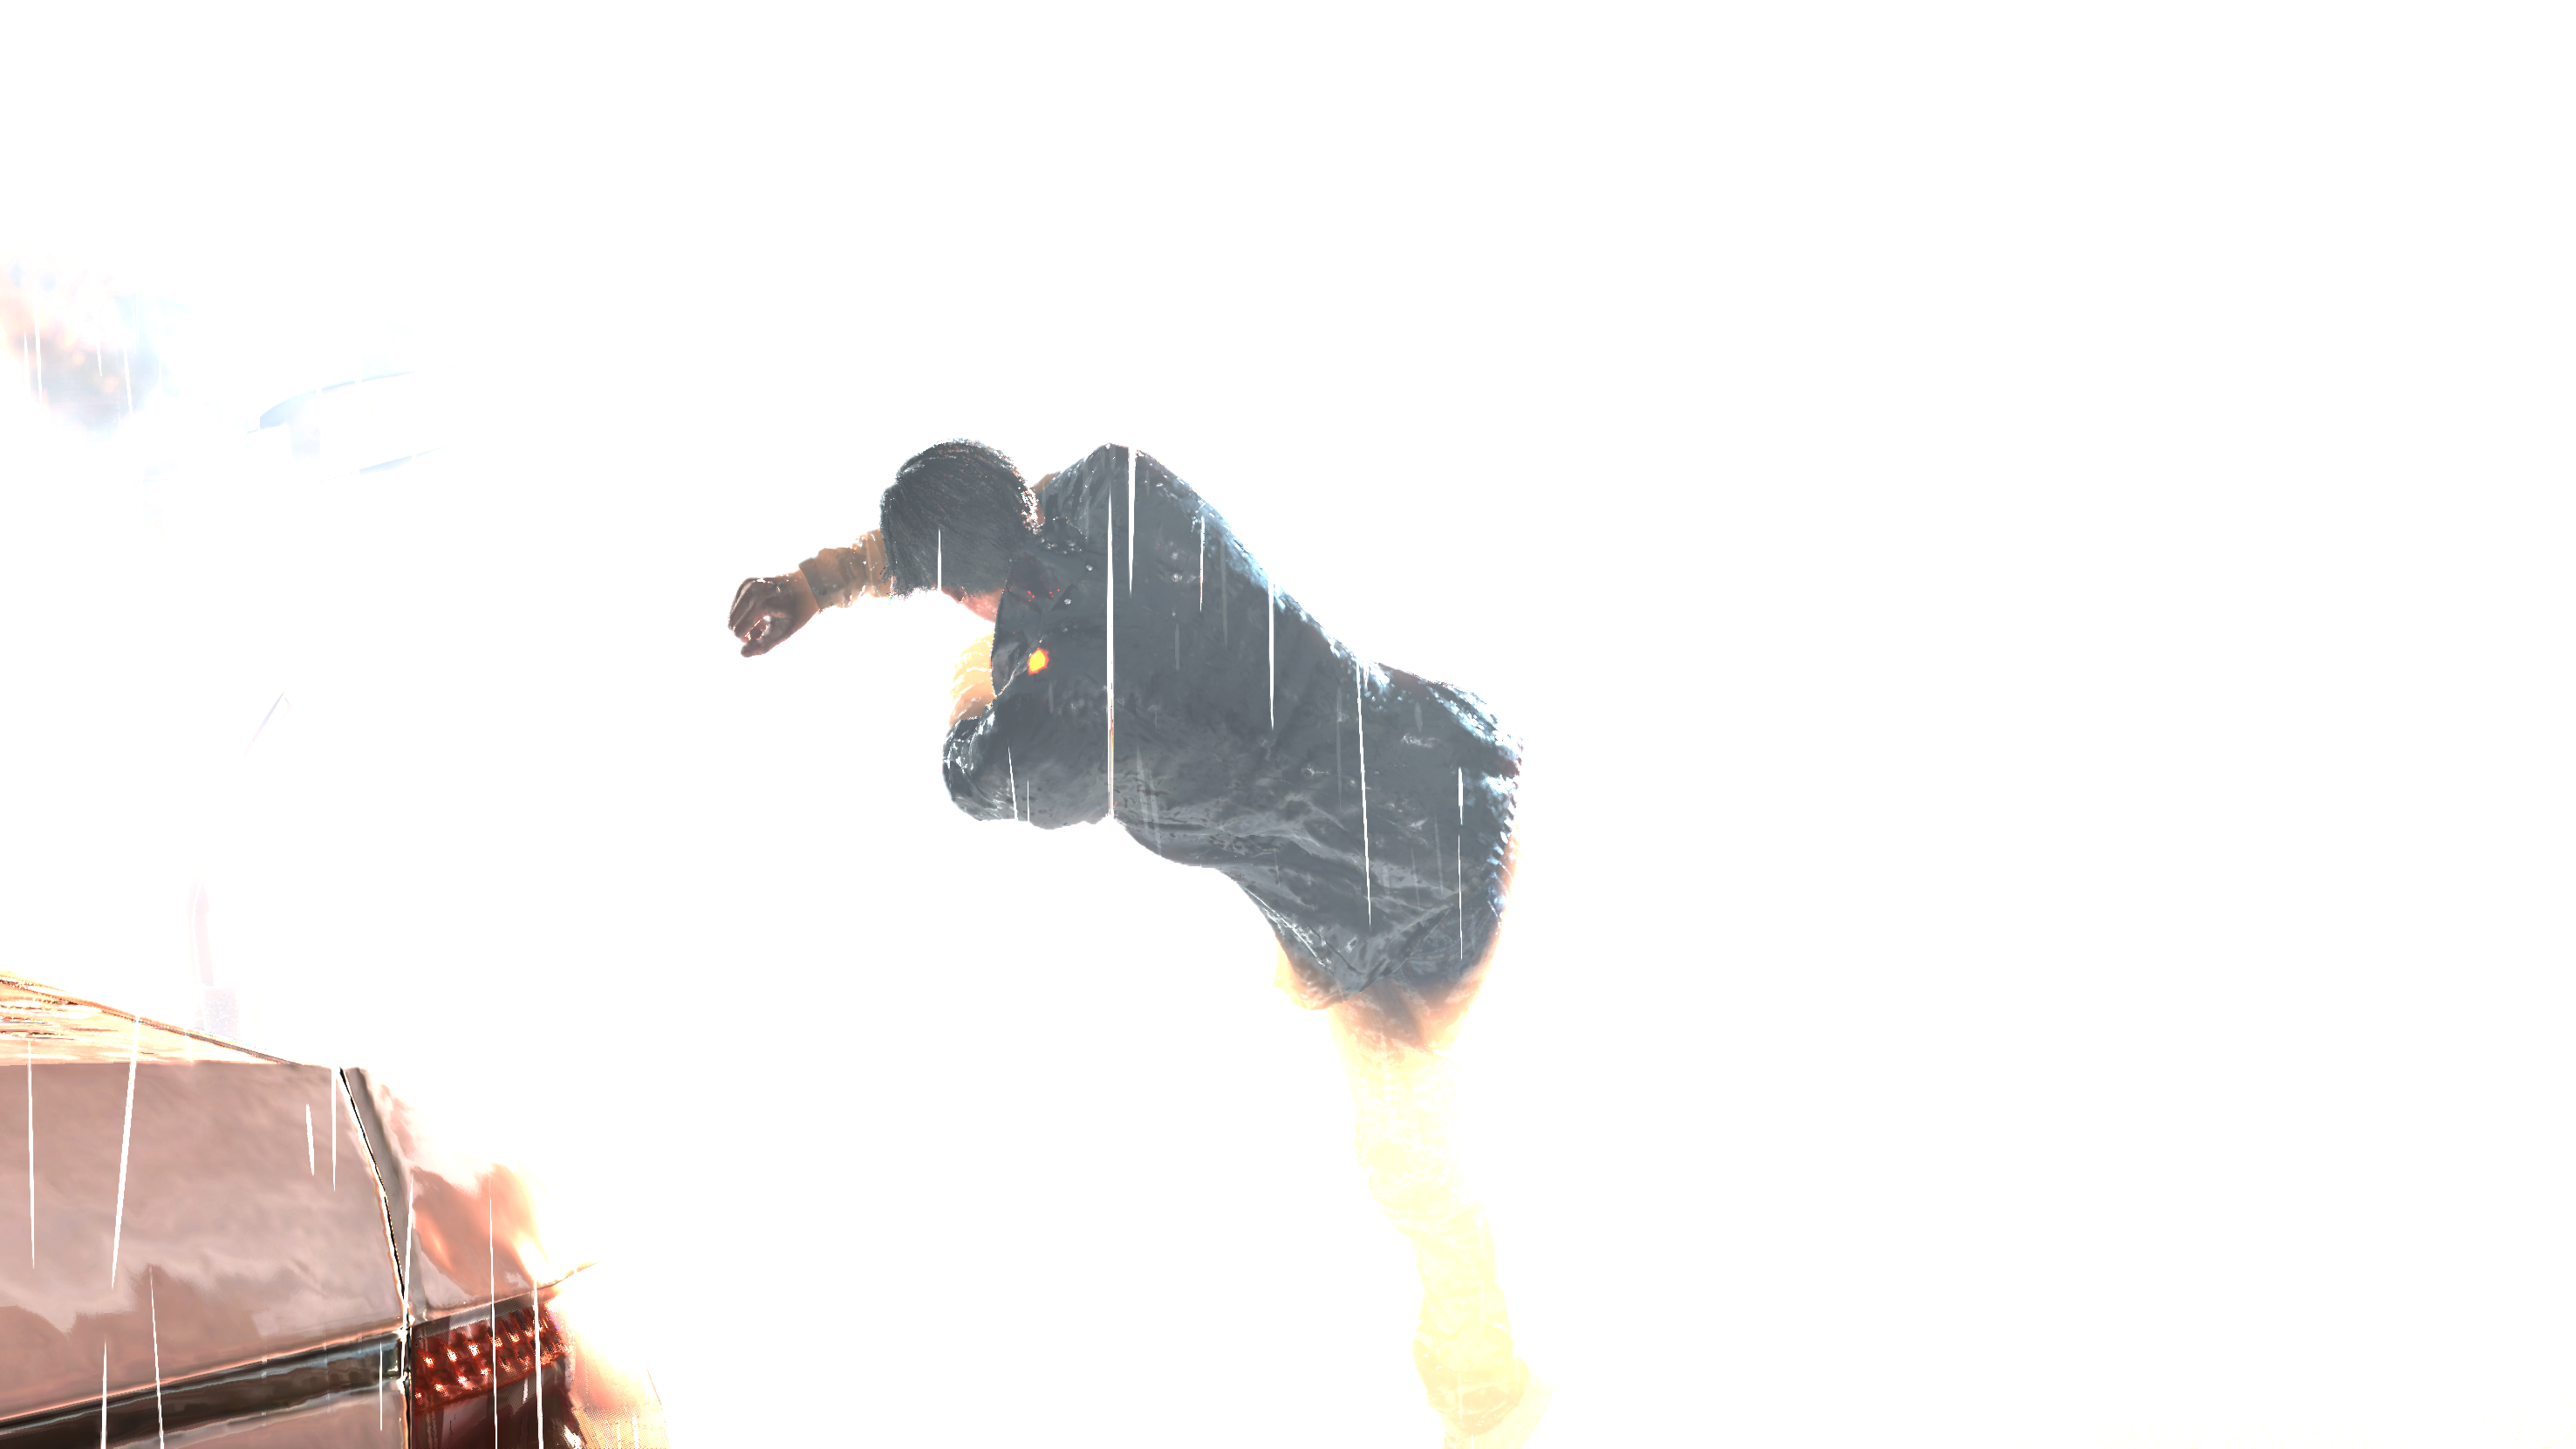
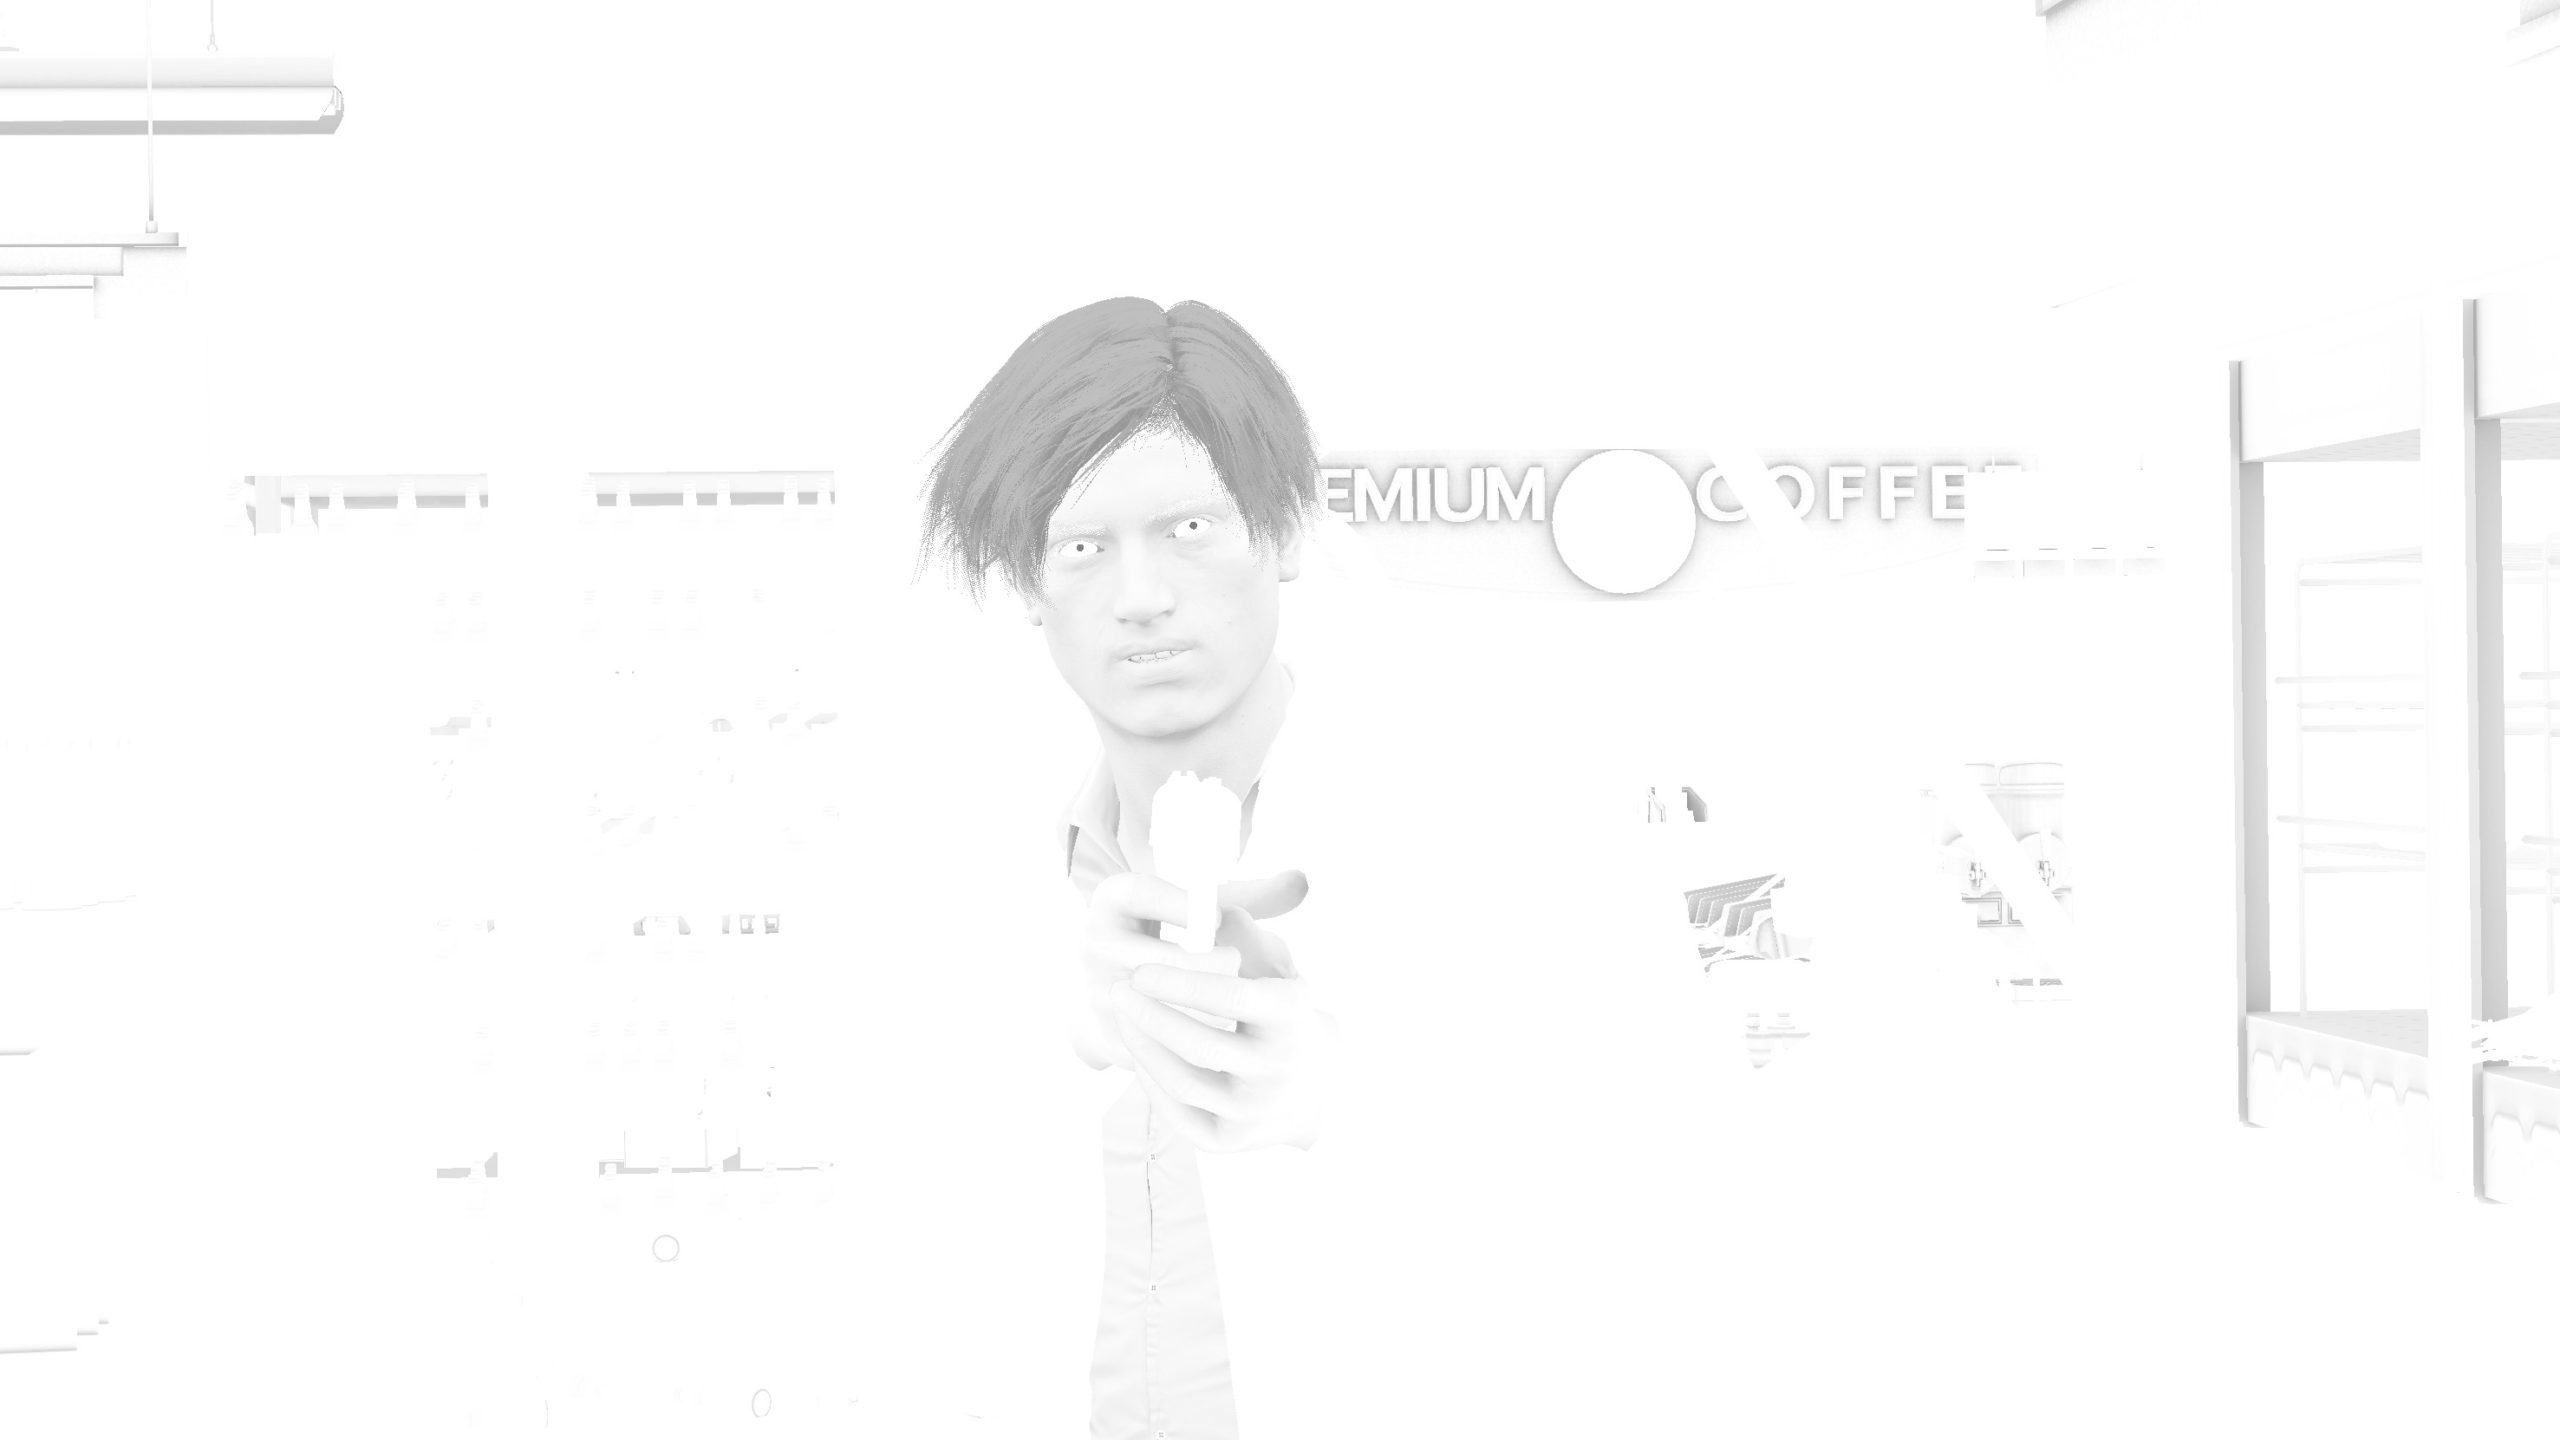
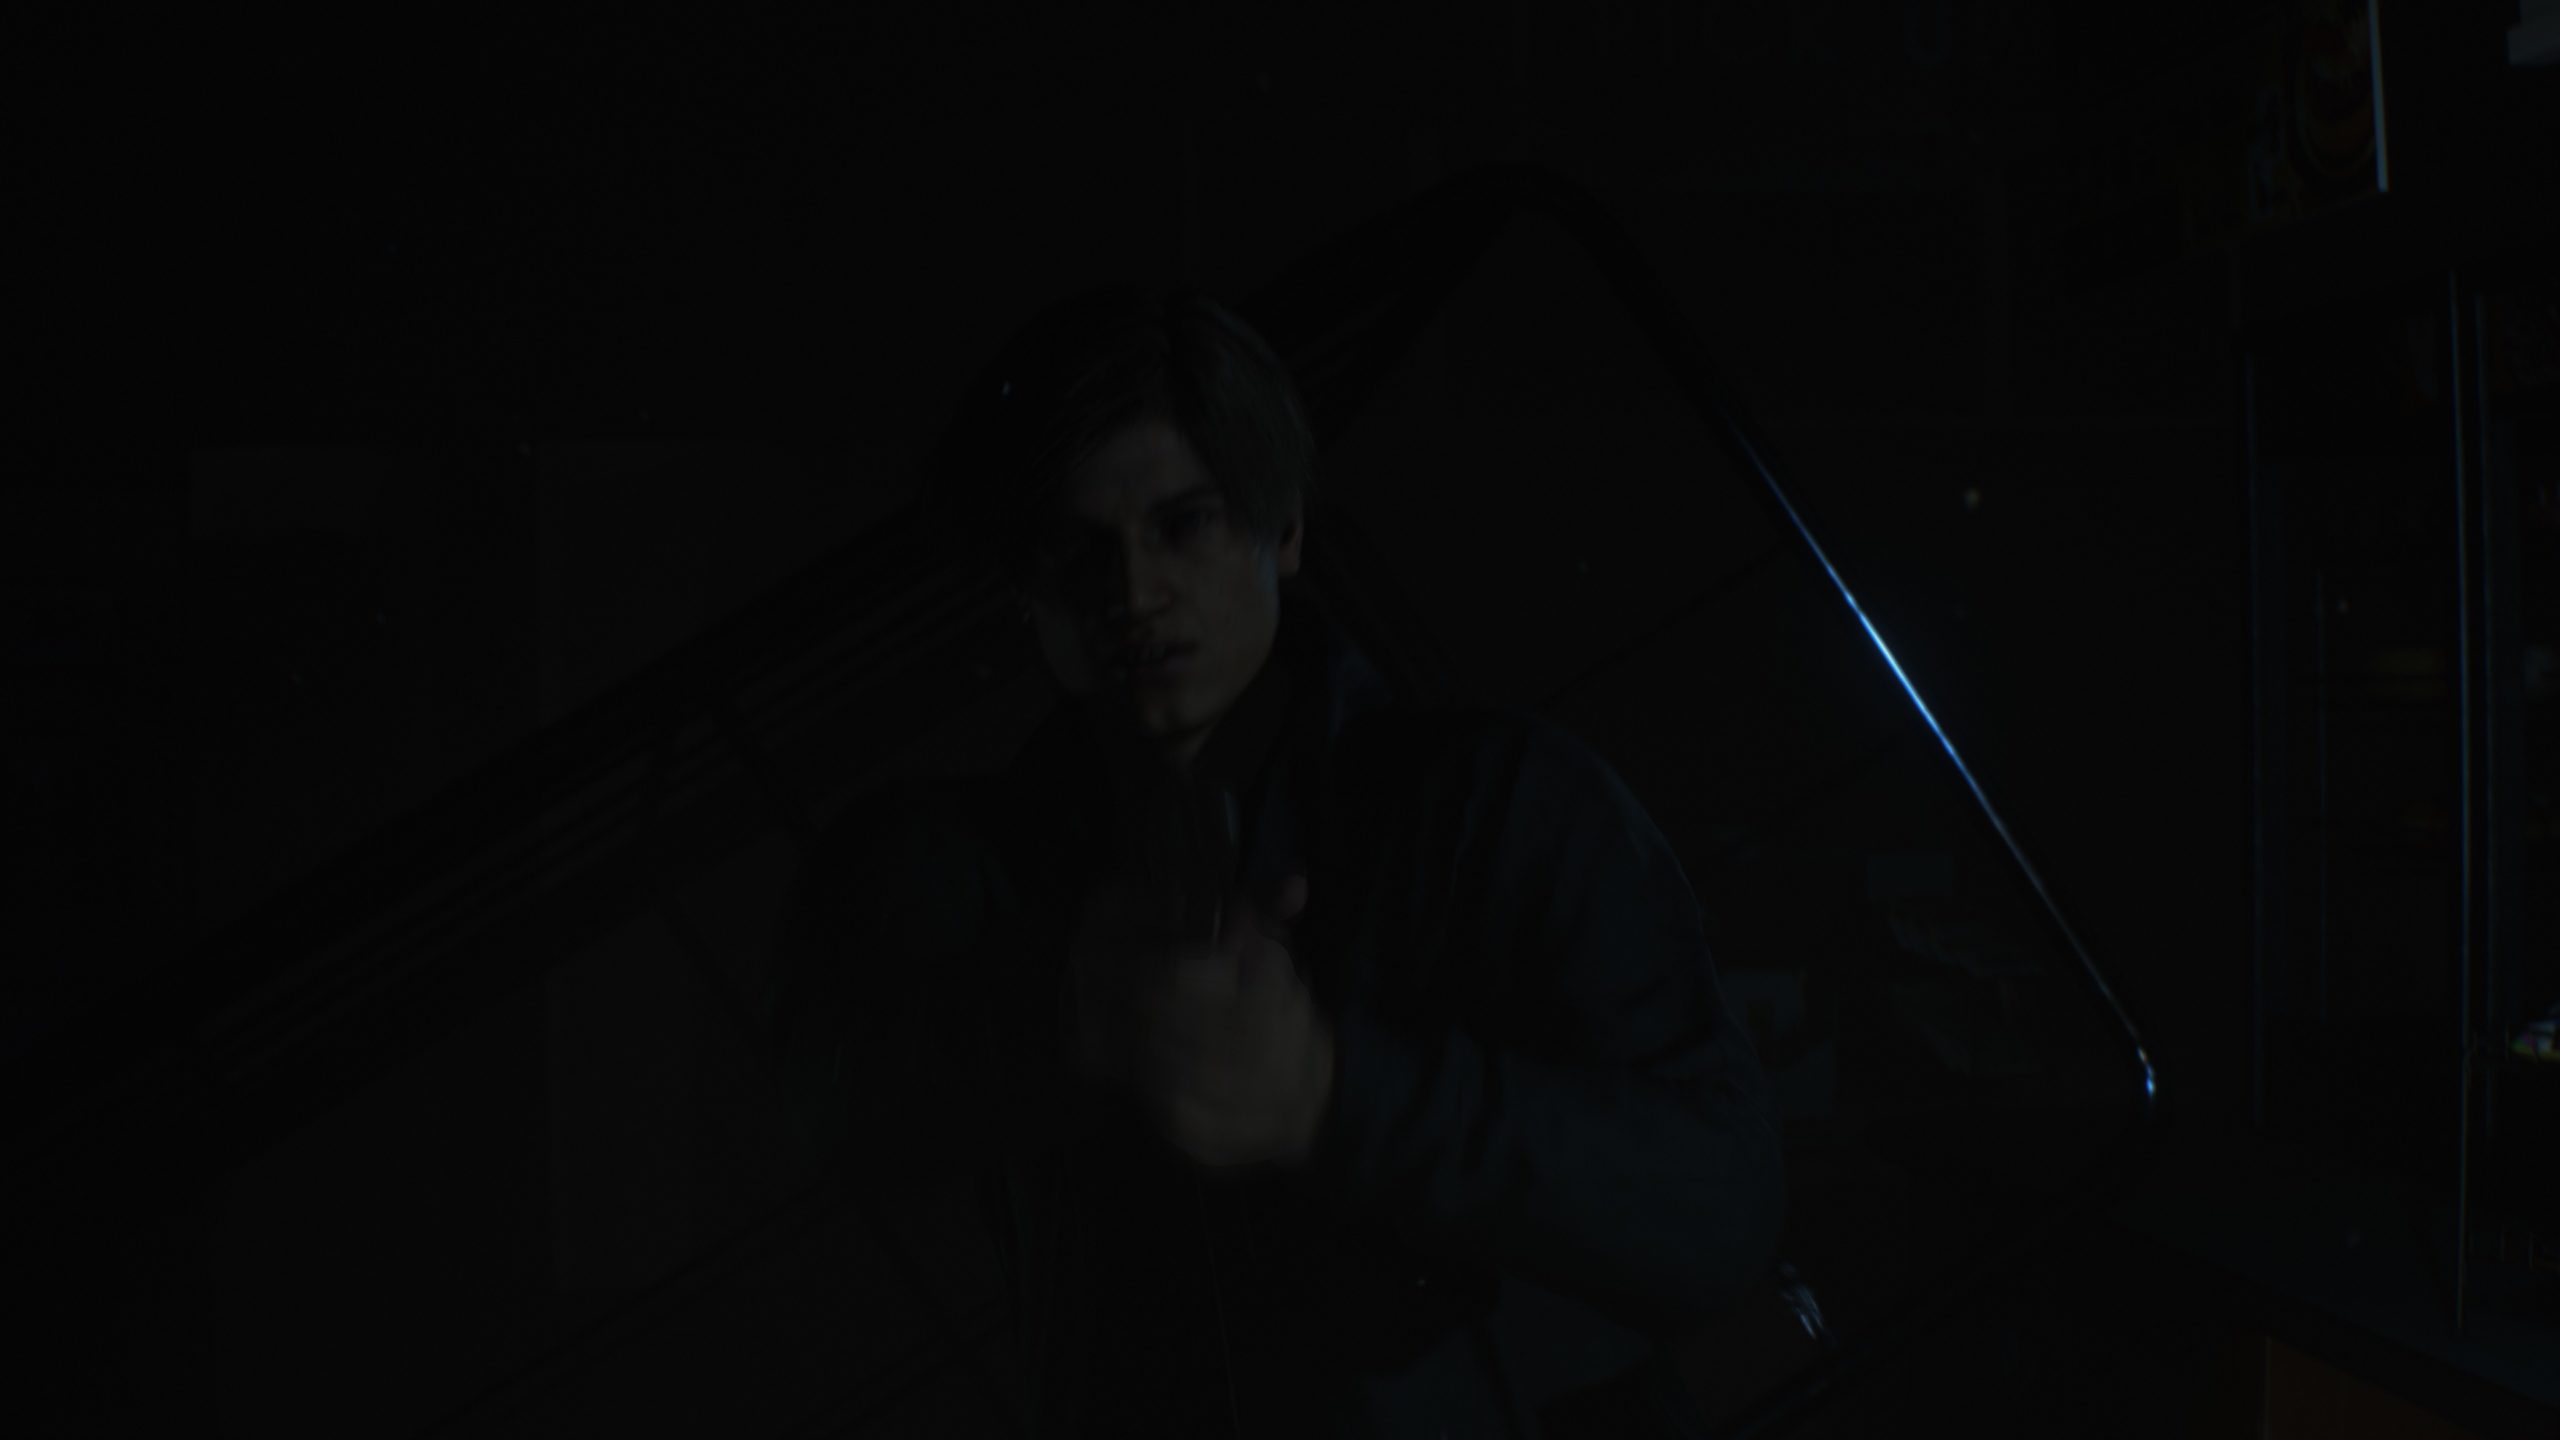
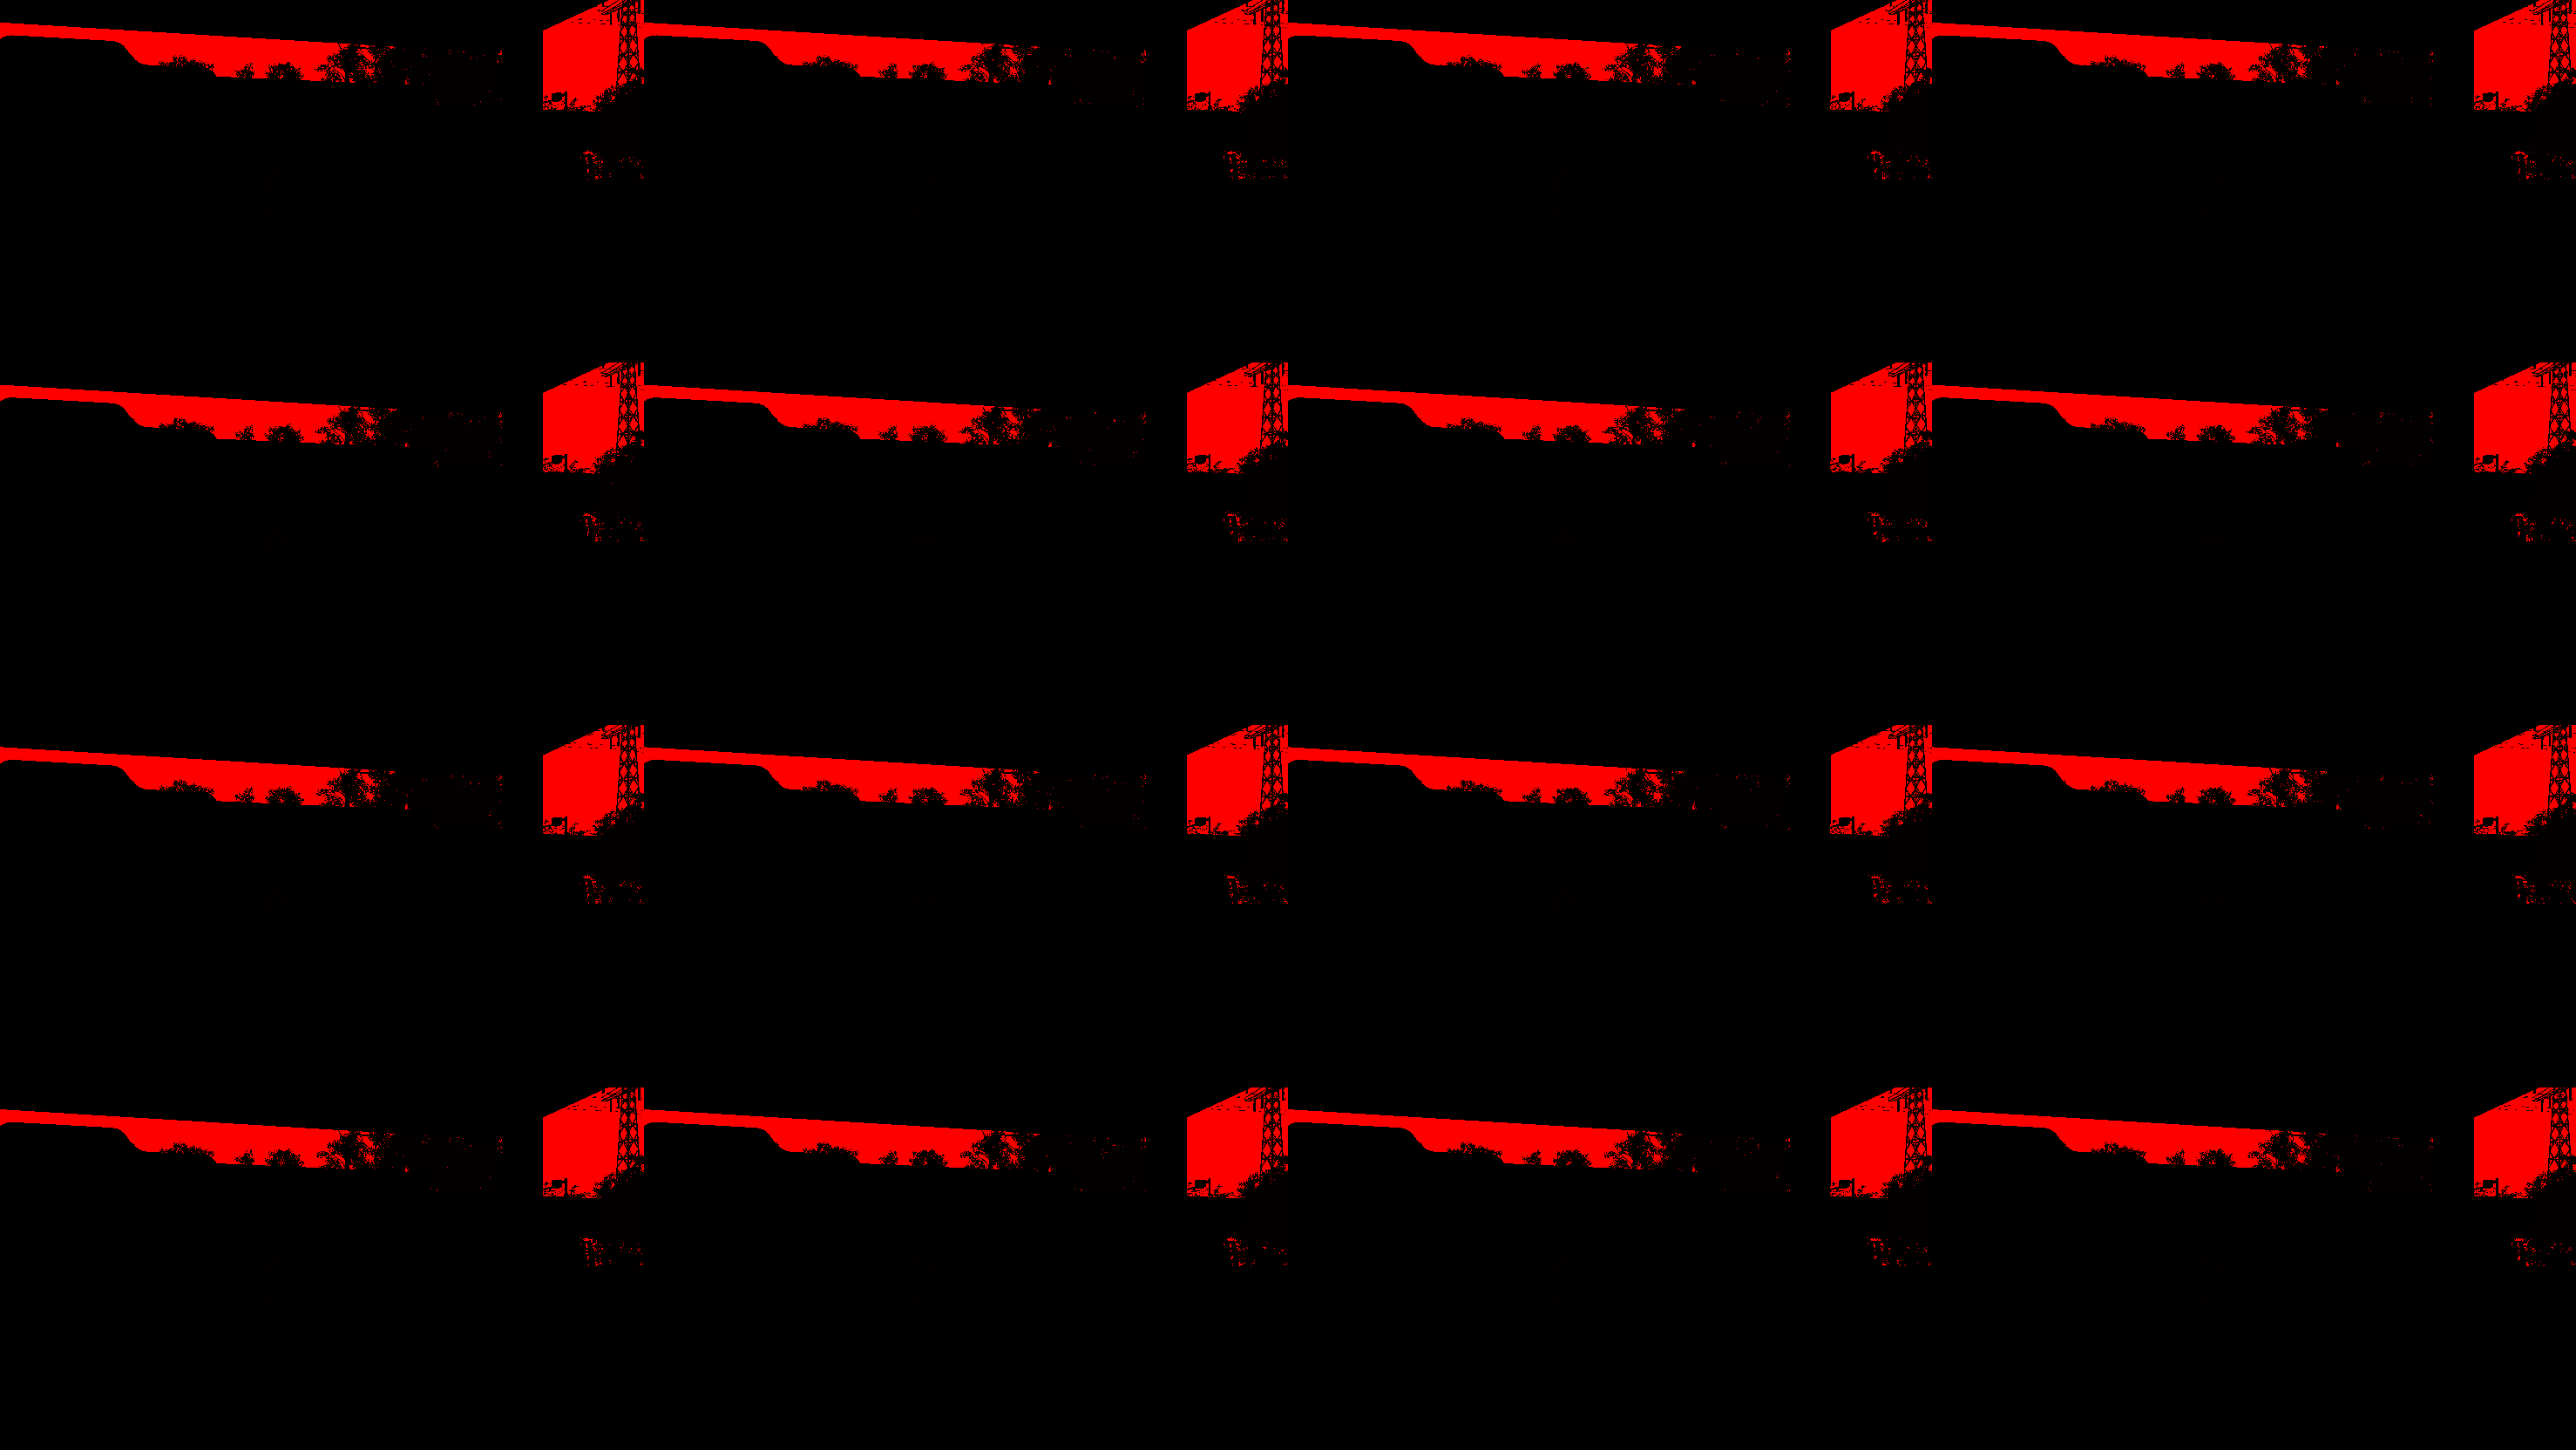
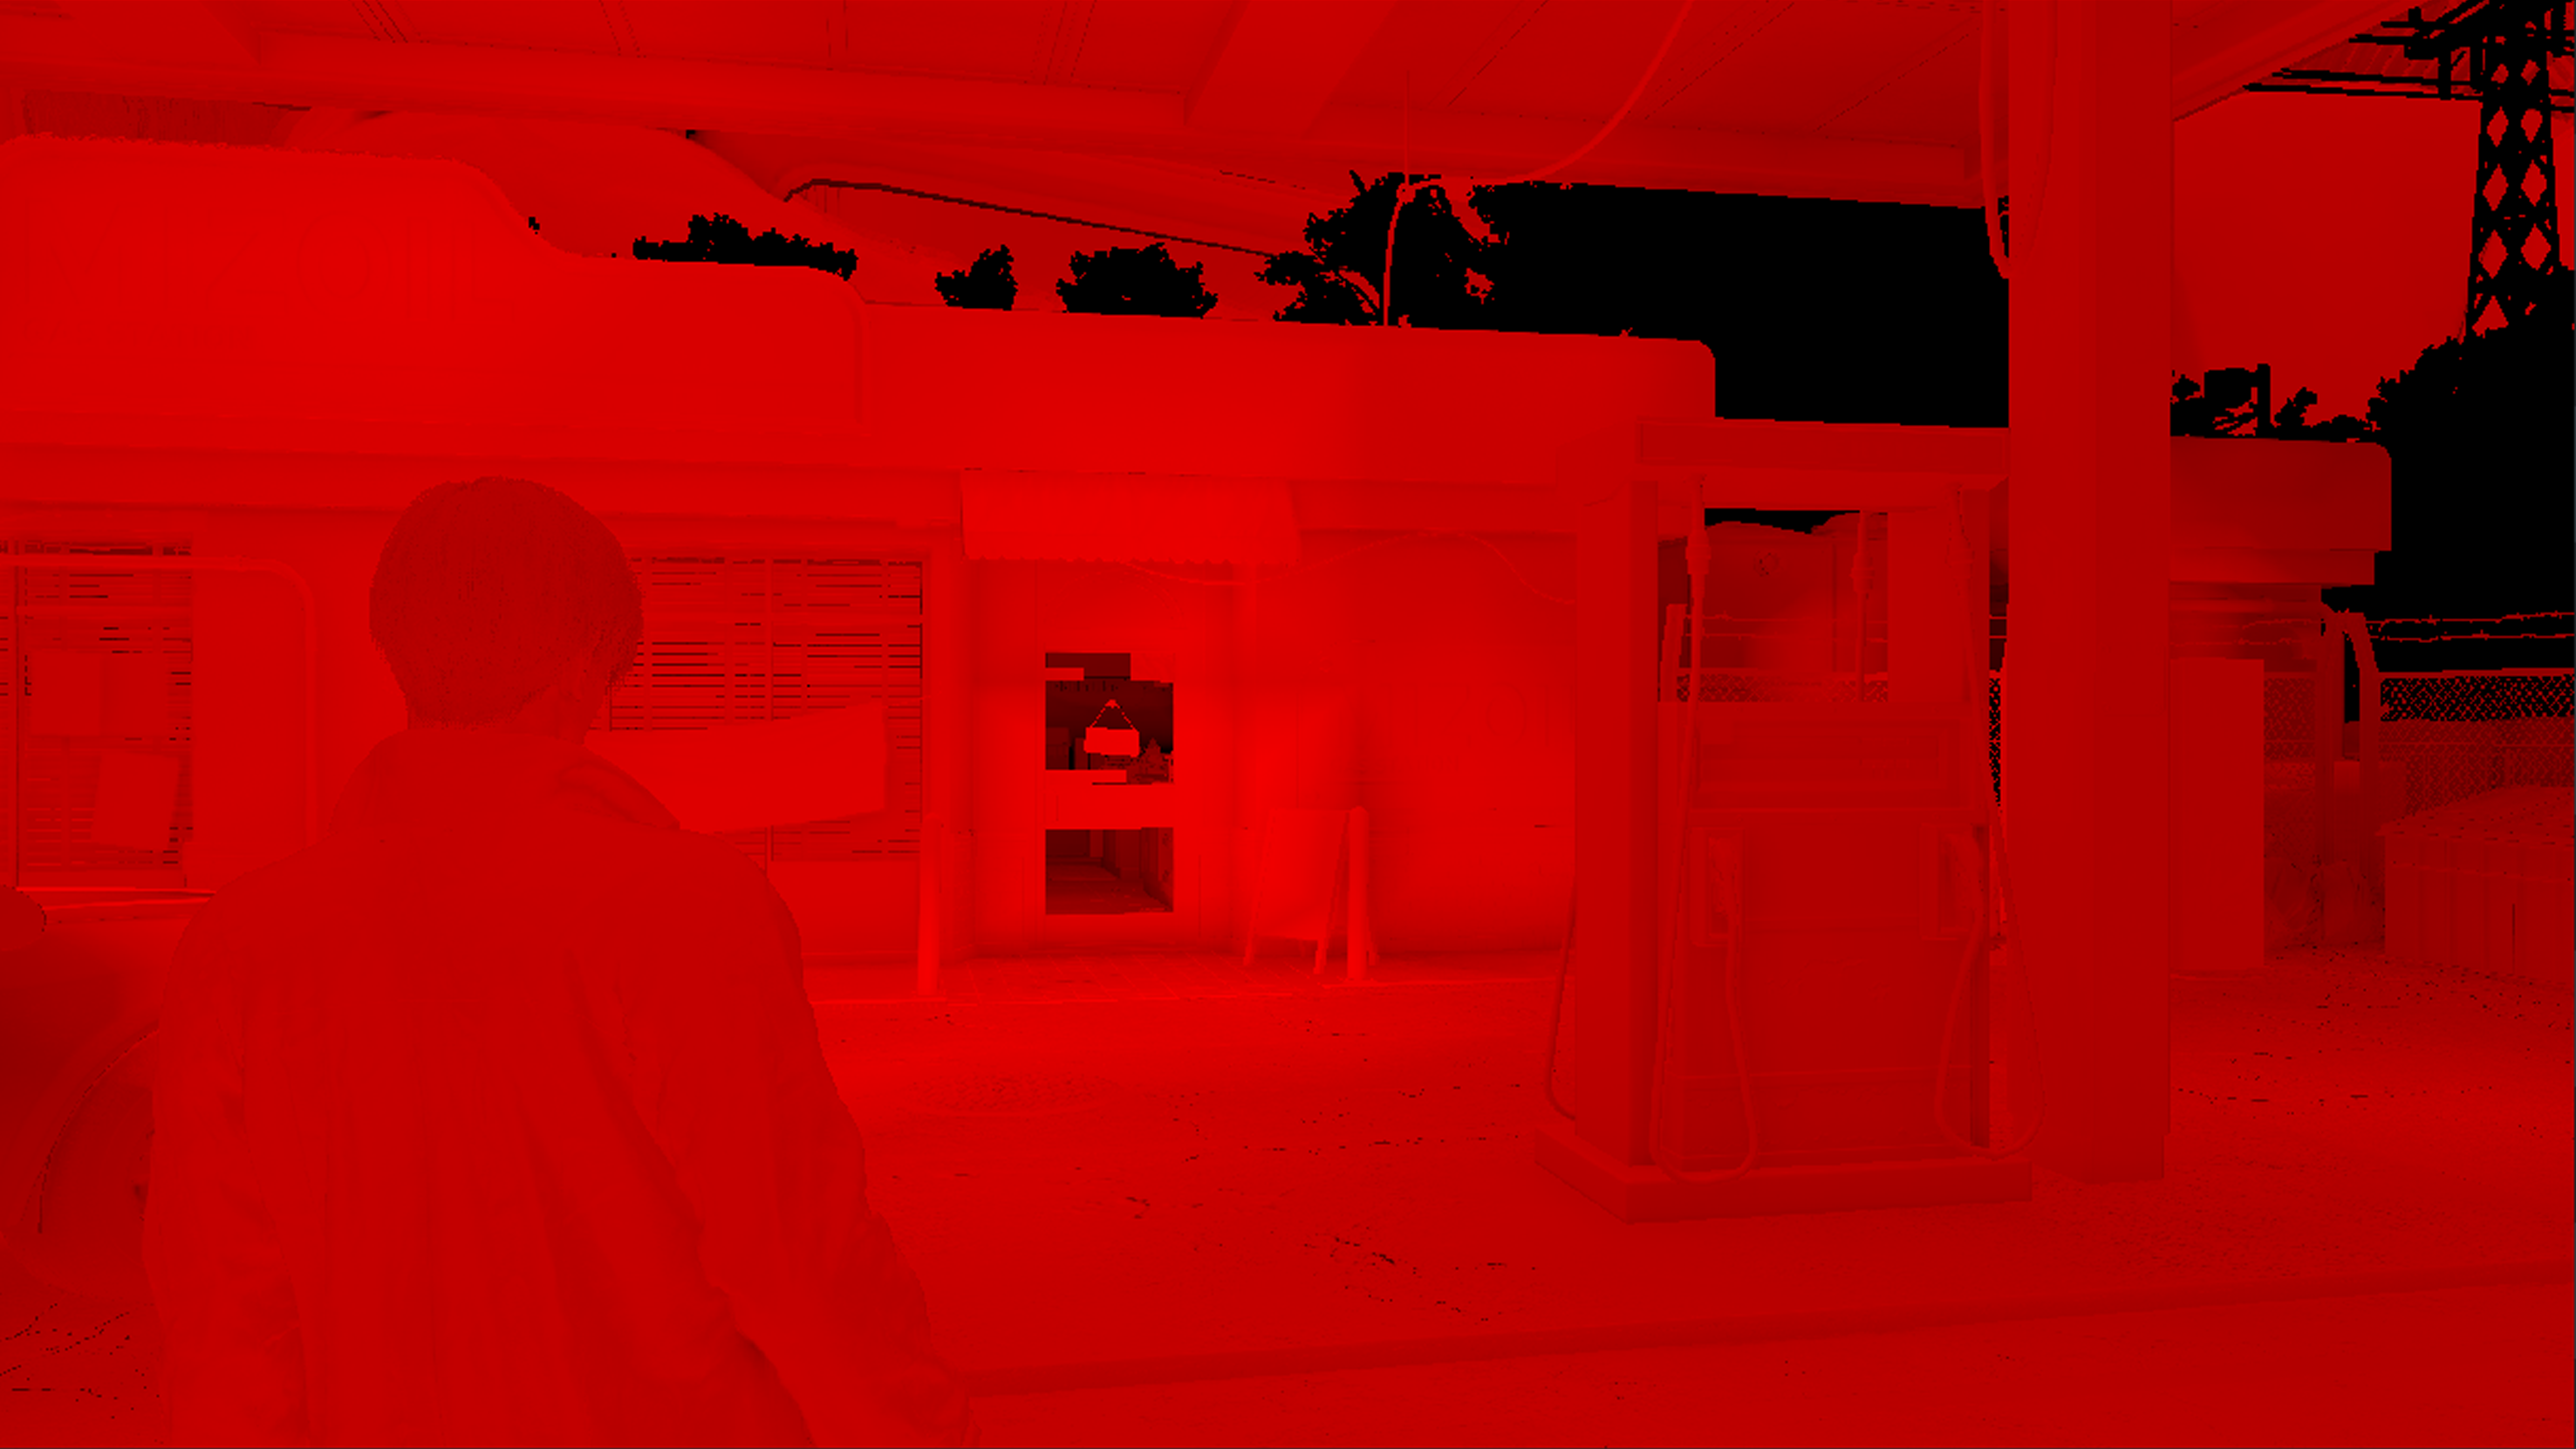
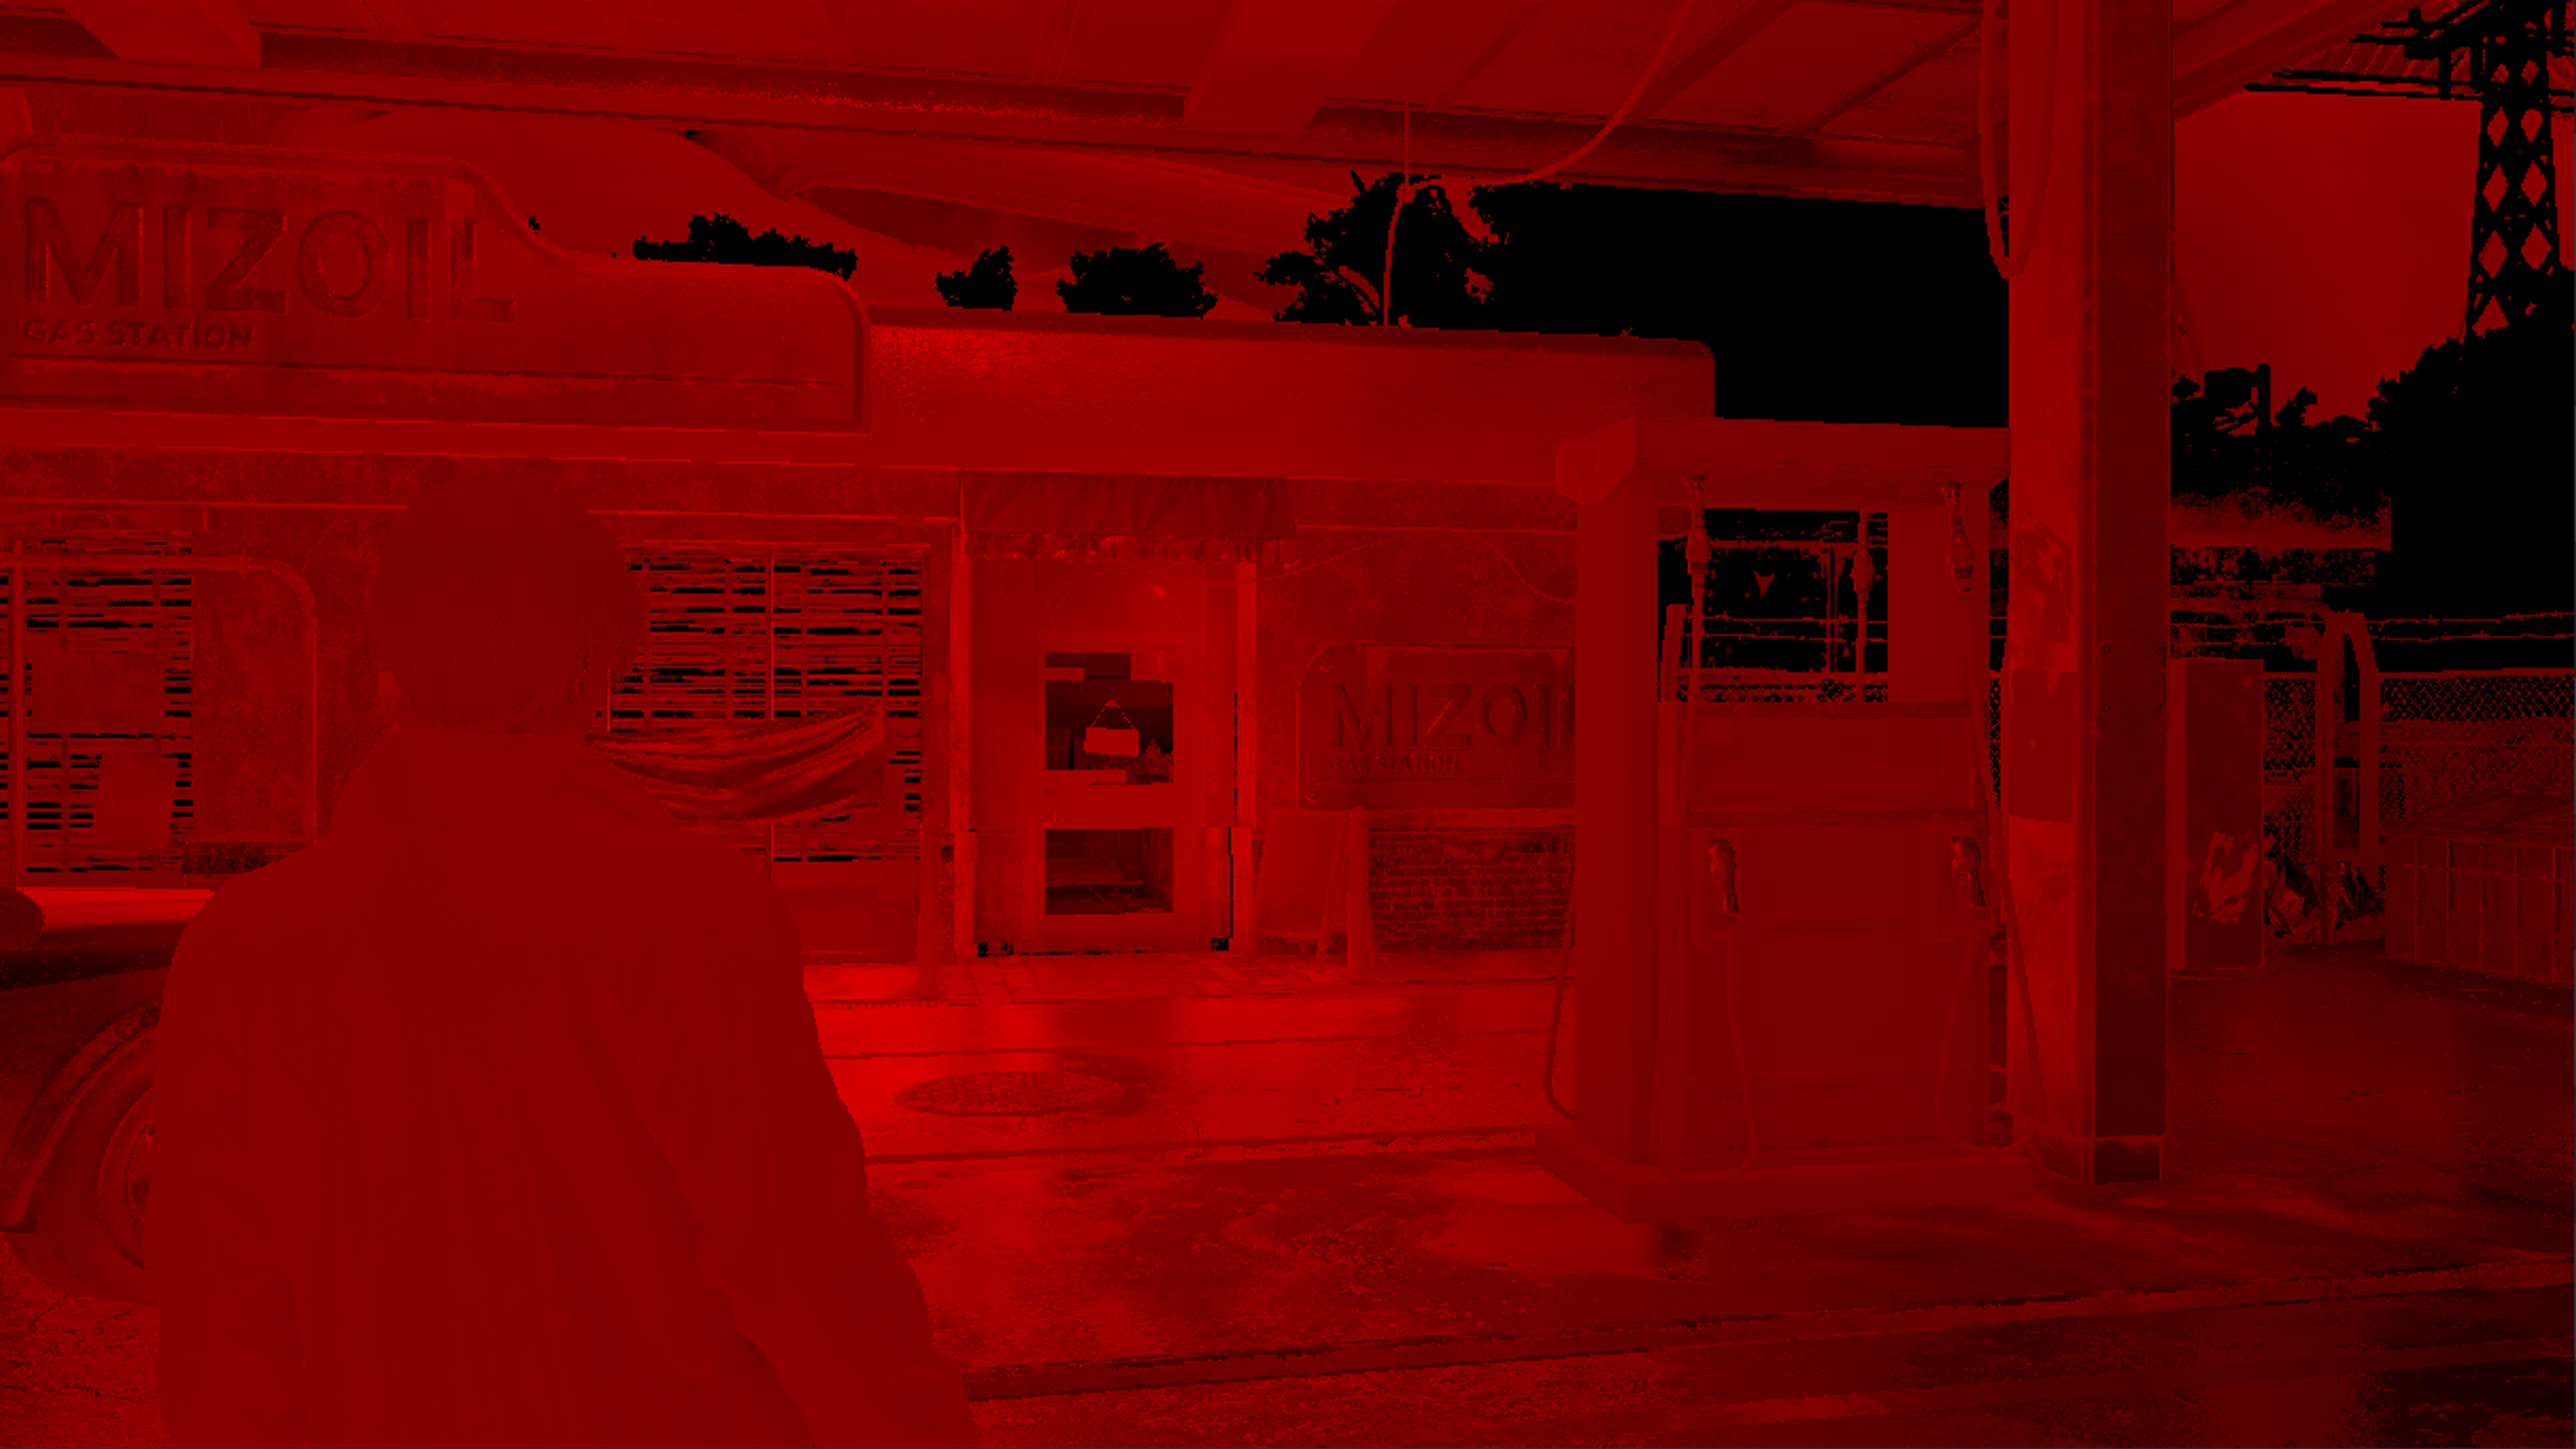
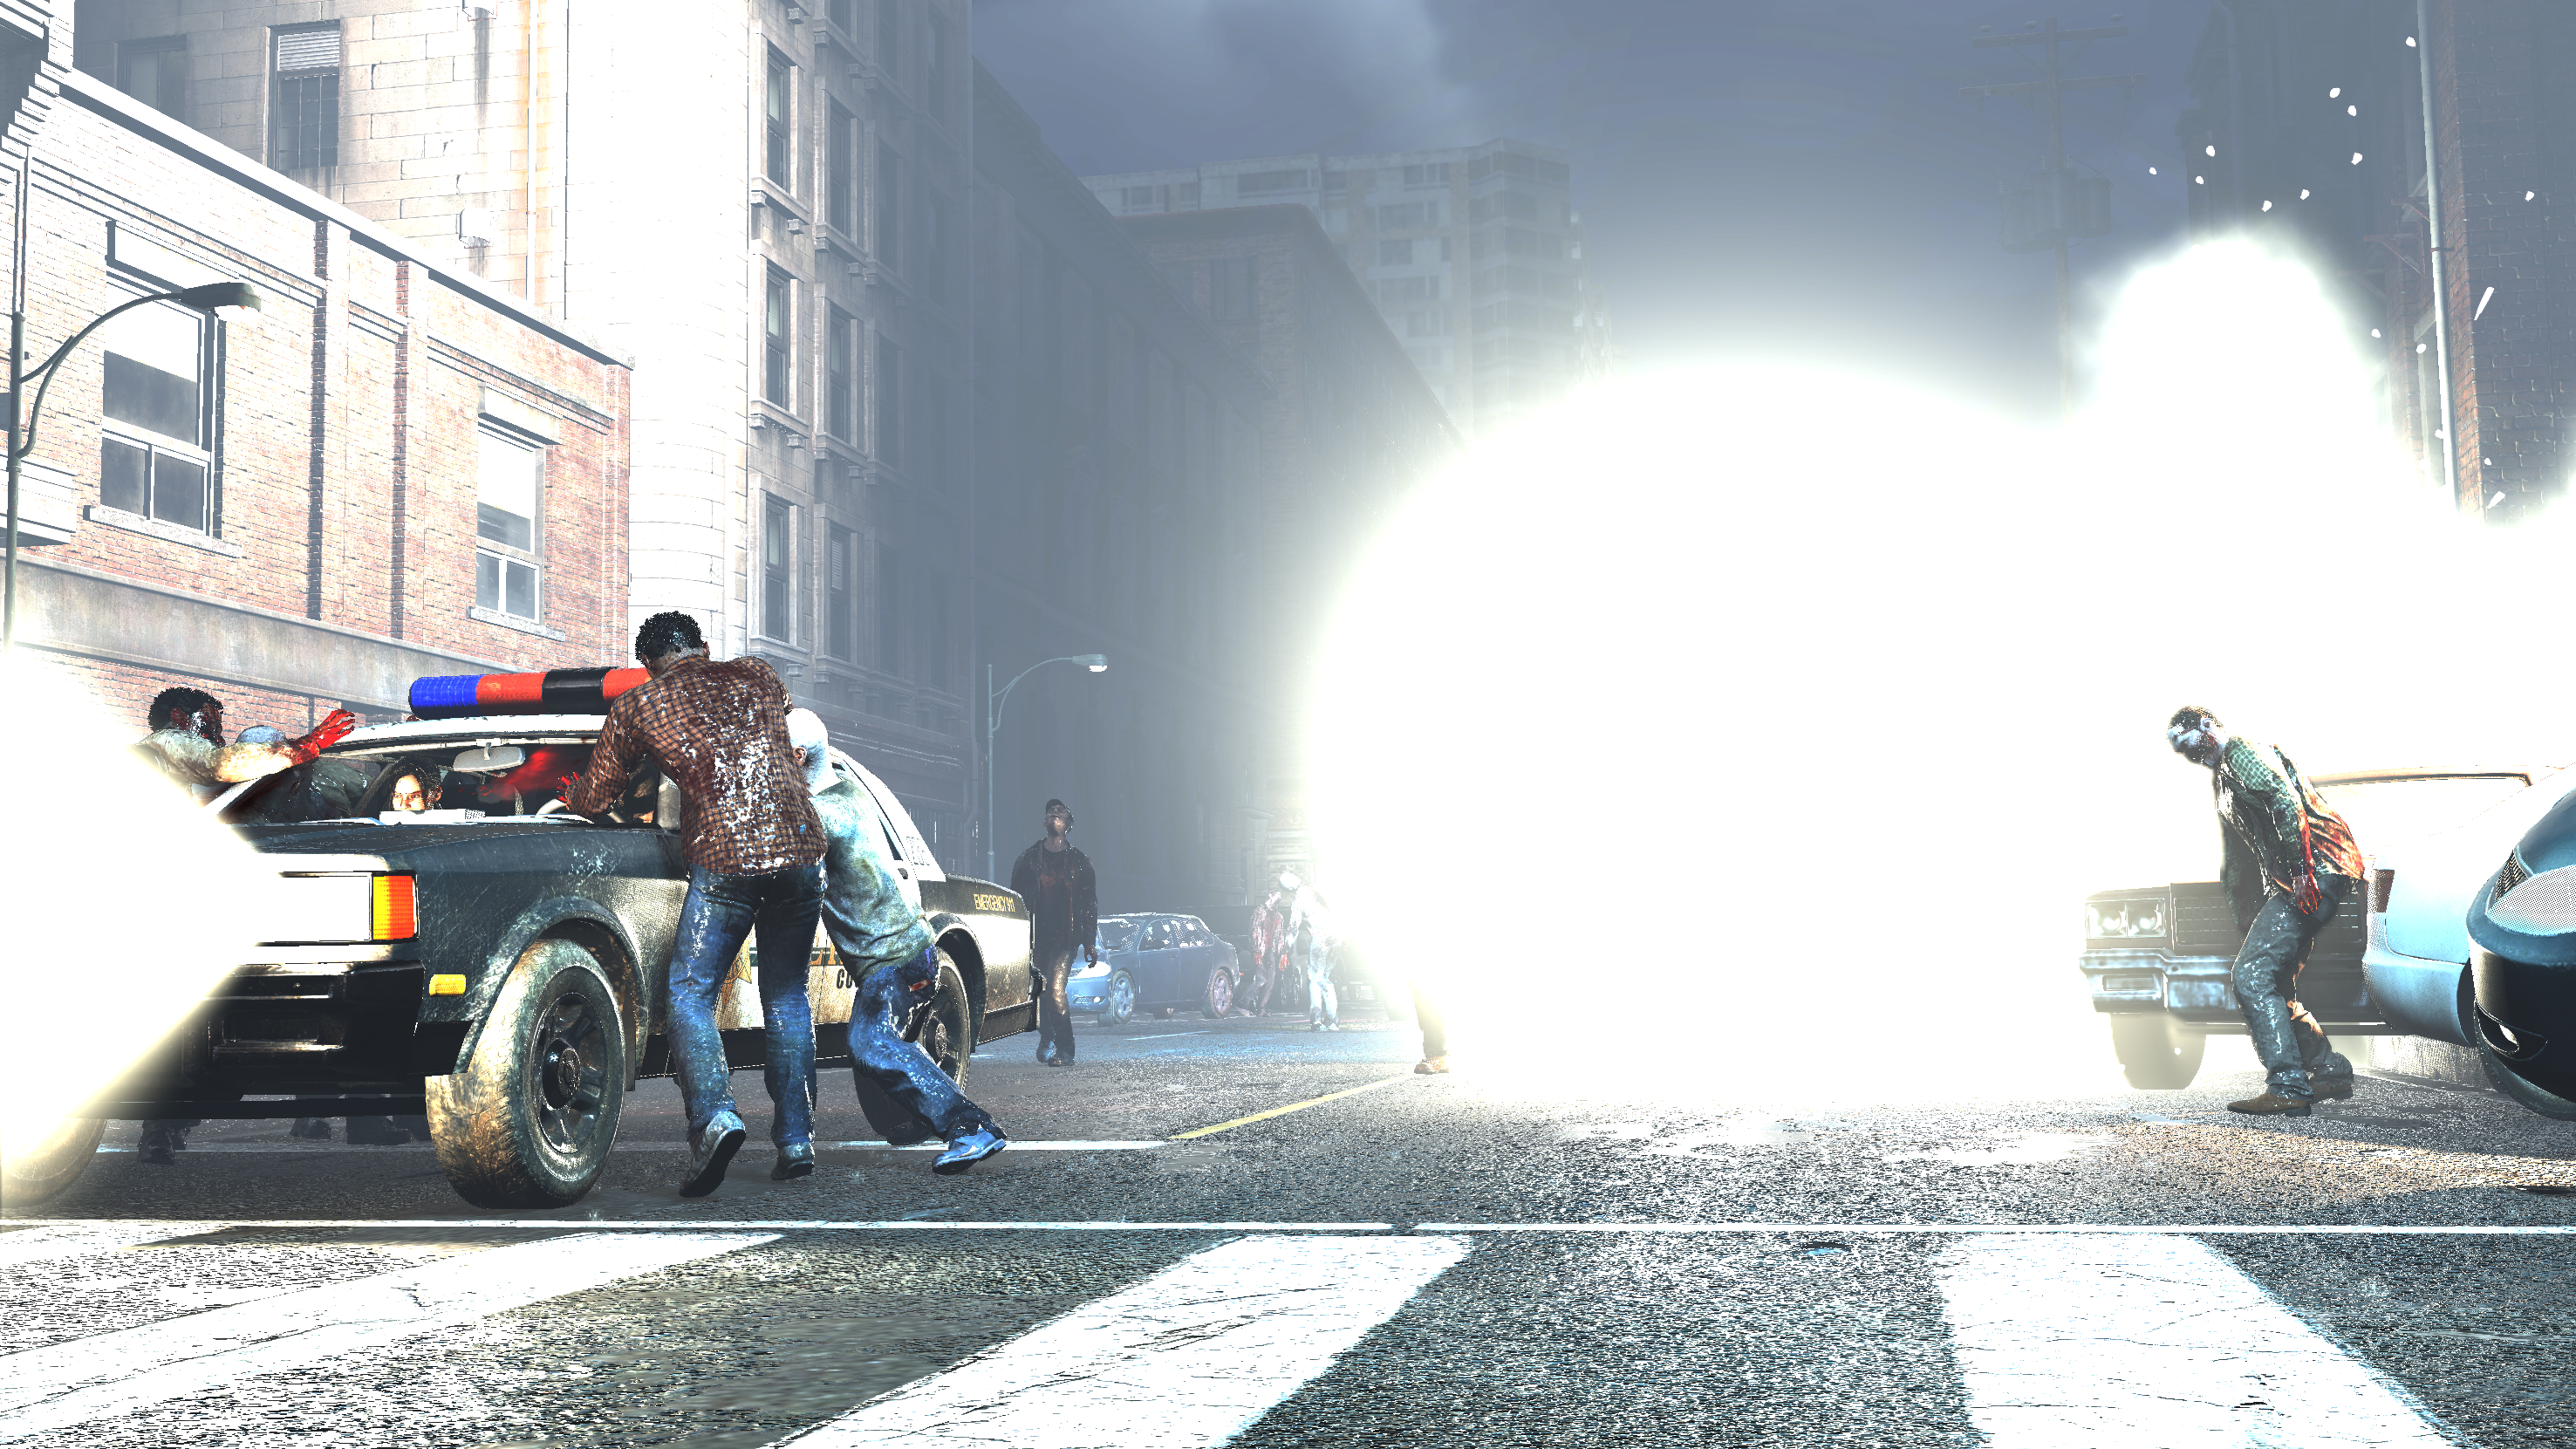
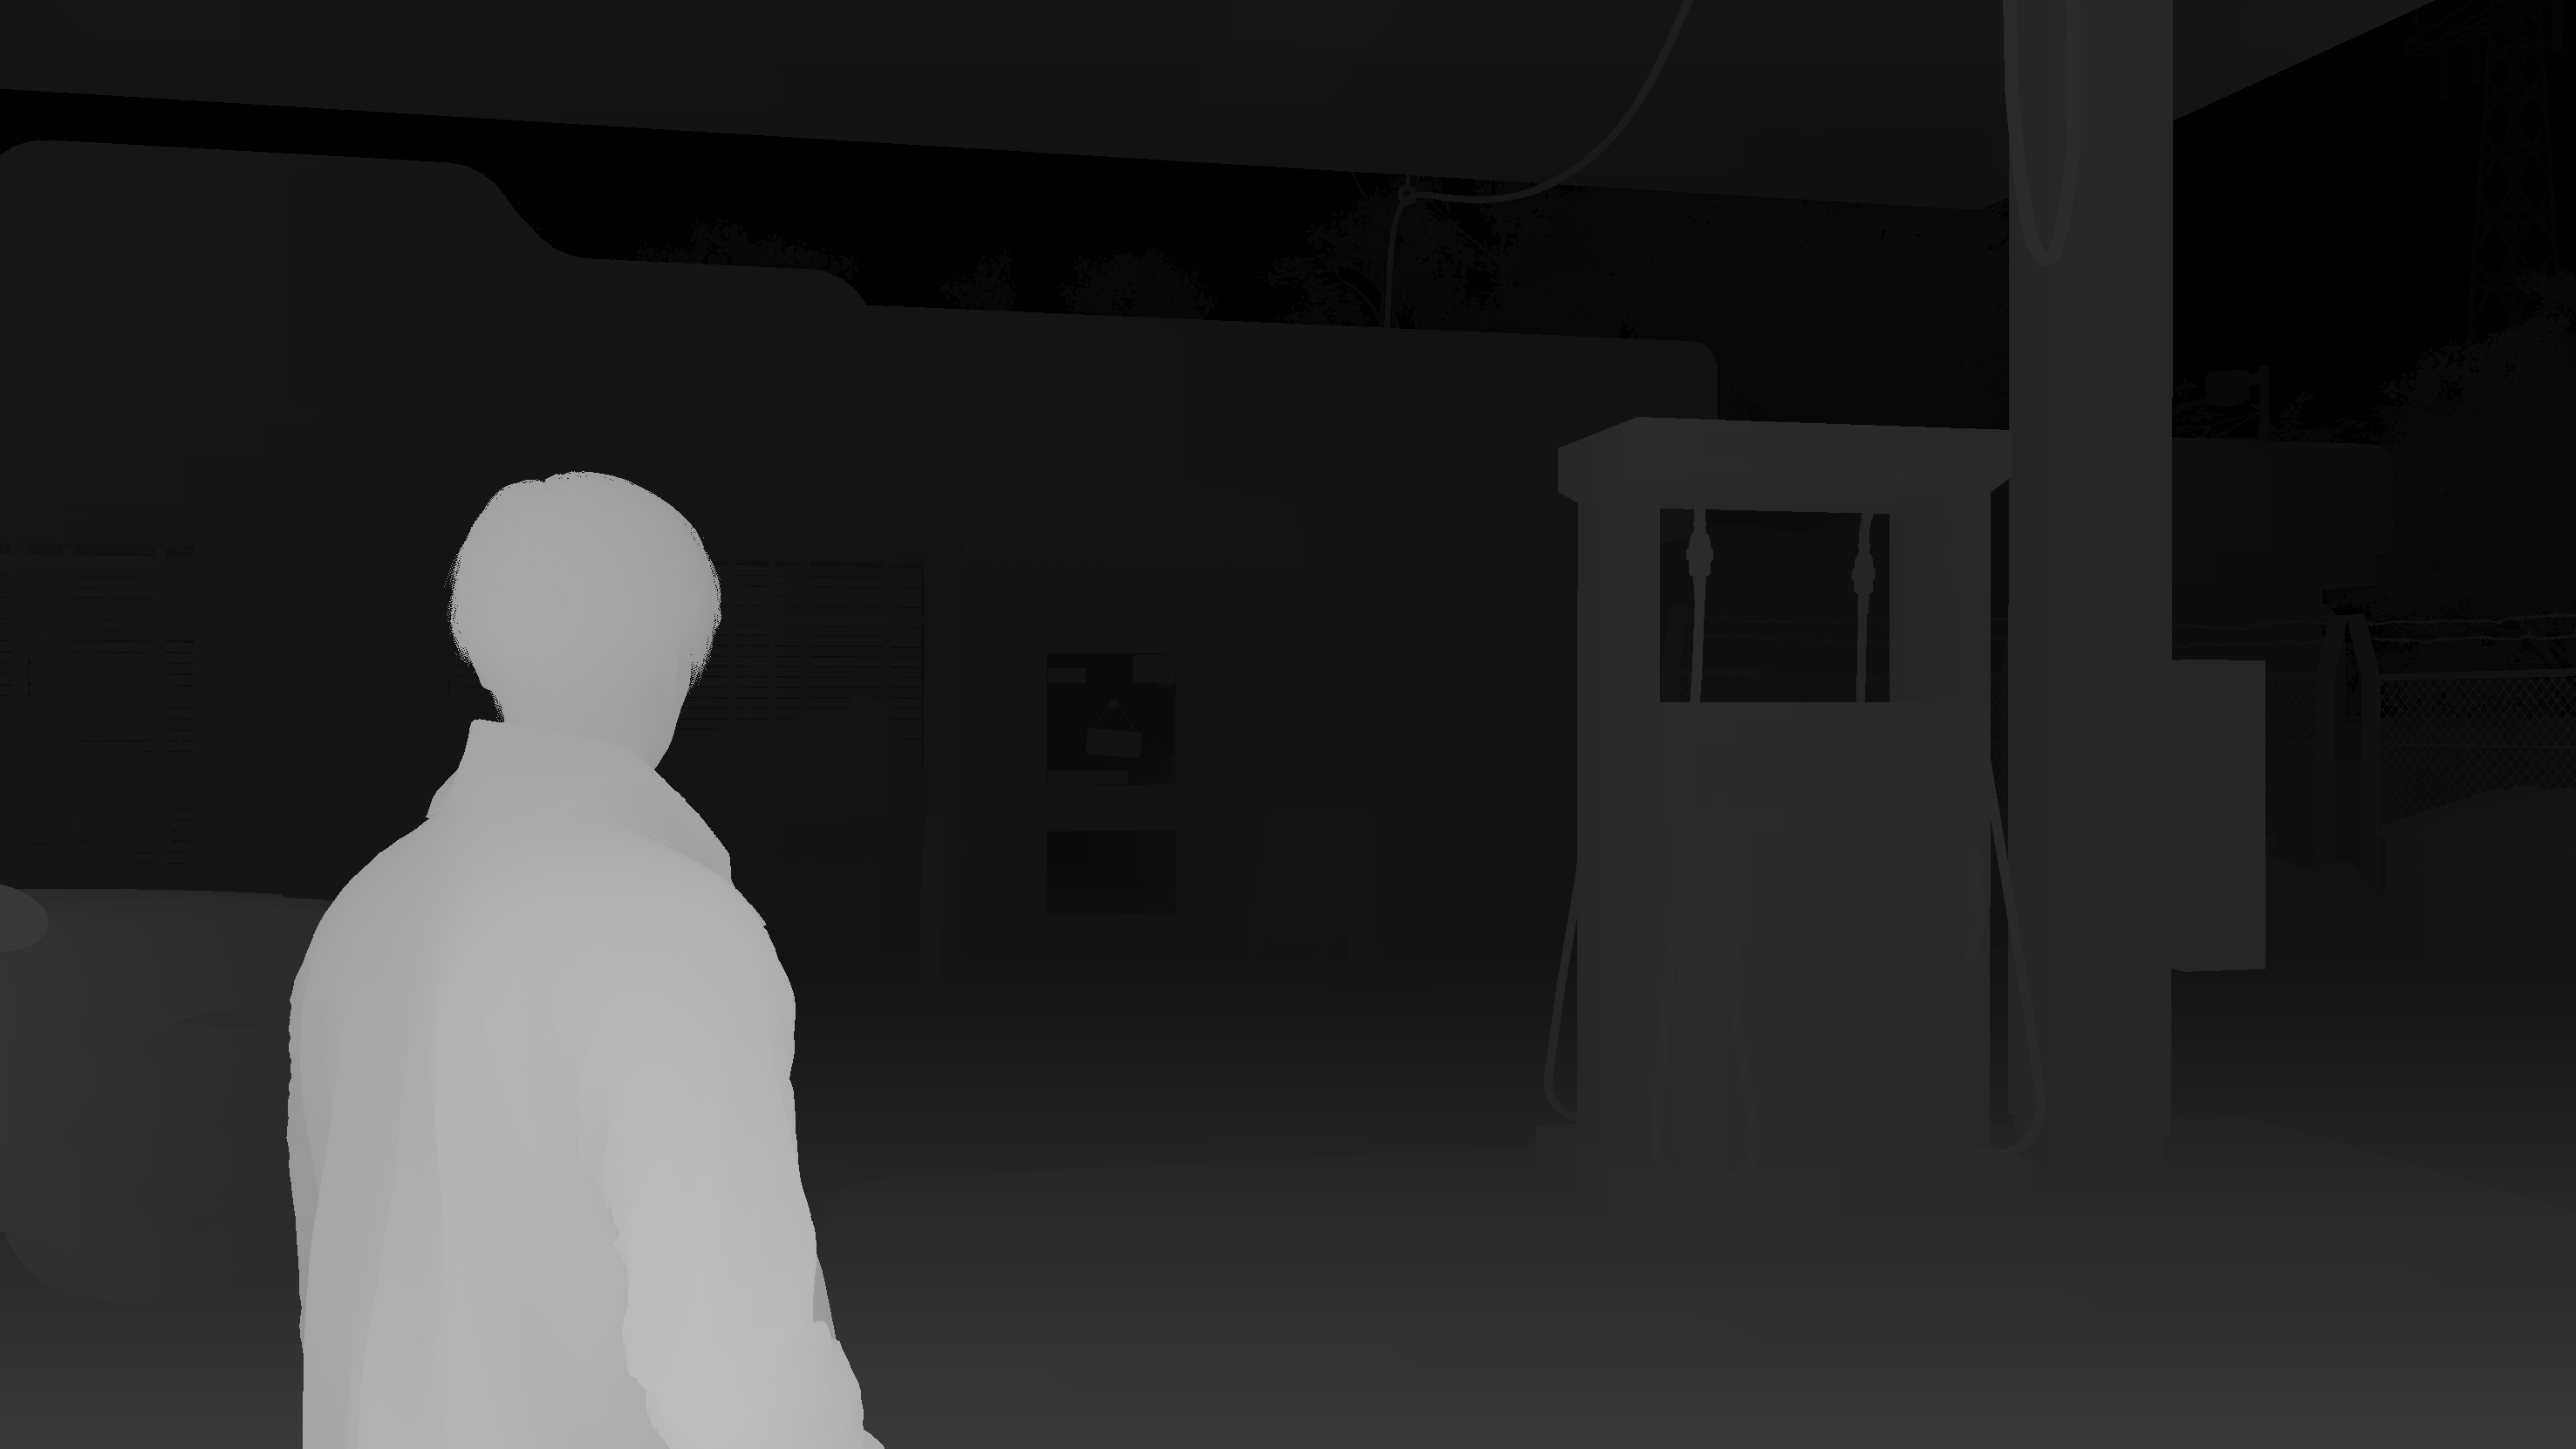
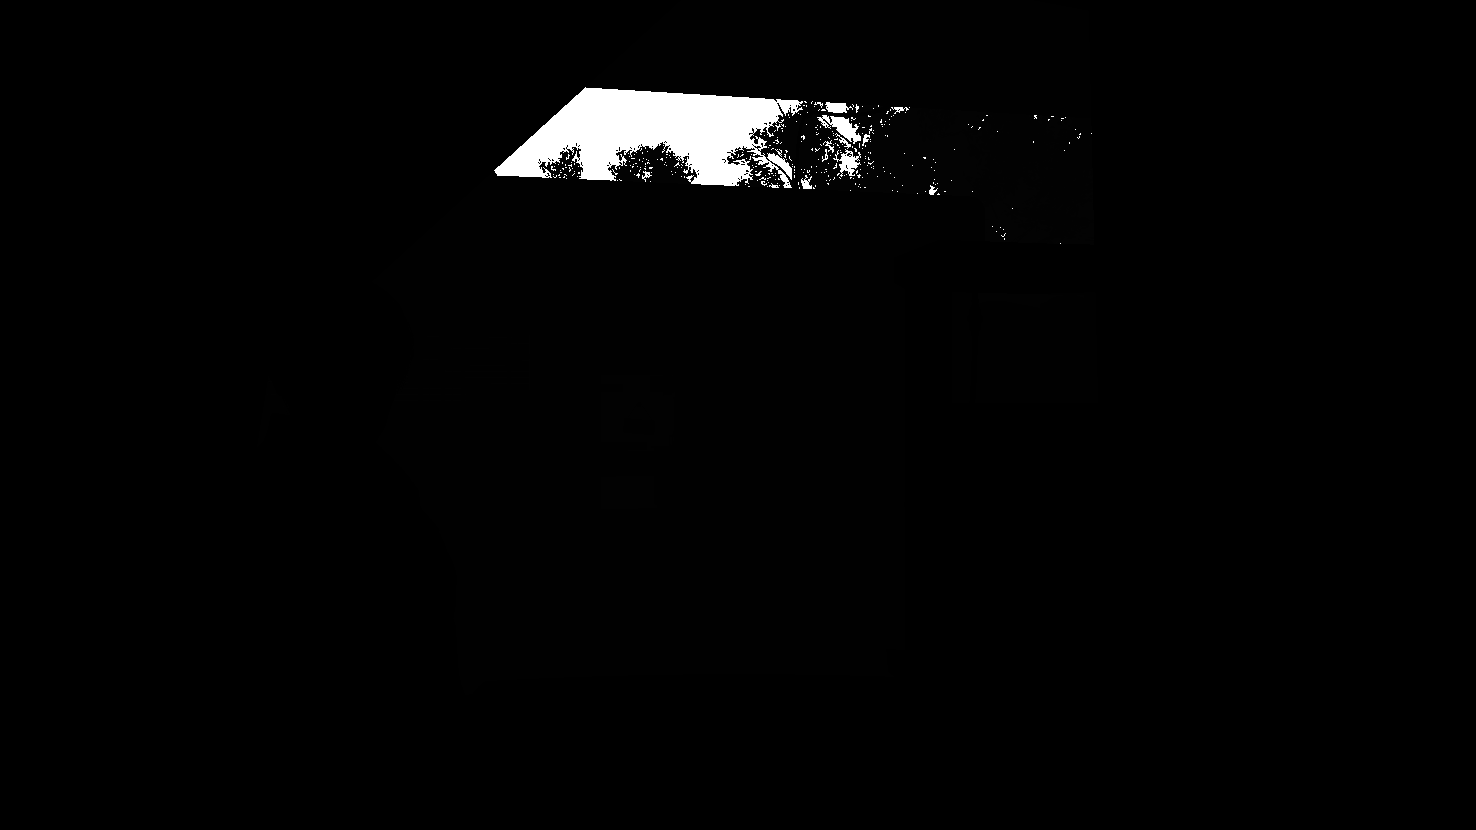
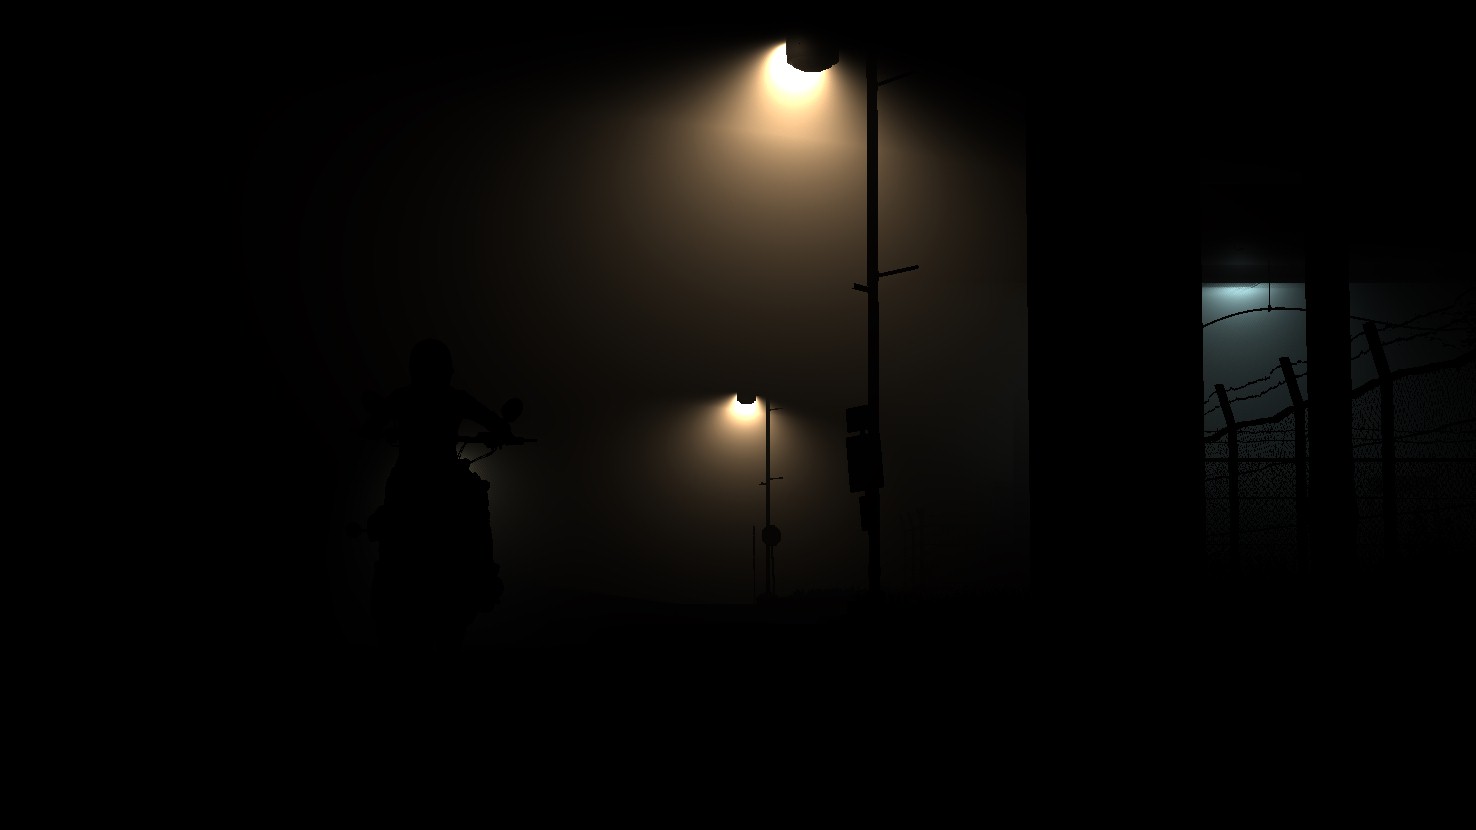
For Auto Exposure purposes, the RE Engine seem to be using a Matrix or Multizone Metering. In that method exposure get prioritized for the “defined” most important parts of the frame. For that purpose a mask is used. And because of the dark mode applied to the majority of the game, you would notice that the mask is quite similar in majority of the frames (if not exactly the same one) and it would seem like a “Vignette”.


I’ll leave below in readings section some good reads about that method that explains it (and other auto exposure methods) in detail, and explaining why it works perfectly for some games. Anyways, for that purpose, params passed to the shader is as follow
Hitogram Adjustment
struct HitogramAdjustment
{
	float4 converter;
	float bright_rate;
	float dark_rate;
	float white_range;
	int update_wp;
	float max_luminance;
	float min_luminance;
}
Yes, it’s Hitogram, not Histogram, it’s not a typo, original code have that way.
Haze Compositor Parameter
struct HazeCompositorParameter
{
	float4 sceneSize;         //converter
	float4 hazeAttributes;    //(bright_rate, dark_rate, white_range, null)
}
Where the compute dispatch gets the first struct, the later one is a “lighter” version of it, with all the necessary data, that goes into the fragment shader side of things. I left comments with the name of the values that later struct gets from the earlier one.
As you might’ve noticed, majority of the captures (and the game) is relying on similar MultiZoneMetering, except that last frame in the previous images, it uses a pure white. Anyways, to give you a sense of the difference between those frames, the table below includes the shader values for each of the frames.
Values Table
| converter | 6.66667, 512.00, 0.15, 4.00 | 2.85714, 1989.99866, 0.35, 1.42857 | 0.50251, 141600.71875, 1.99, 1.00503 | 6.66667, 512.00, 0.15, 4.00 | 3.125, 3180.83447, 0.32, 1.25 |
| bright_rate | 0.01 | 0.01 | 0.30 | 0.01 | 0.035 |
| dark_rate | 0.70 | 0.70 | 0.30 | 0.70 | 0.05 |
| white_range | 0.98 | 0.98 | 1.00 | 0.98 | 0.98 |
| update_wp | 1 | 0 | 1 | 2 | 3 |
| max_luminance | 65536.00 | 65536.00 | 65536.00 | 65536.00 | 65536.00 |
| min_luminance | 0.00391 | 0.00391 | 0.00391 | 0.00391 | 0.00391 |
The maximum value i (yet) found for the update_wp member, was 5
The values in the table might make no sense right now, but those are the values used later(bright_rate, dark_rate & whtie_range) during the Tone Mapping step.
Totally Not Important Note
- This step is totally absent from the game’s main menu (aka title screen). Despite the fact that the main menu is a 3d world with 3d deferred pass & full post process stack.
- Pause menu is okay (which is expected).
- While some frames demonstrated in that section were from Cinematics, but still, some cinematic shots have the Histogram Adjustment totally absent too.
GPU Cluster Culling [Compute]
Yet another important pass that is a compute pass with nothing to show..As the name implies, it’s GPU cluster culling for the world content by doing frustum tests…a lot of them (or as the engine refer to it as MiniClusterFrustumTest)
Culling World
struct CullingWorld
{
	float4x4 cullingWorldMat;
	uint cullingMiniClusterCount;
	uint cullingMiniOffsetIndex;
	uint2 cullingdummy;
}
Instance Bounding Buffer
struct InstanceBounding
{
	float3 mBoundaryMin;
	int mClusterOffset;
	float3 mBoundaryMax;
	int mShadowClusterOffset;
}
GPU Volume
struct GPUVolume
{
	float3 Center;
	float3 AxisX;
	float3 AxisY;
	float3 AxisZ;
	float3 Scale;
	float mOutputAddress;
}
An array of that struct passed to the dispatches.
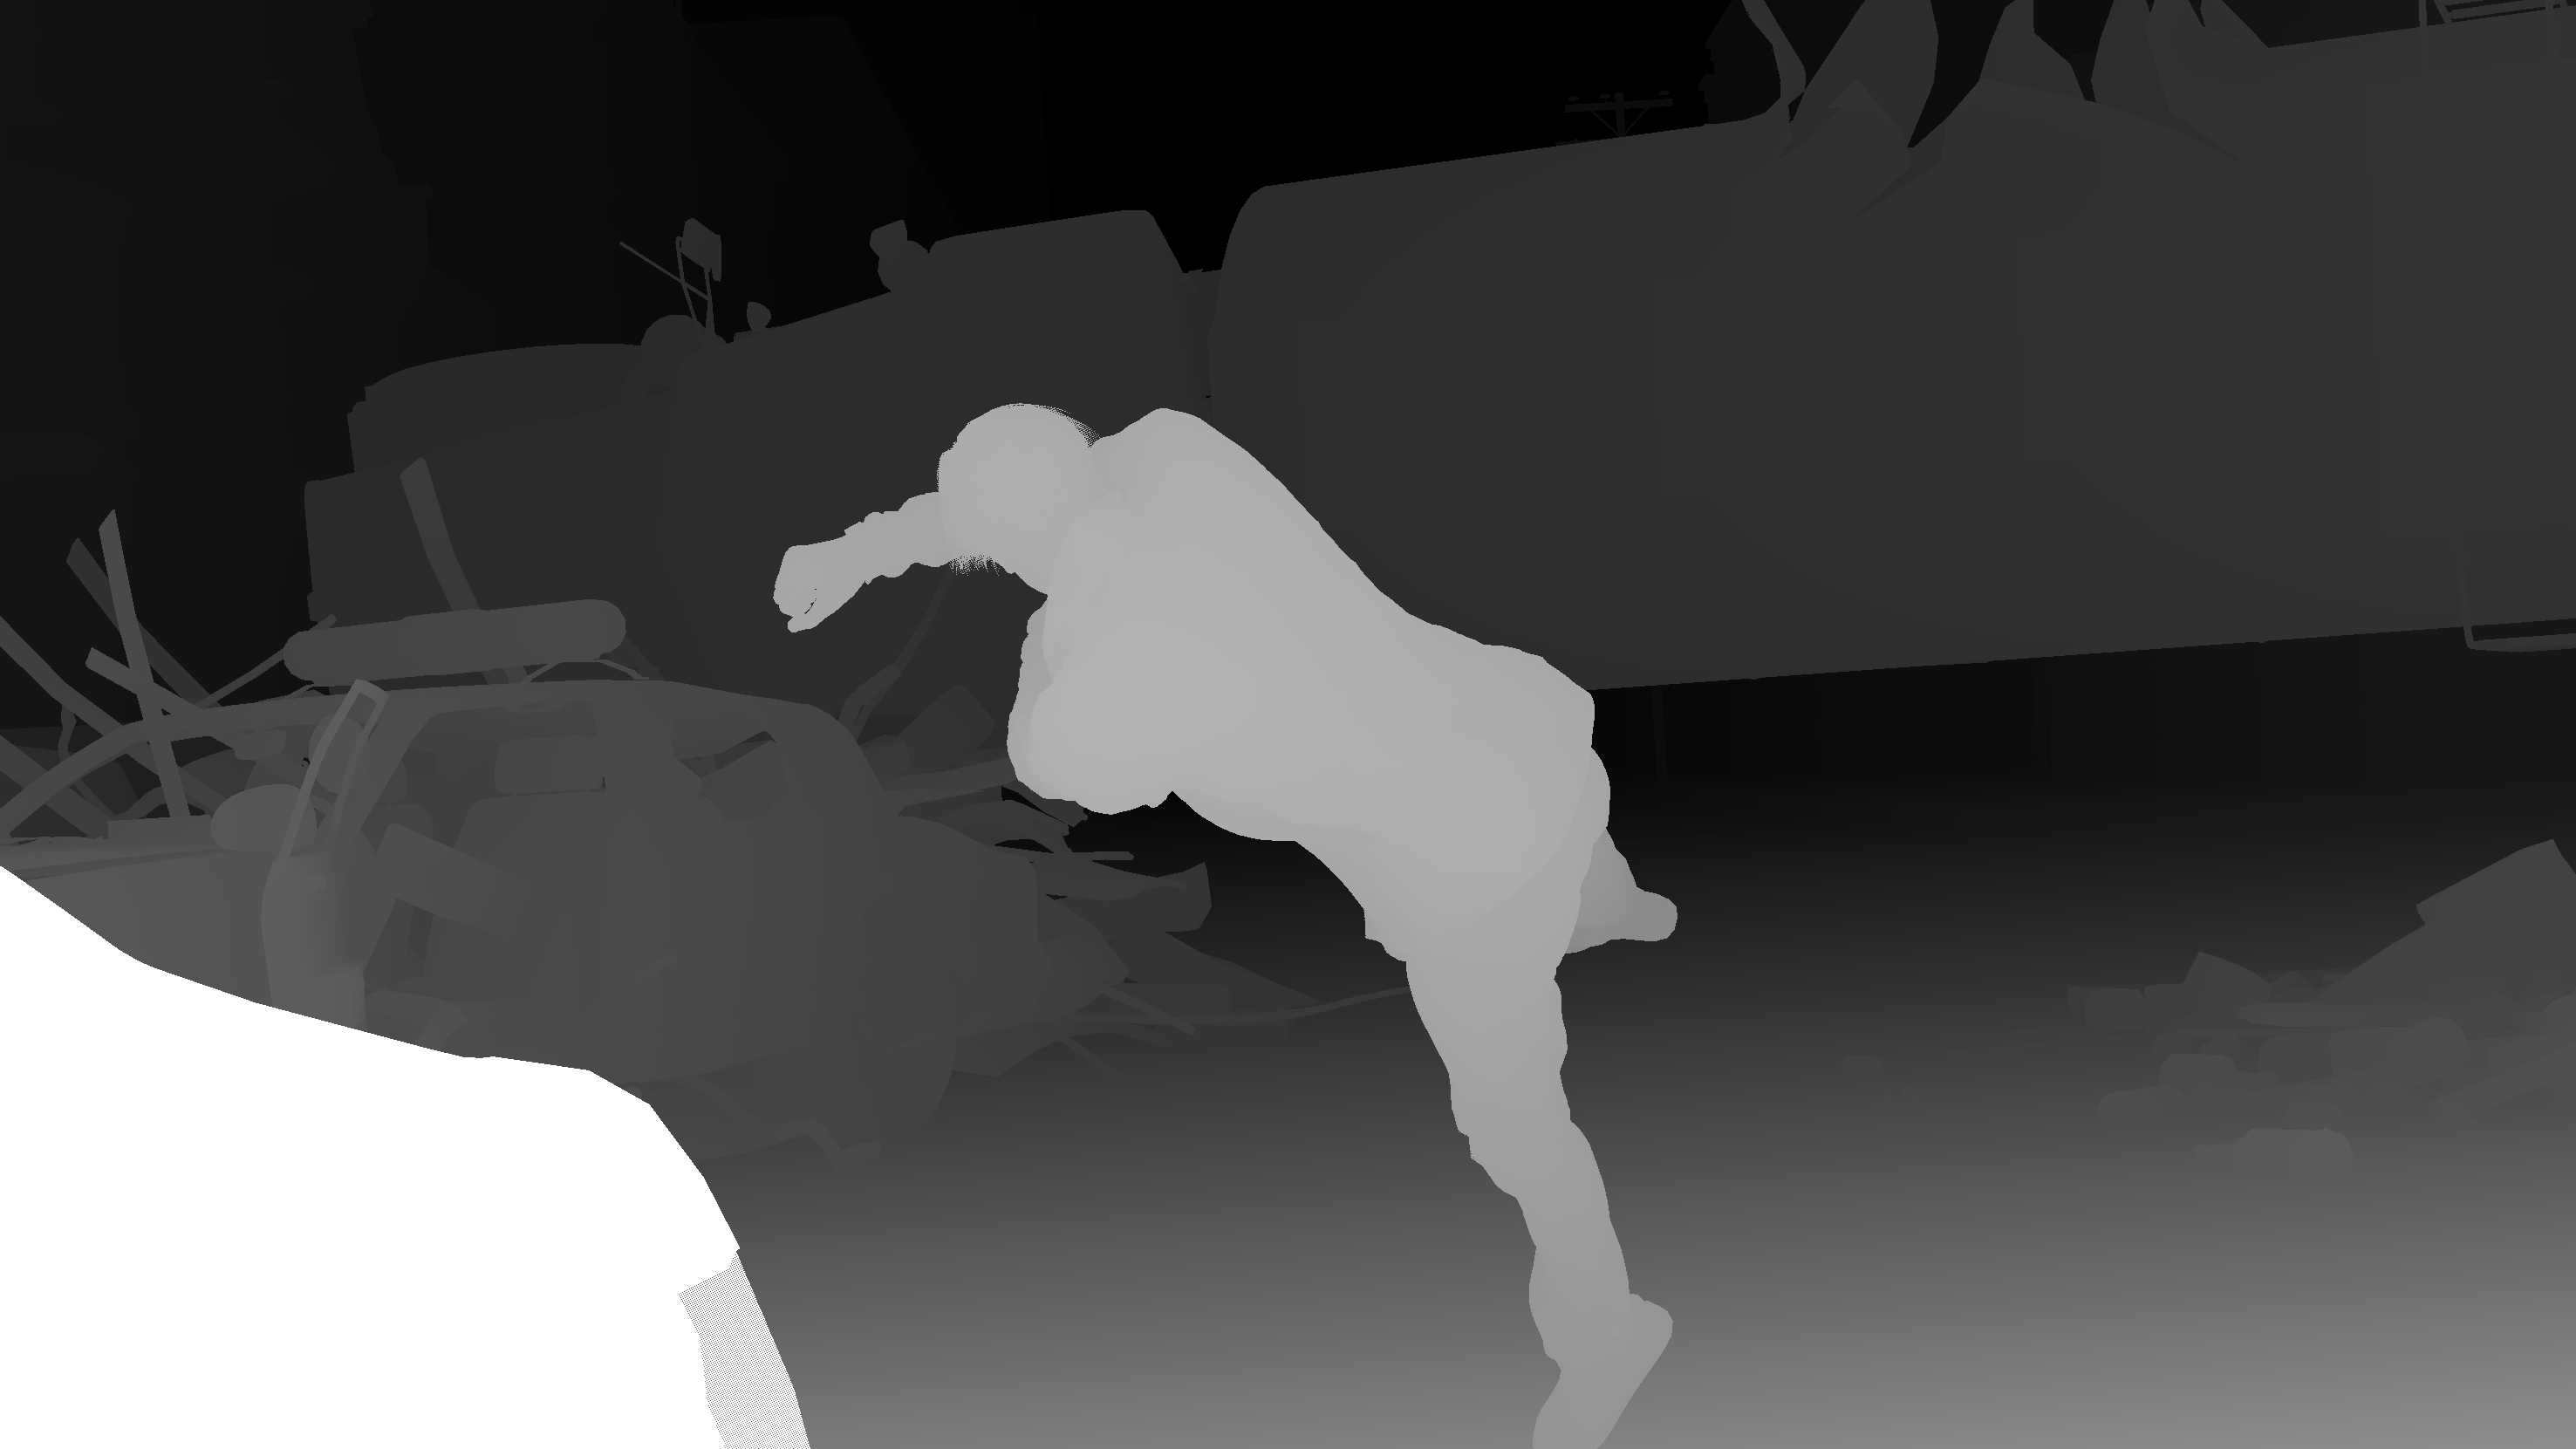
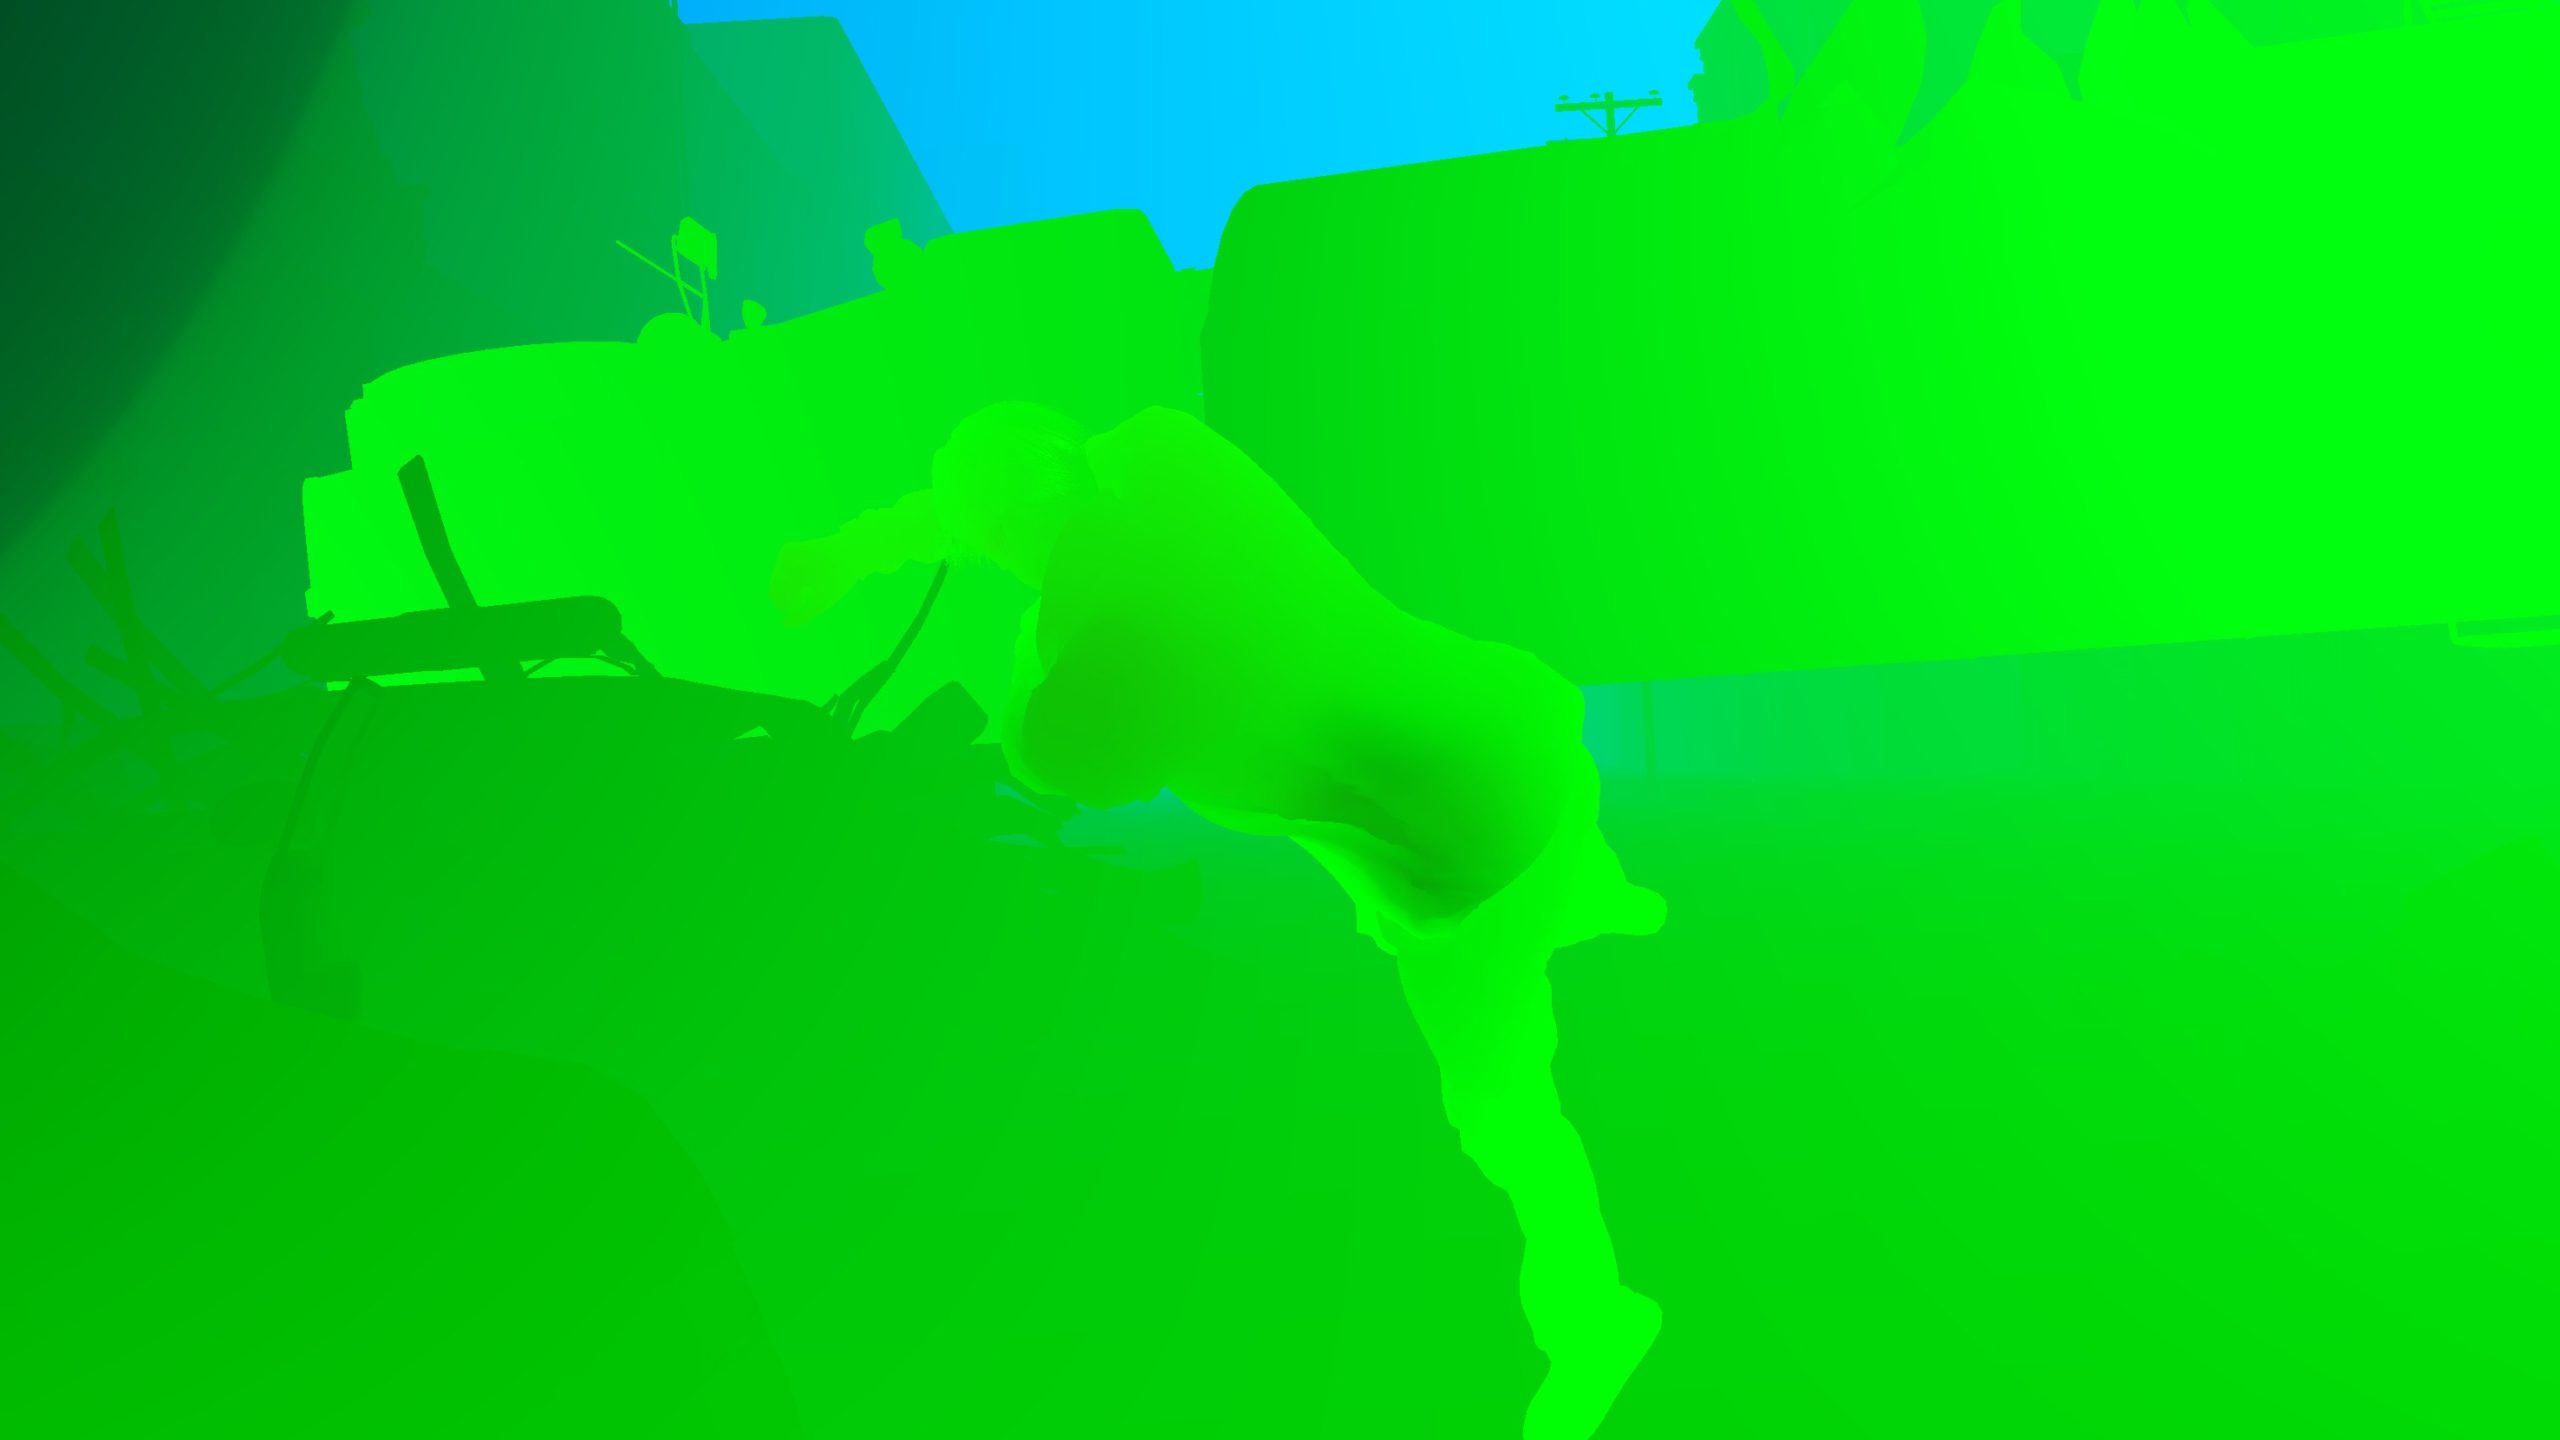
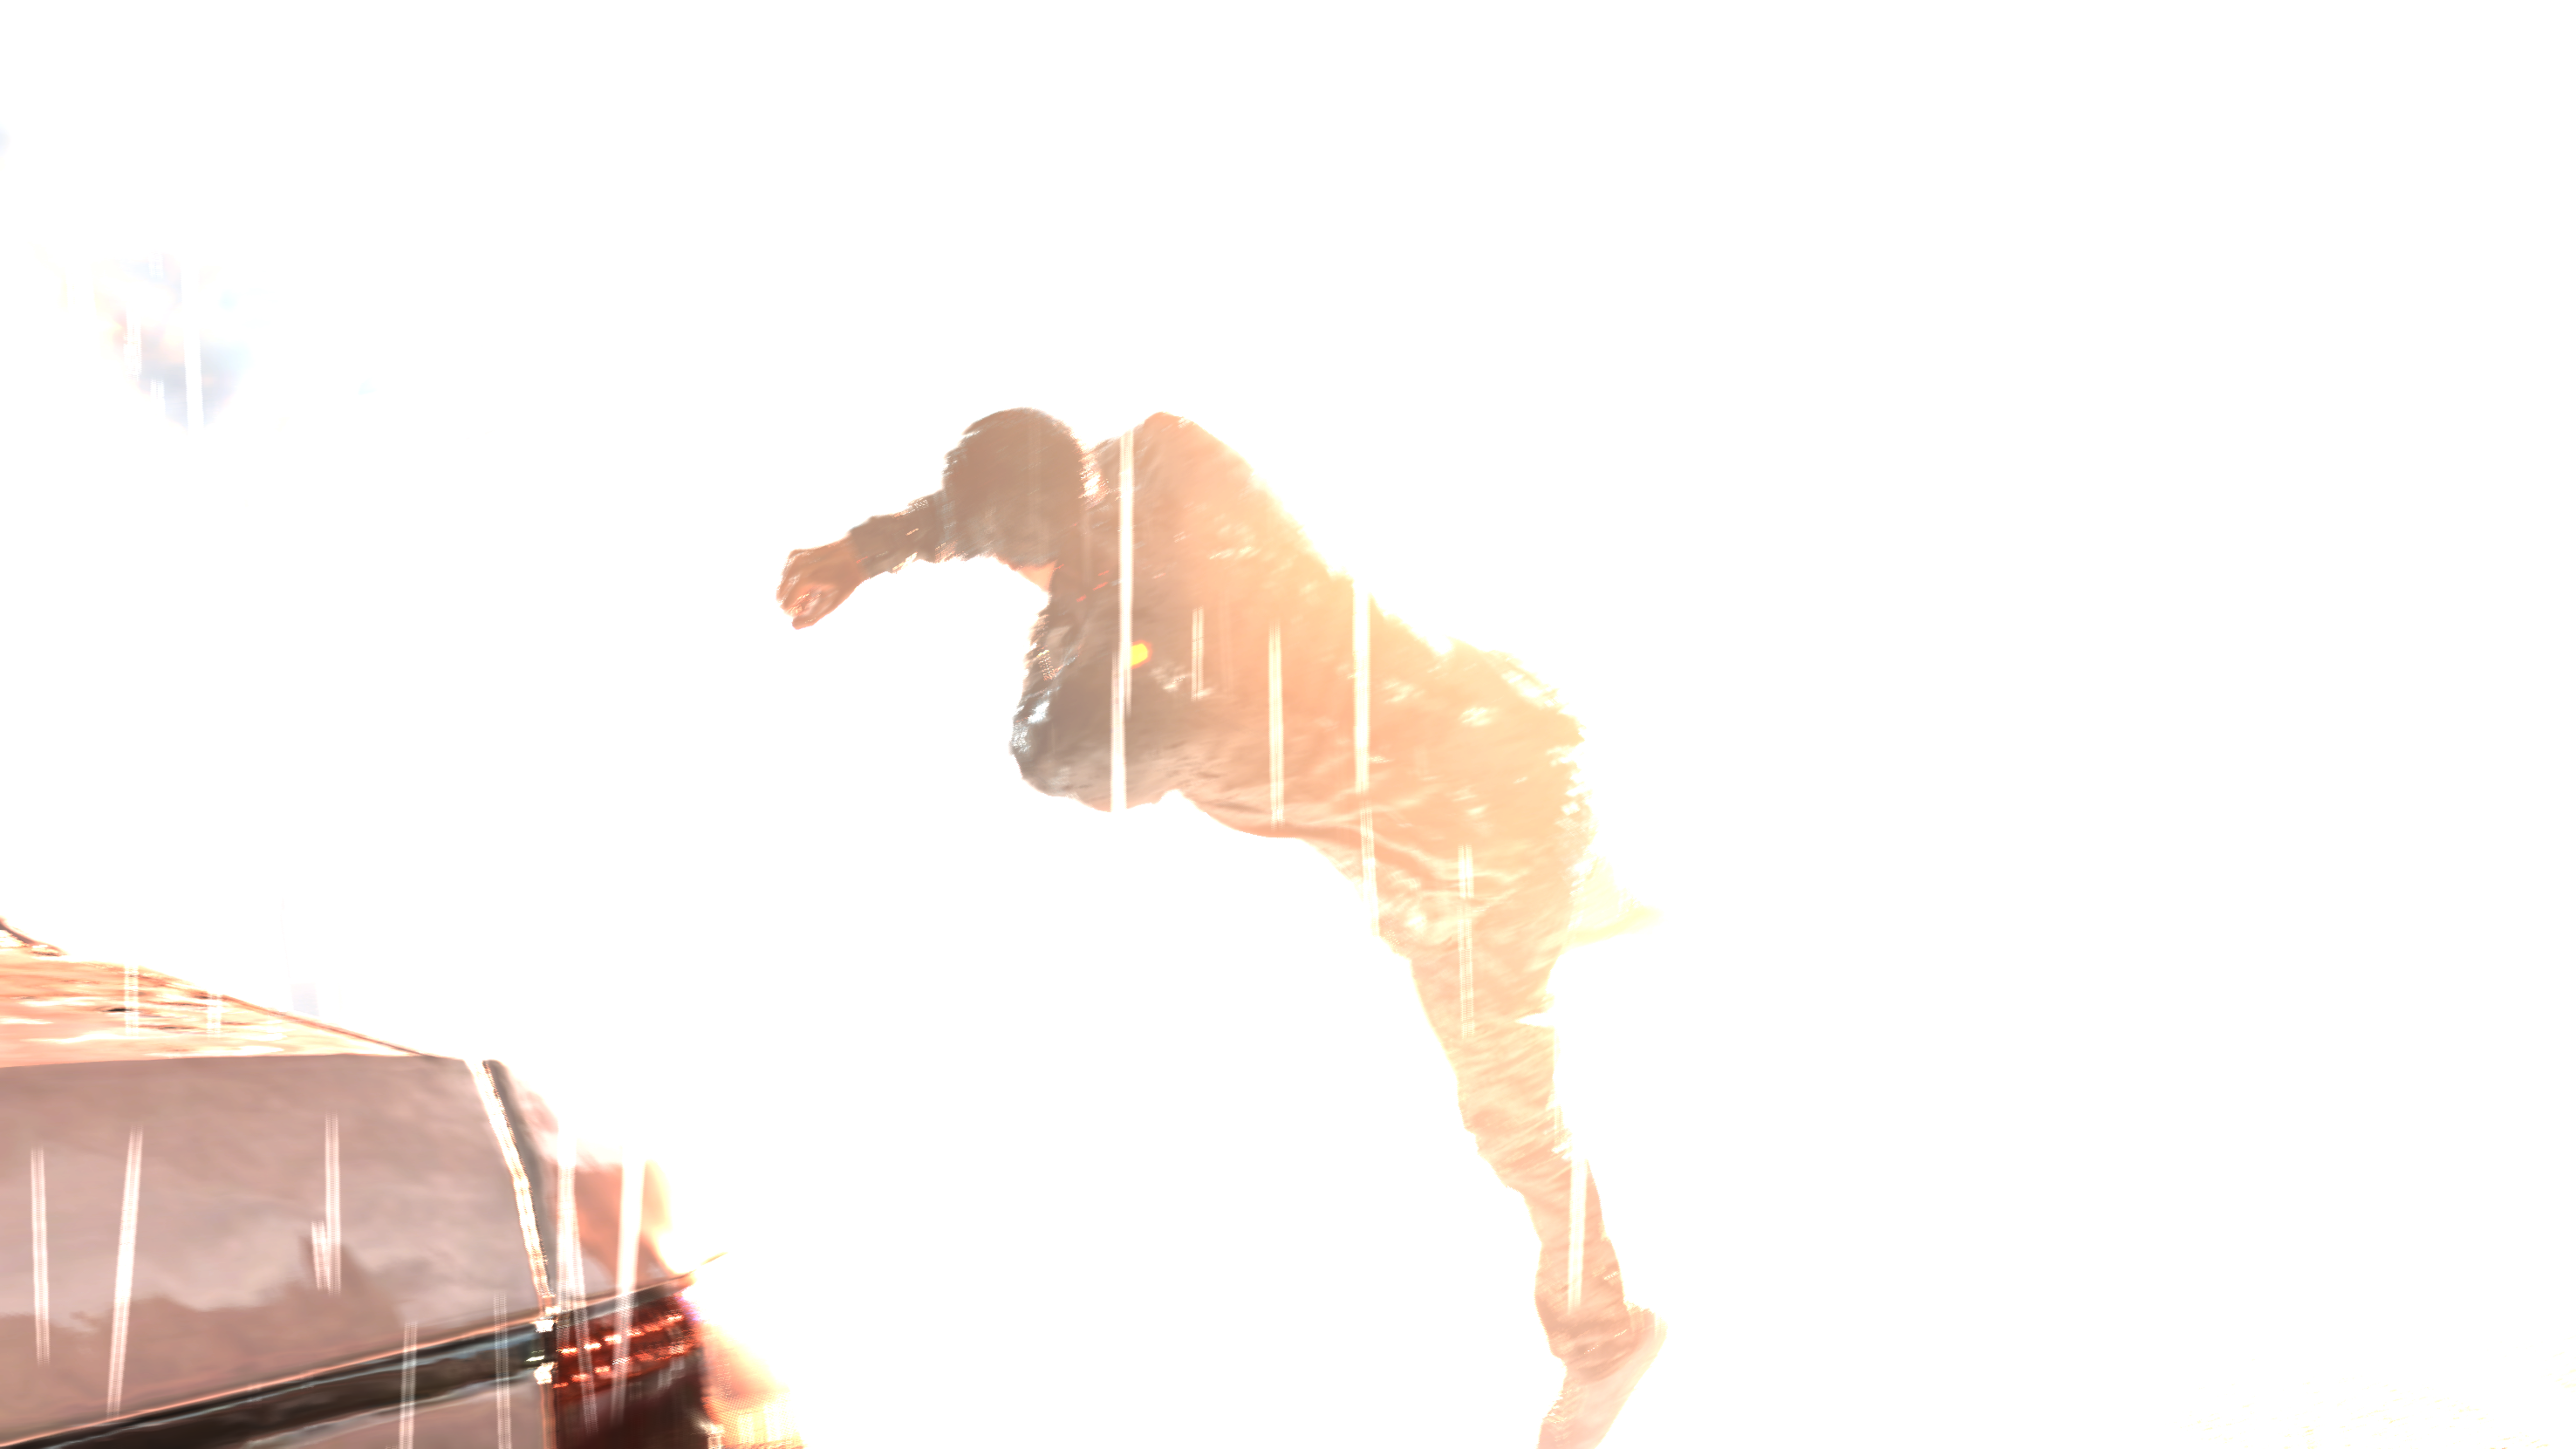
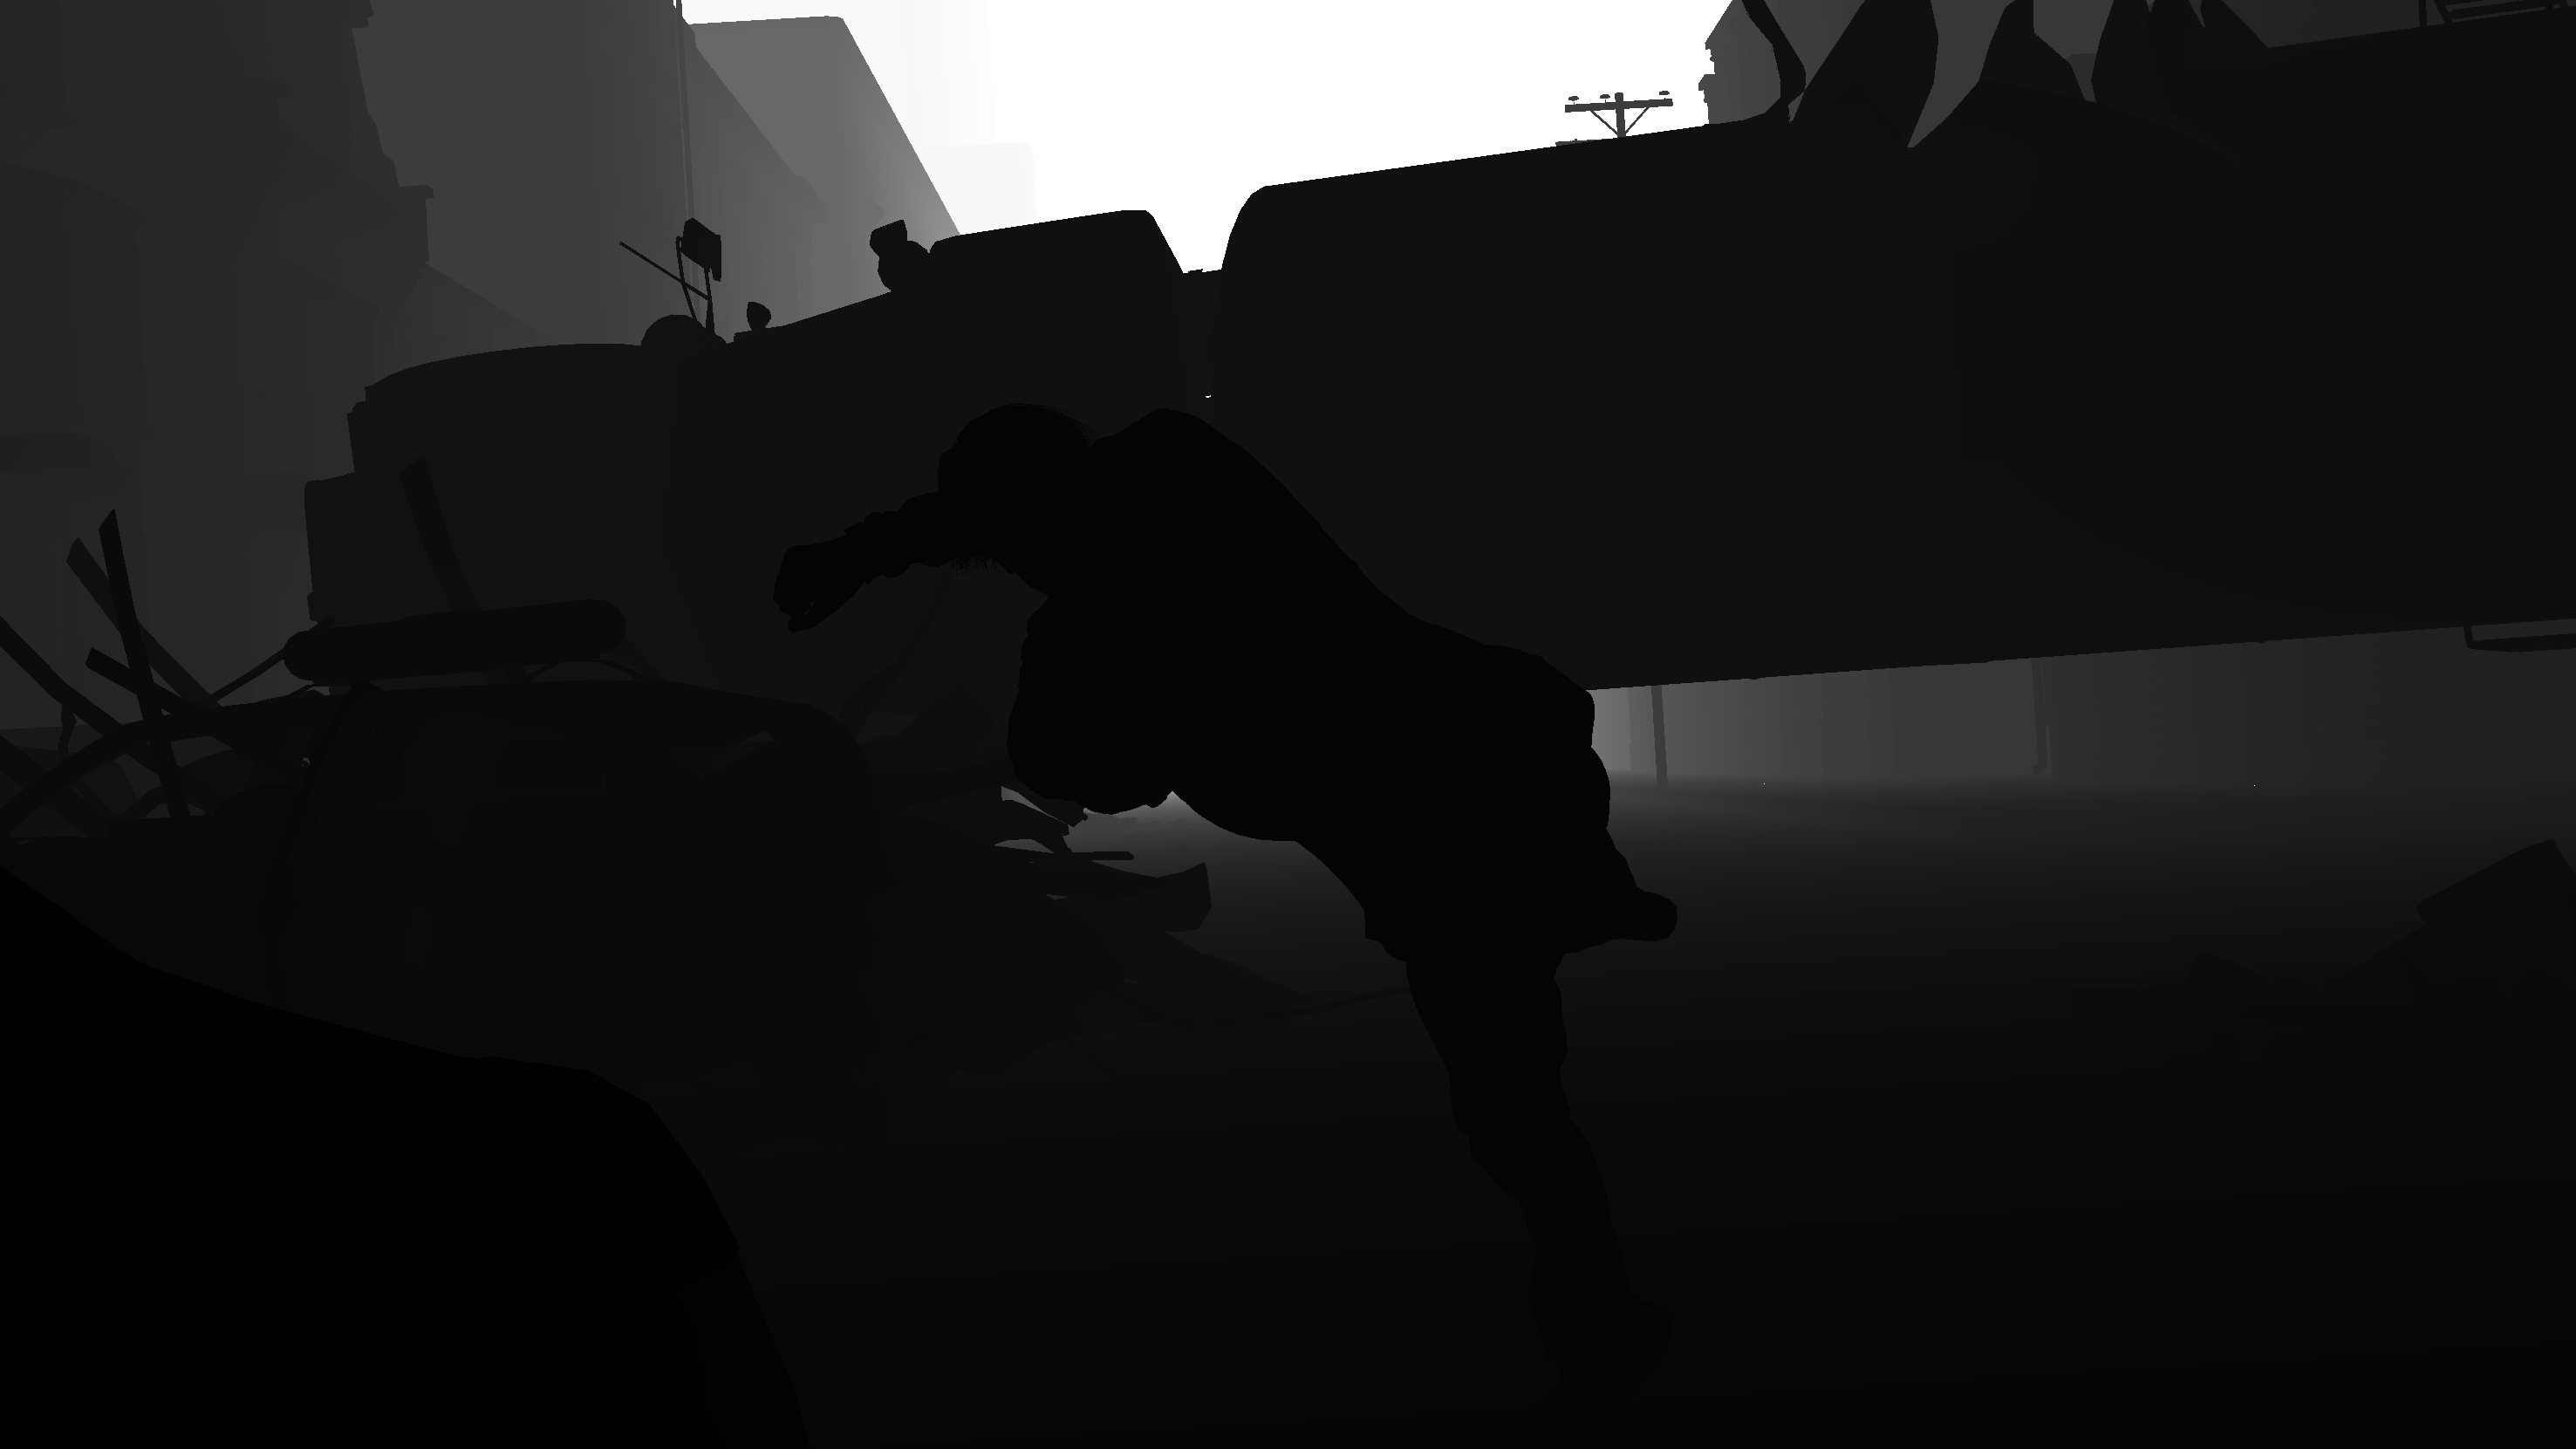
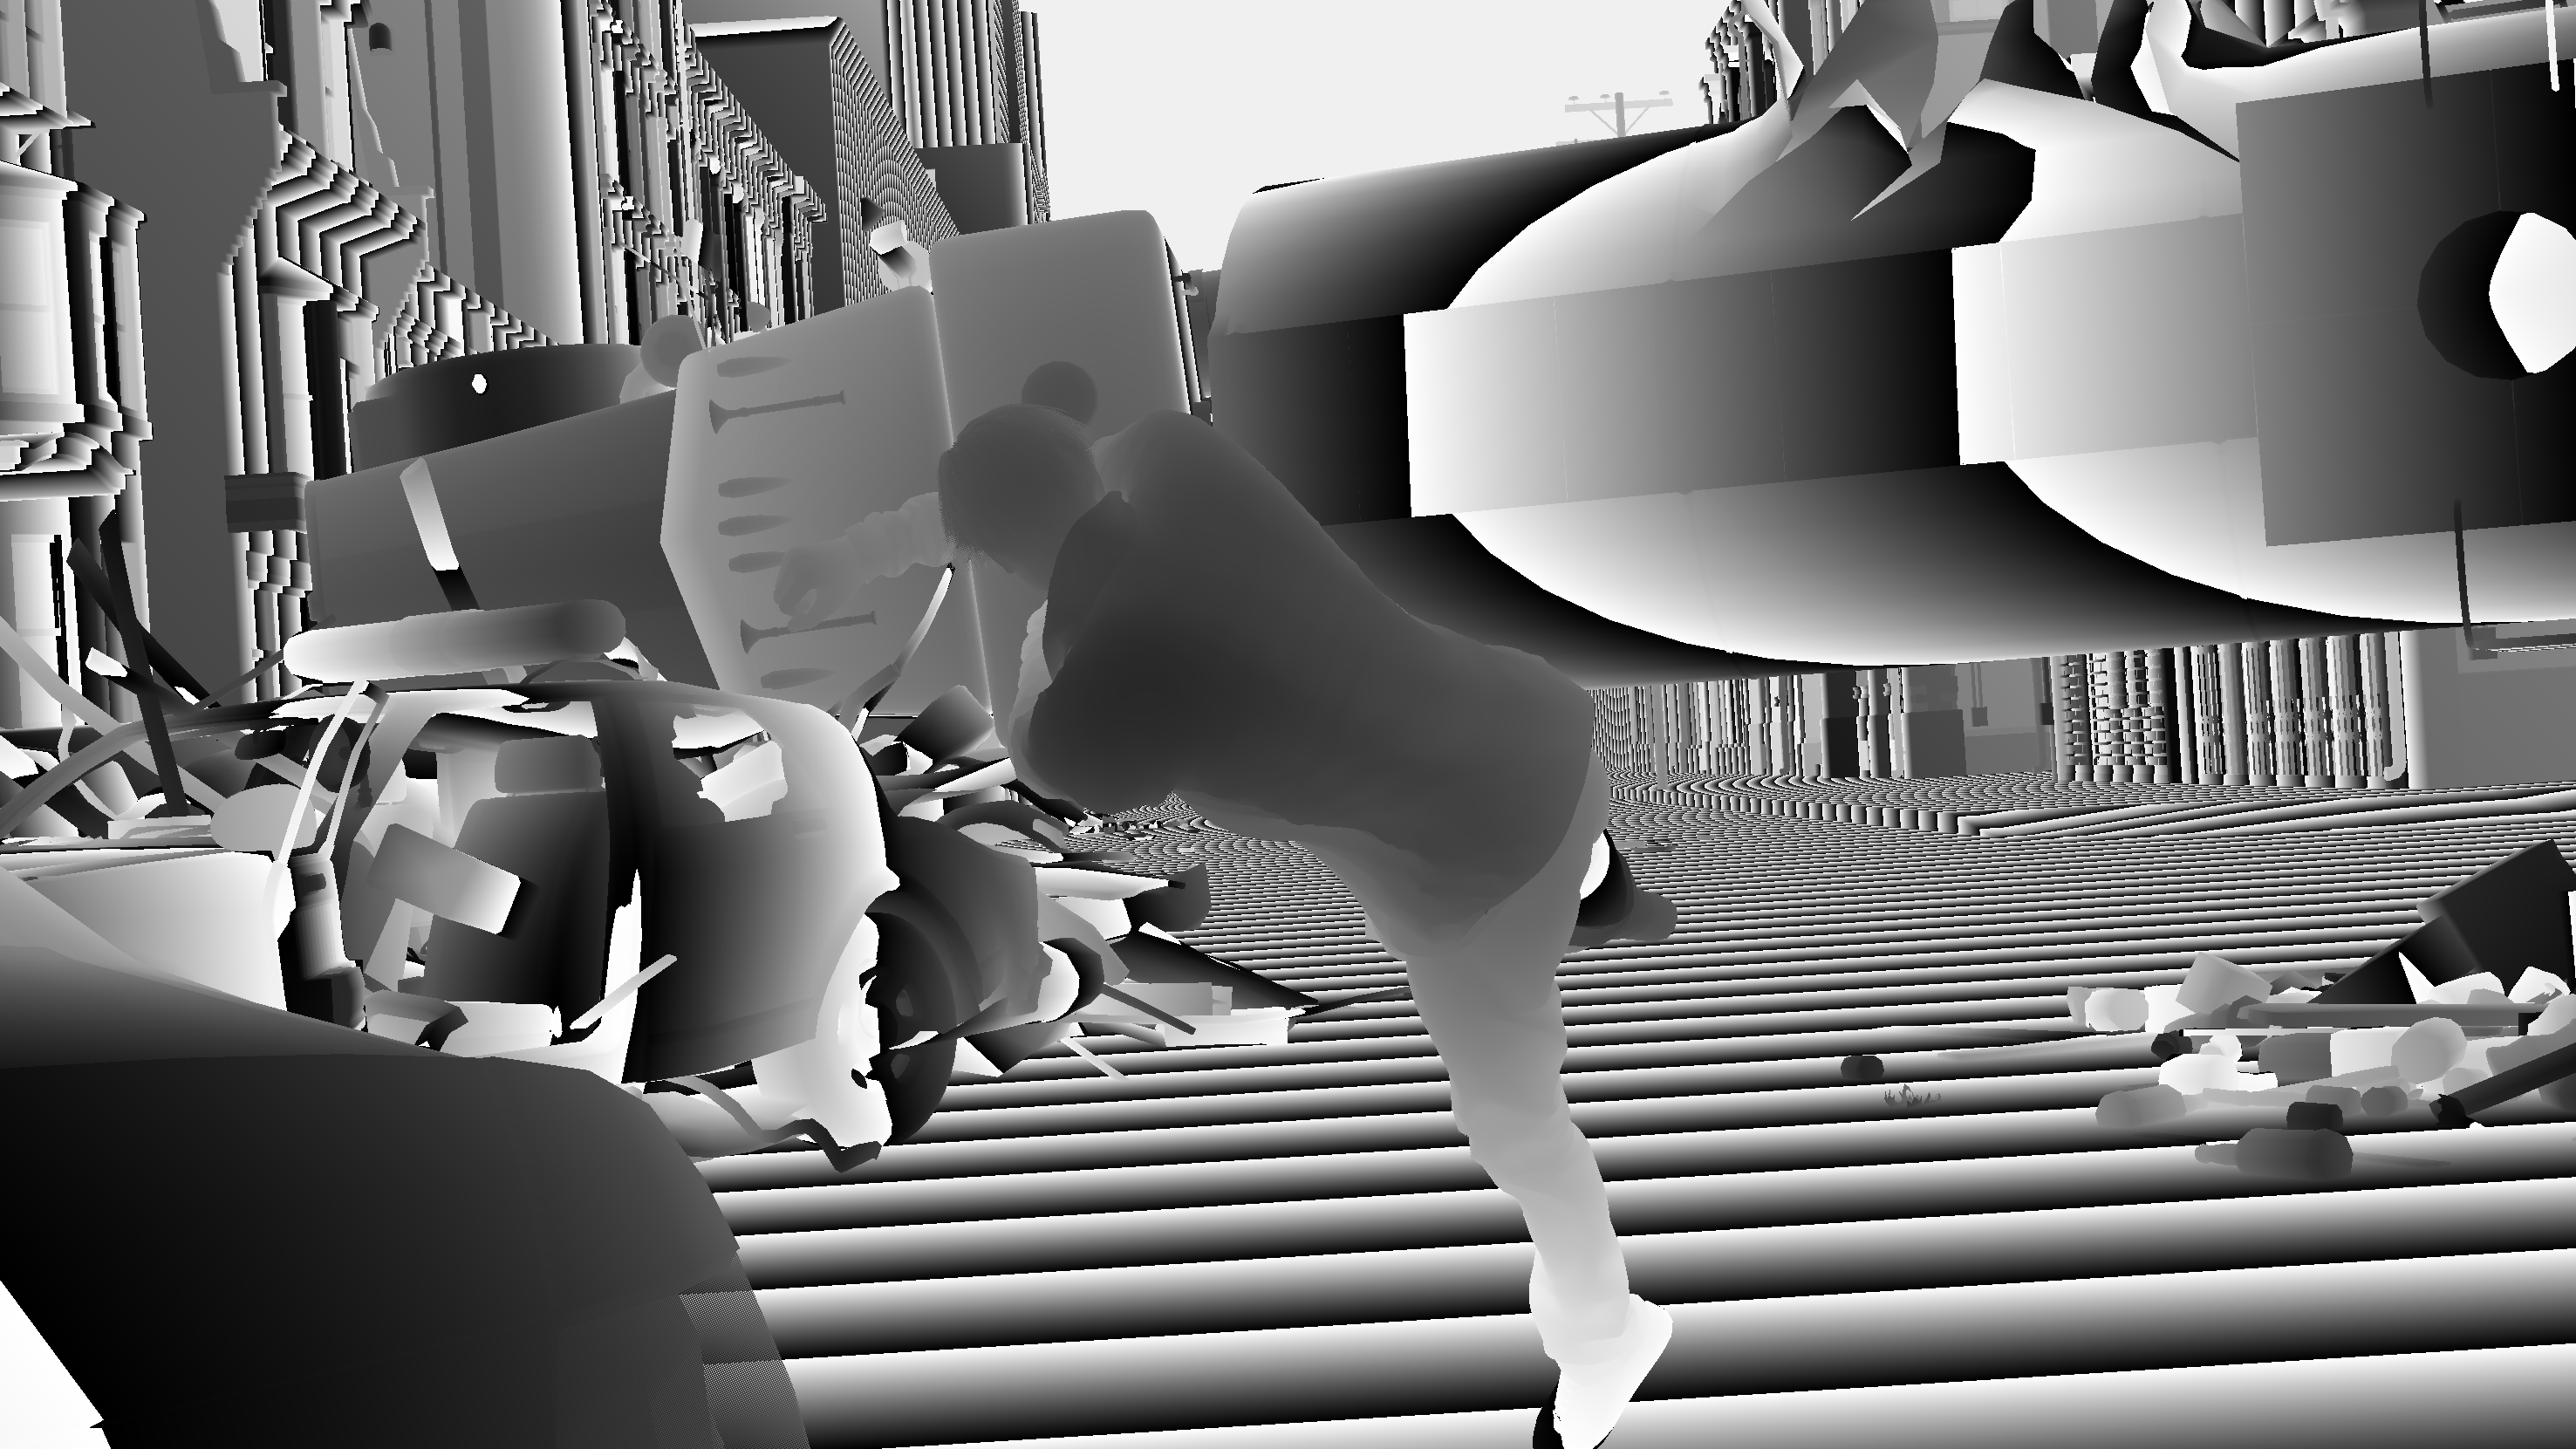
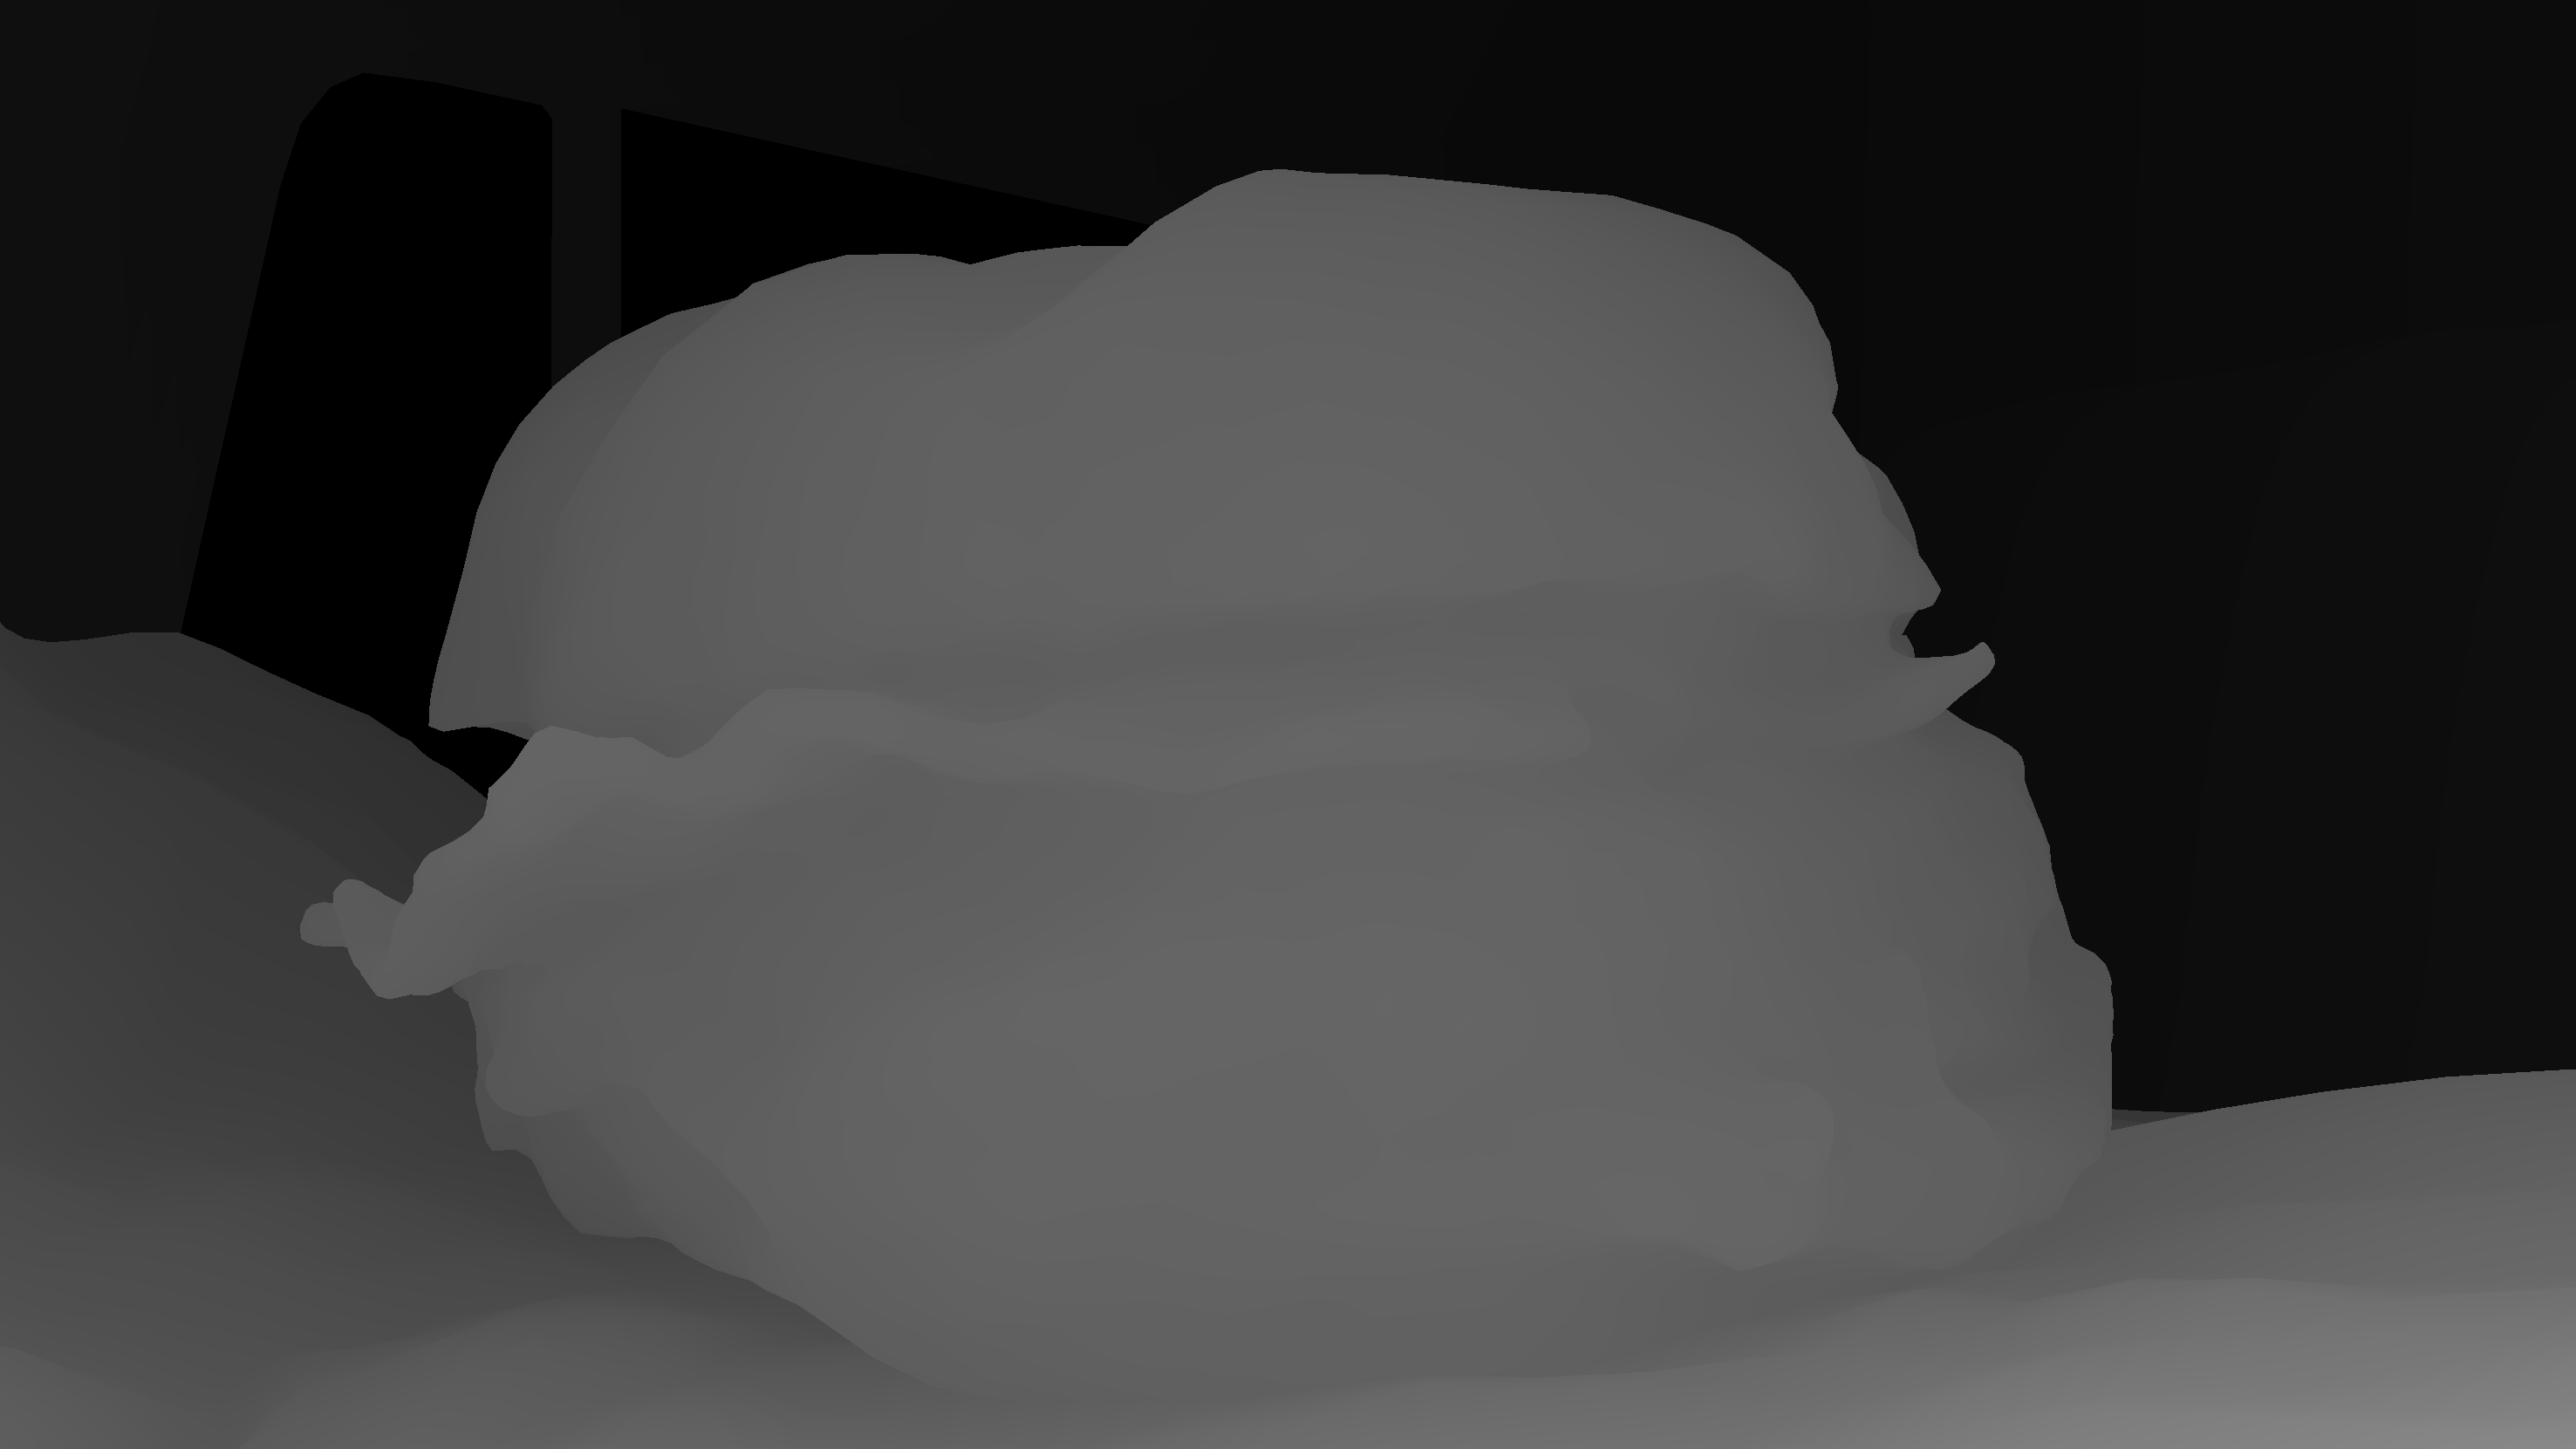
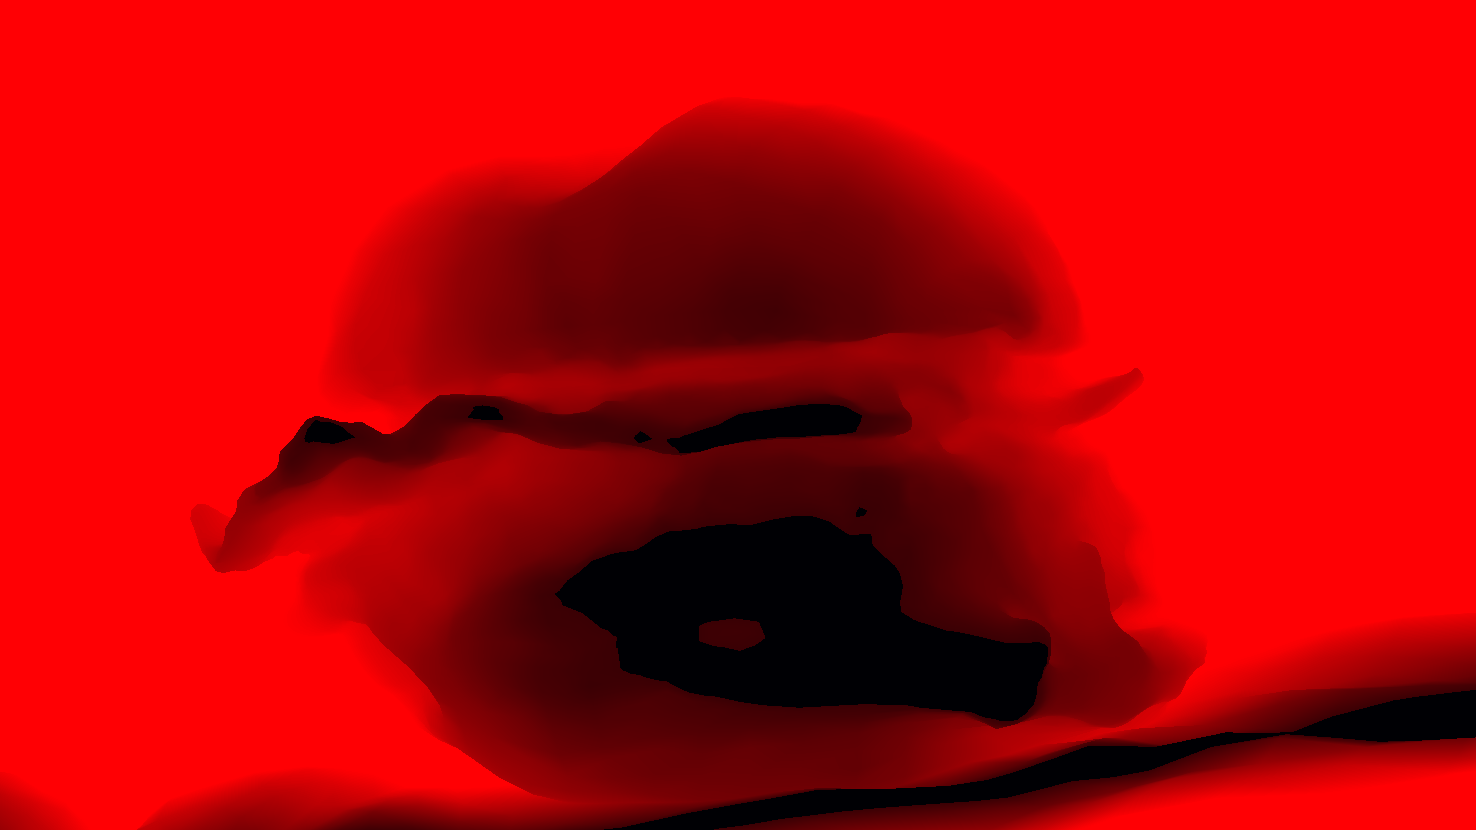
Occlusion Culling (NDC)
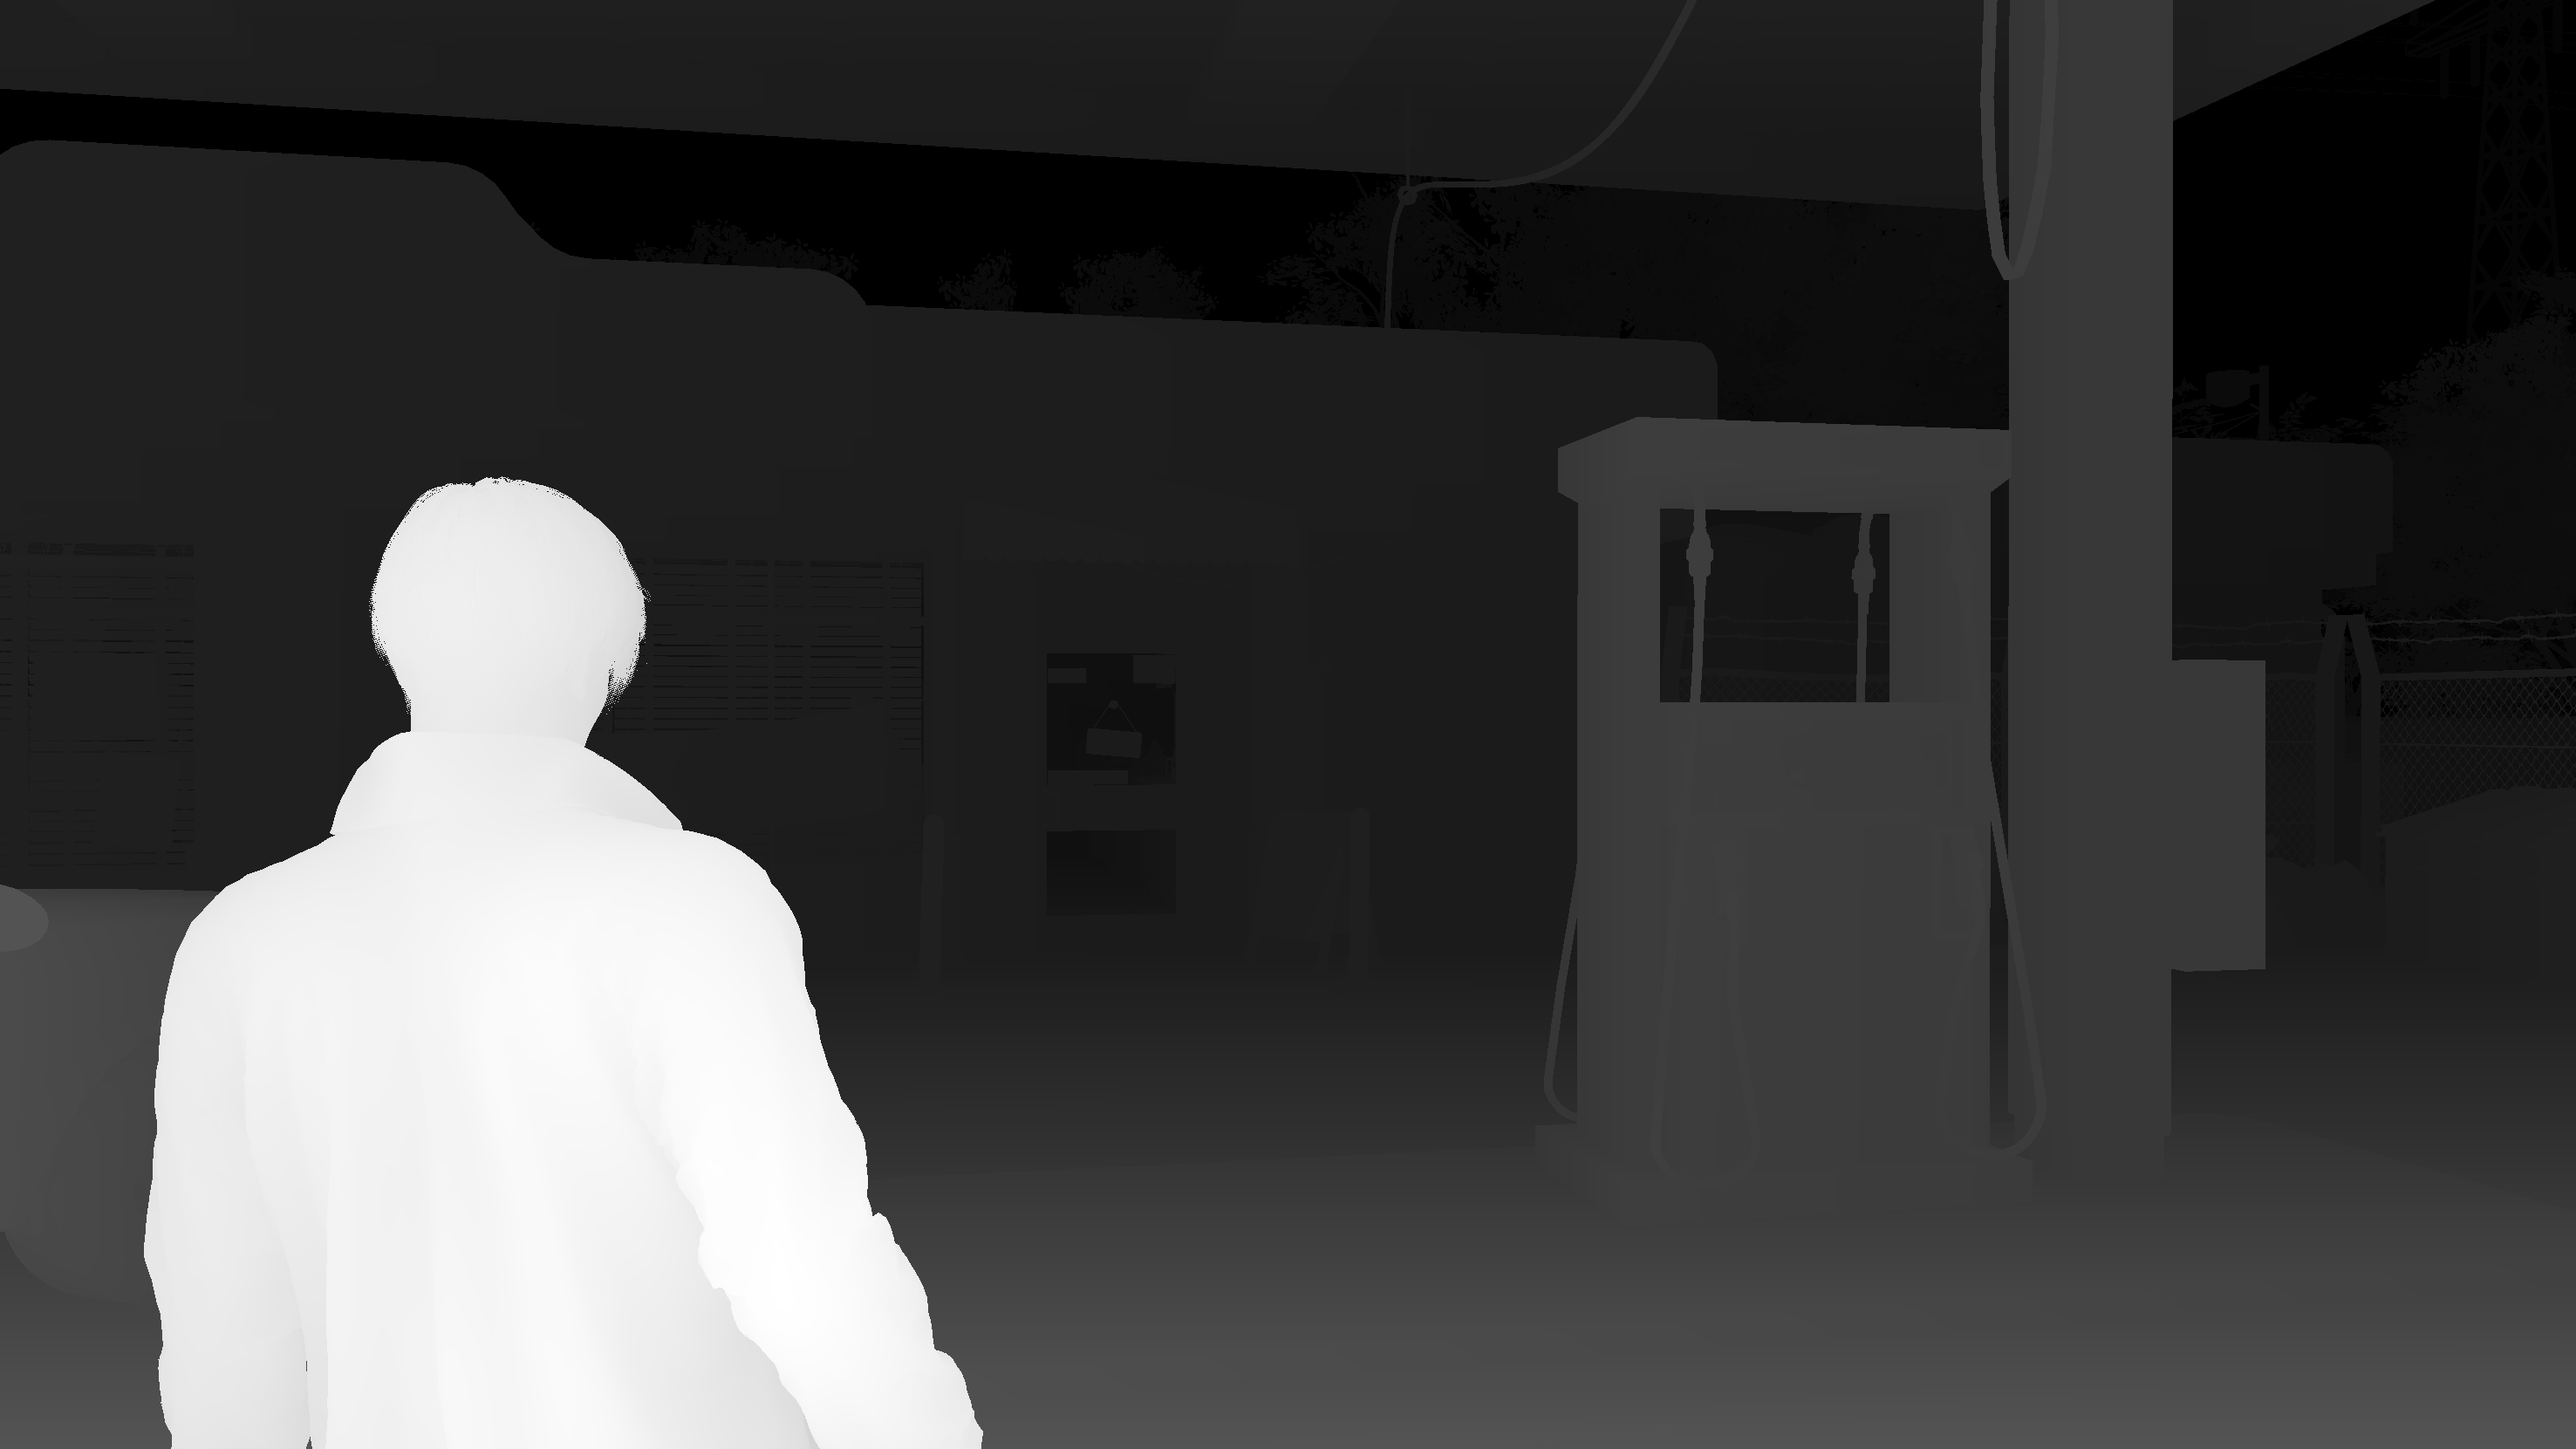
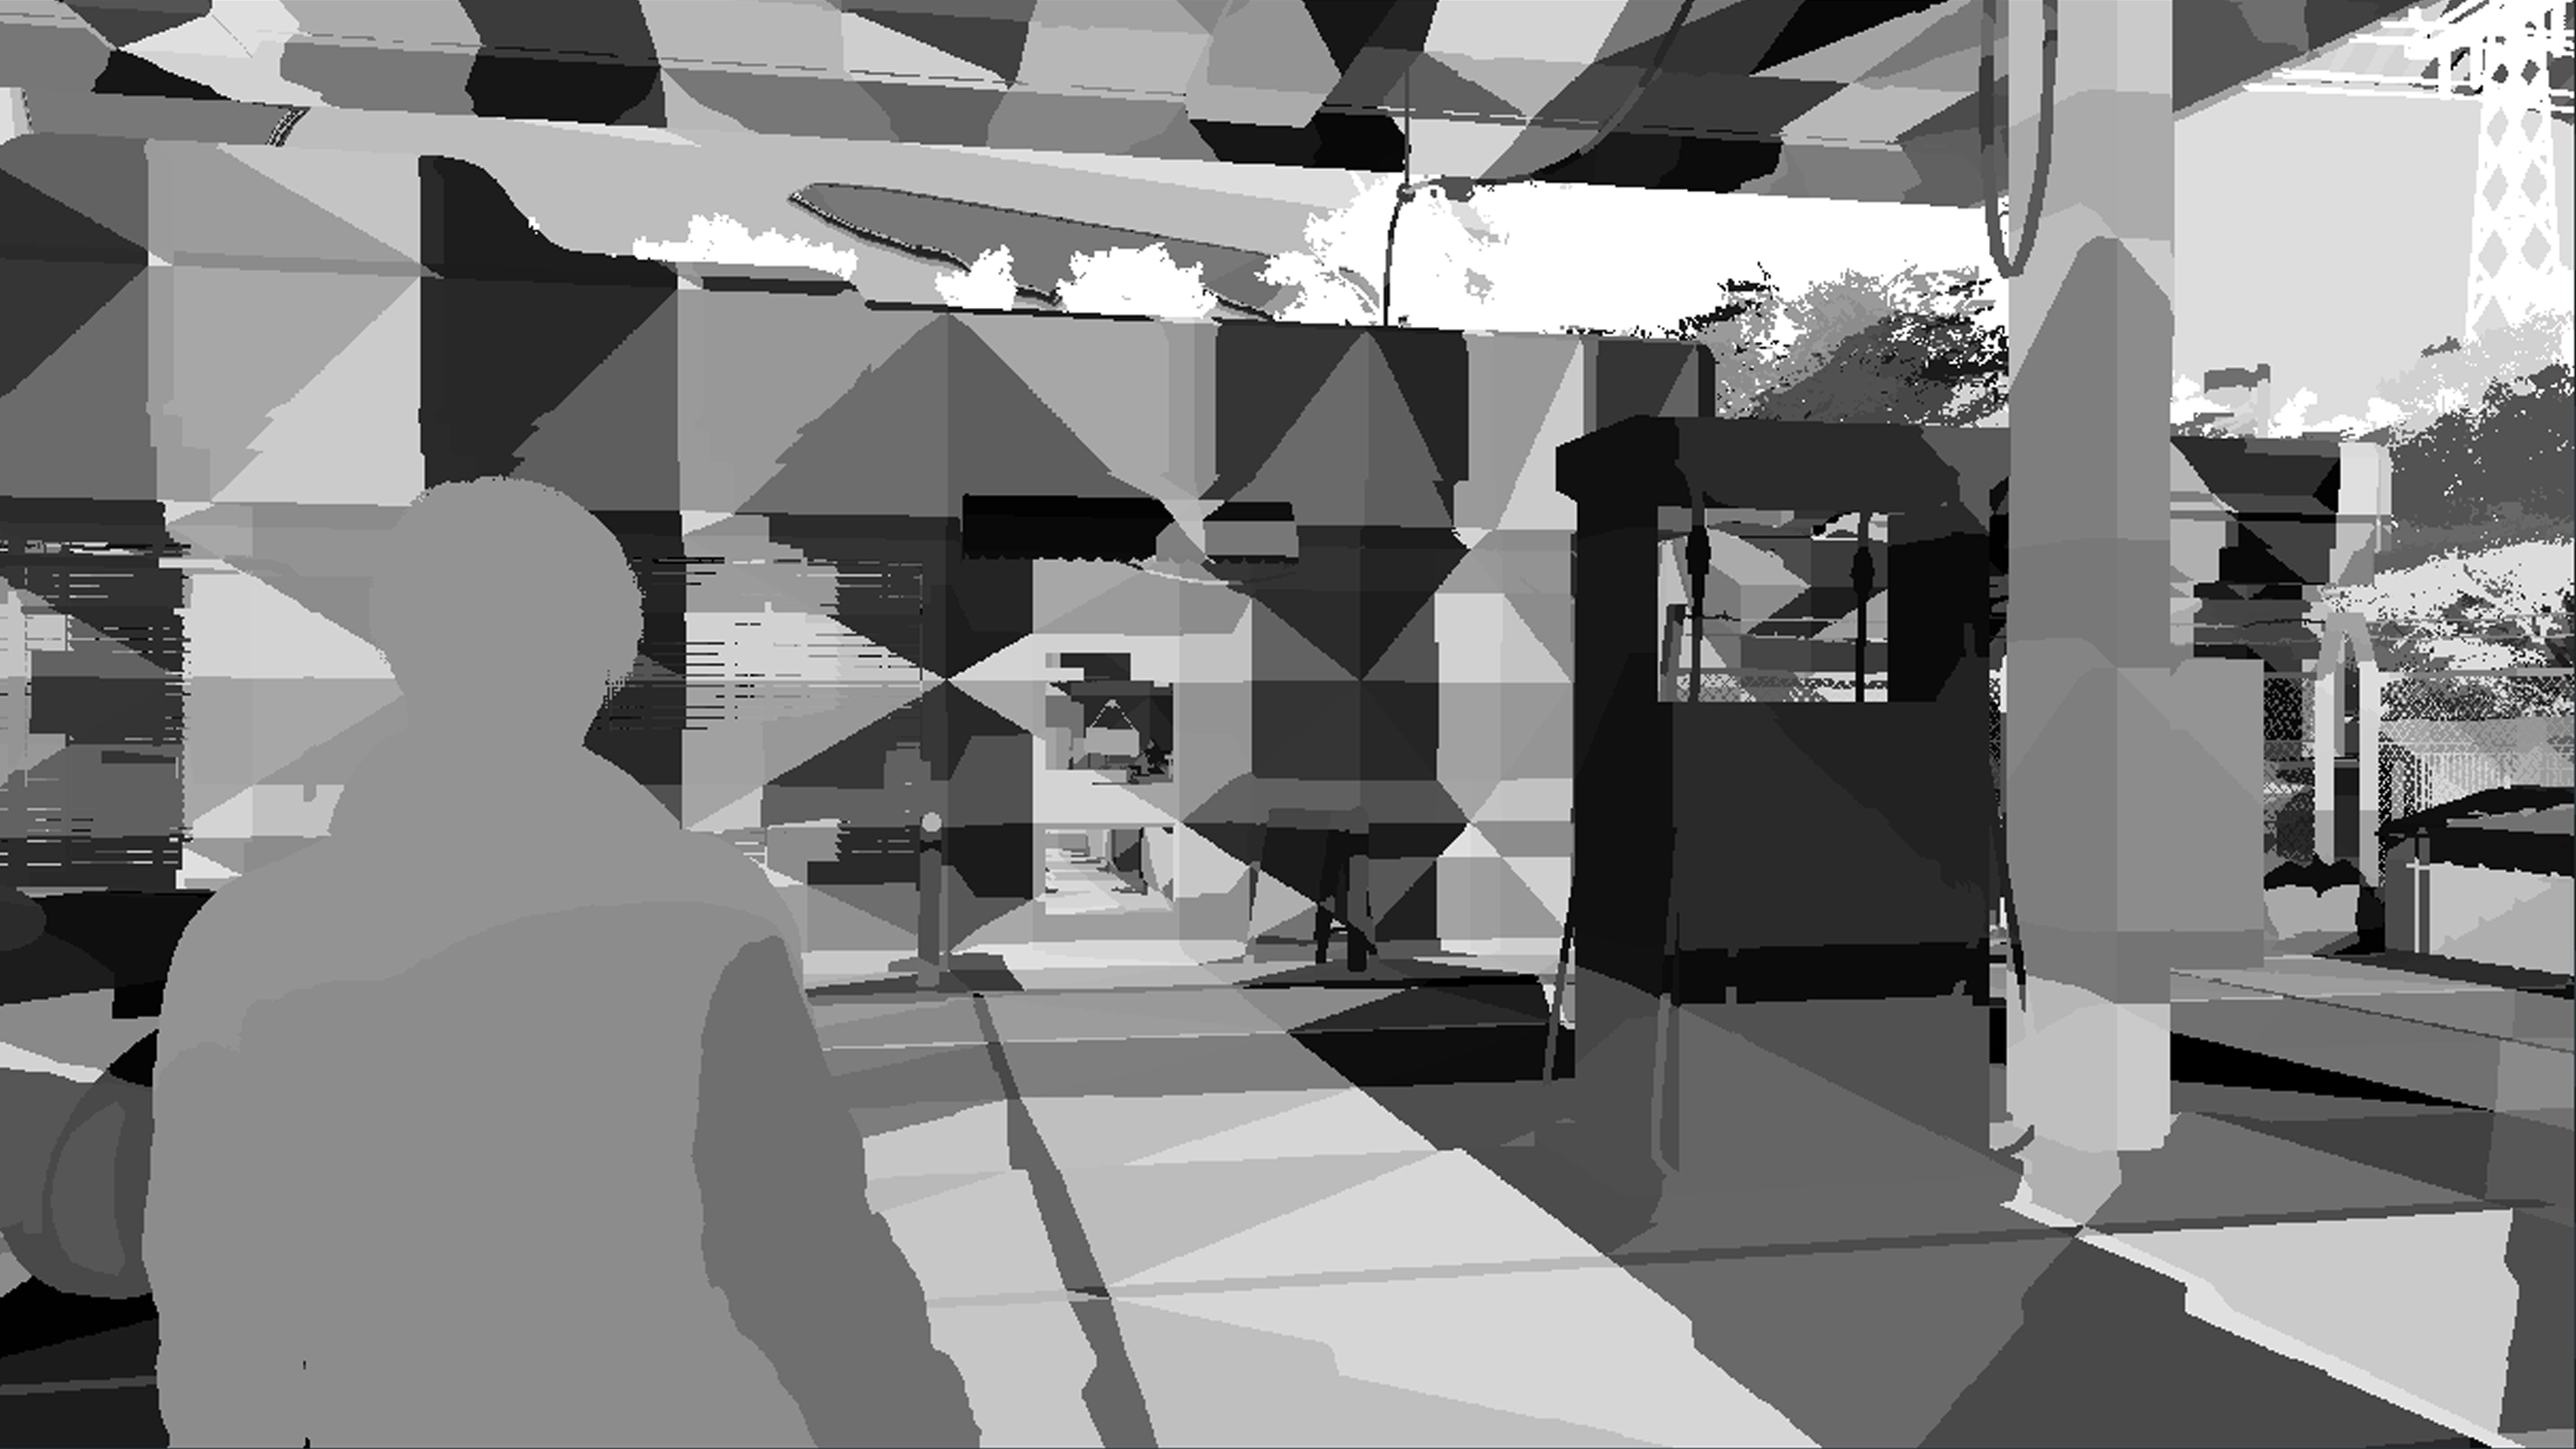
A quite useful and long depth pass of draws that is doing a form of Depth based Culling (it seem to be a hybrid between Coverage Buffer Occlusion Culling, Depth Tile Culling & Depth Pyramid Culling”HiZ“), it seems to be taking inspiration from each type in one aspect. It takes place in two phases, the 1st and longest one is the depth testing, where basically the engine will be render occluder to zbuffer , the renderer refers to this step as MiniClusterOcclusionTest. Then the 2nd step is where the engine test AABB of entities around the map (or what left of the cluster culling to be more accurate) against zbuffer for occlusion culling, which possibly referred to as CullVolumeOccluder step.


Testing & drawing occluders of course is not happening in a sudden, and it takes quite sometime to do one by one.


The reason i did not bias more towards saying it’s a “Depth Pyramid Culling”, is the fact that the occluders depth target is not having any mips as it is known for that type of depth occluding, instead it store different values in the different samples! But also the fact of the existance of those “accumulateion” samples, i couldn’t either say it is 100% “Coverage Buffer Culling” or “Depth Reprojection”.


So, is it 4 samples instead of 4 mips!


Also keep in mind that the Occluder rendertarget above is “upscaled” for the sake of demonstration. But in reality, it is fairly small, the version at the side is the real one. i do prefer to always keep a linearly upscaled version, because it makes more sense for me when i think viewport “tile” wise.
If those occluder rendertargets make no sense for a moment, just compare them with the final swapchain, and then they make perfect sense. Or perhaps the gifs below makes it more clear.


Anyways, that’s not the first or the last inspiration from Crytek & CryEngine you would see today!
Instancing [Compute]
Instancing is a two distinctive phases process, the heavy part comes at first in this compute pass, followed by the drawing part in fragment shader as part of the next pass. The entire process can be referred to as “Compaction”, which is taking place in 3 sequential steps (compute shaders)
– Instancing Compaction
– Mini Cluster Compaction
– DrawIndirect Argument Fill
Just prepare instancing data/buffers through instance draw & multi draw structs, the interesting take here, it takes place for the deferred light sources as well, in order to prepare to the deferred pass coming shortly.
IDI
struct InstanceDrawInfo
{
	int instanceCountMultiCount;
	int instanceDataByteOffset;
	int indirectIndicesBufferByteOffset;
	int reserved;
}
Array of struct. Always 8192 elements.
MDI
struct MultiDrawInfo
{
	int multiCount;
	int instanceDataByteOffset;
	int countByteOffset;
	int MultiDrawInfo_reserved;
}
Array of struct. Always 8192 elements.
Light Parameter
struct LightParameter
{
	float position;
	float boundingRadius;
	float direction;
	float falloff;
	float attenuation;
	float color;
	float tolerance;
	float shadowIndex;
	float iesId;
	float reserved;
}
Array of struct. Always 512 elements.
Indirect Drawing
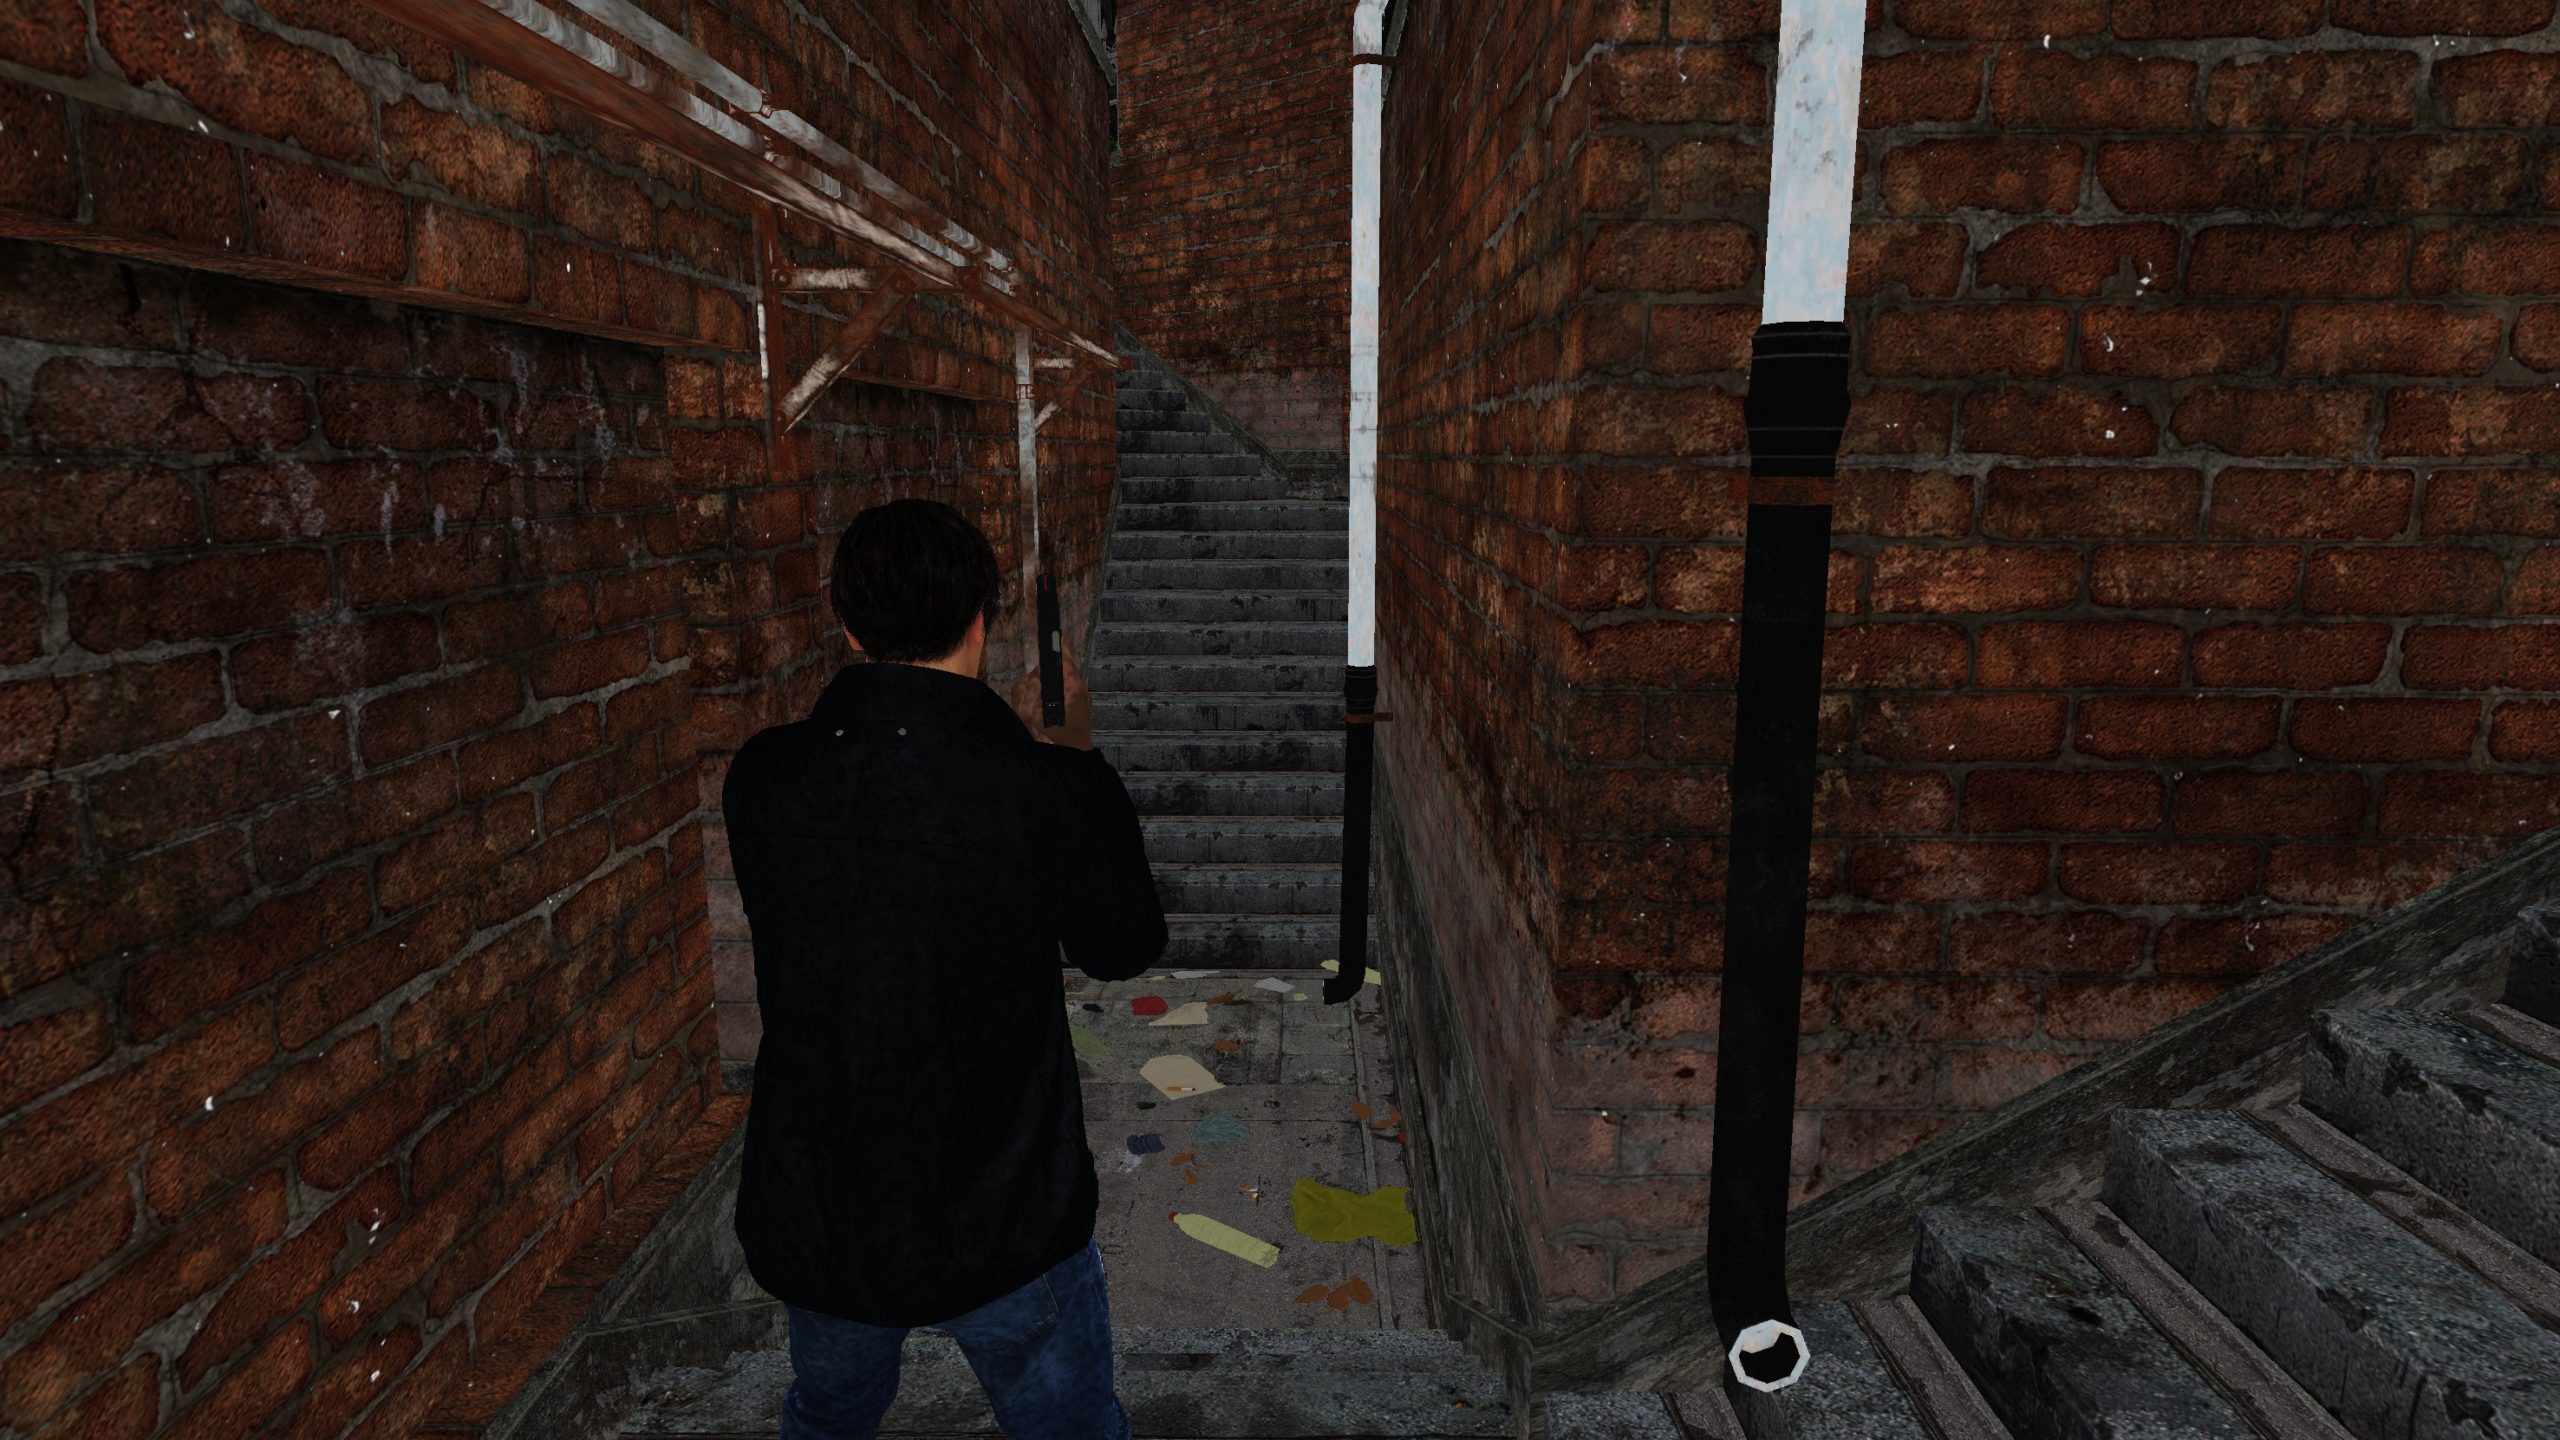
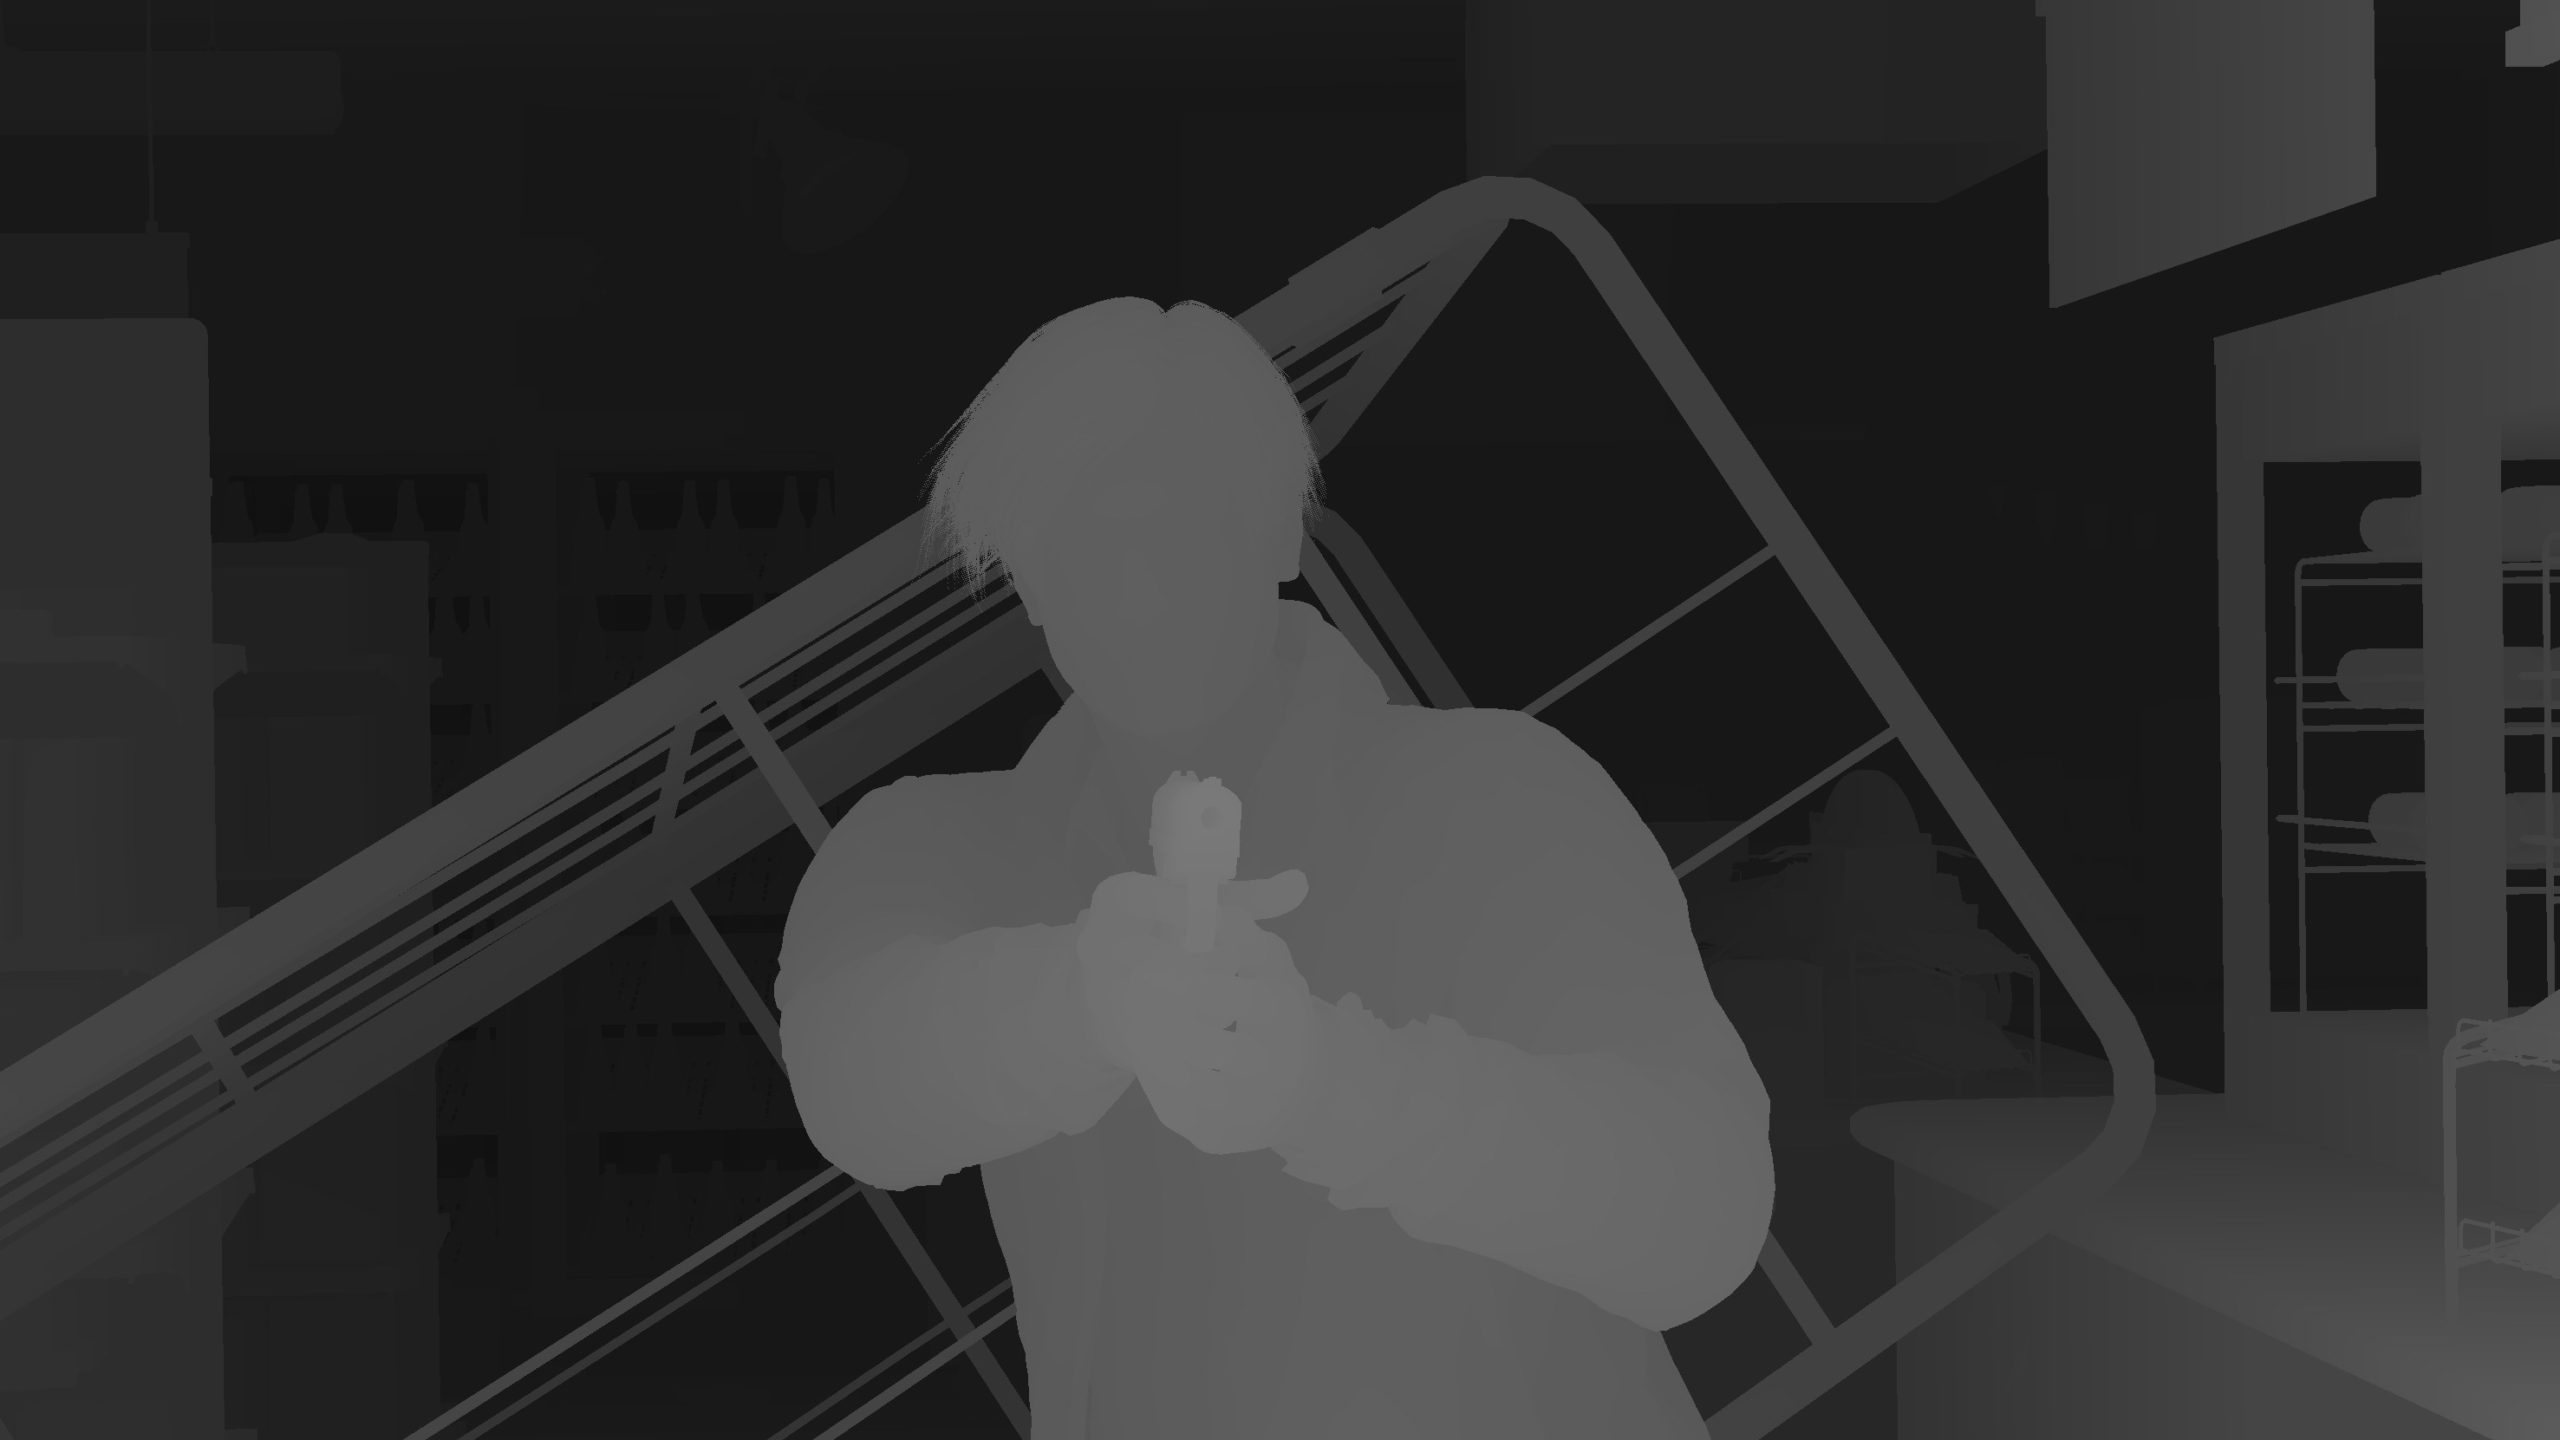
This drawing pass is not dedicated for instances only, it is a drawing pass for everything, but also here the 2nd part of the instancing process (which is drawing instances/patches) is taking place between other none-instancing draws.
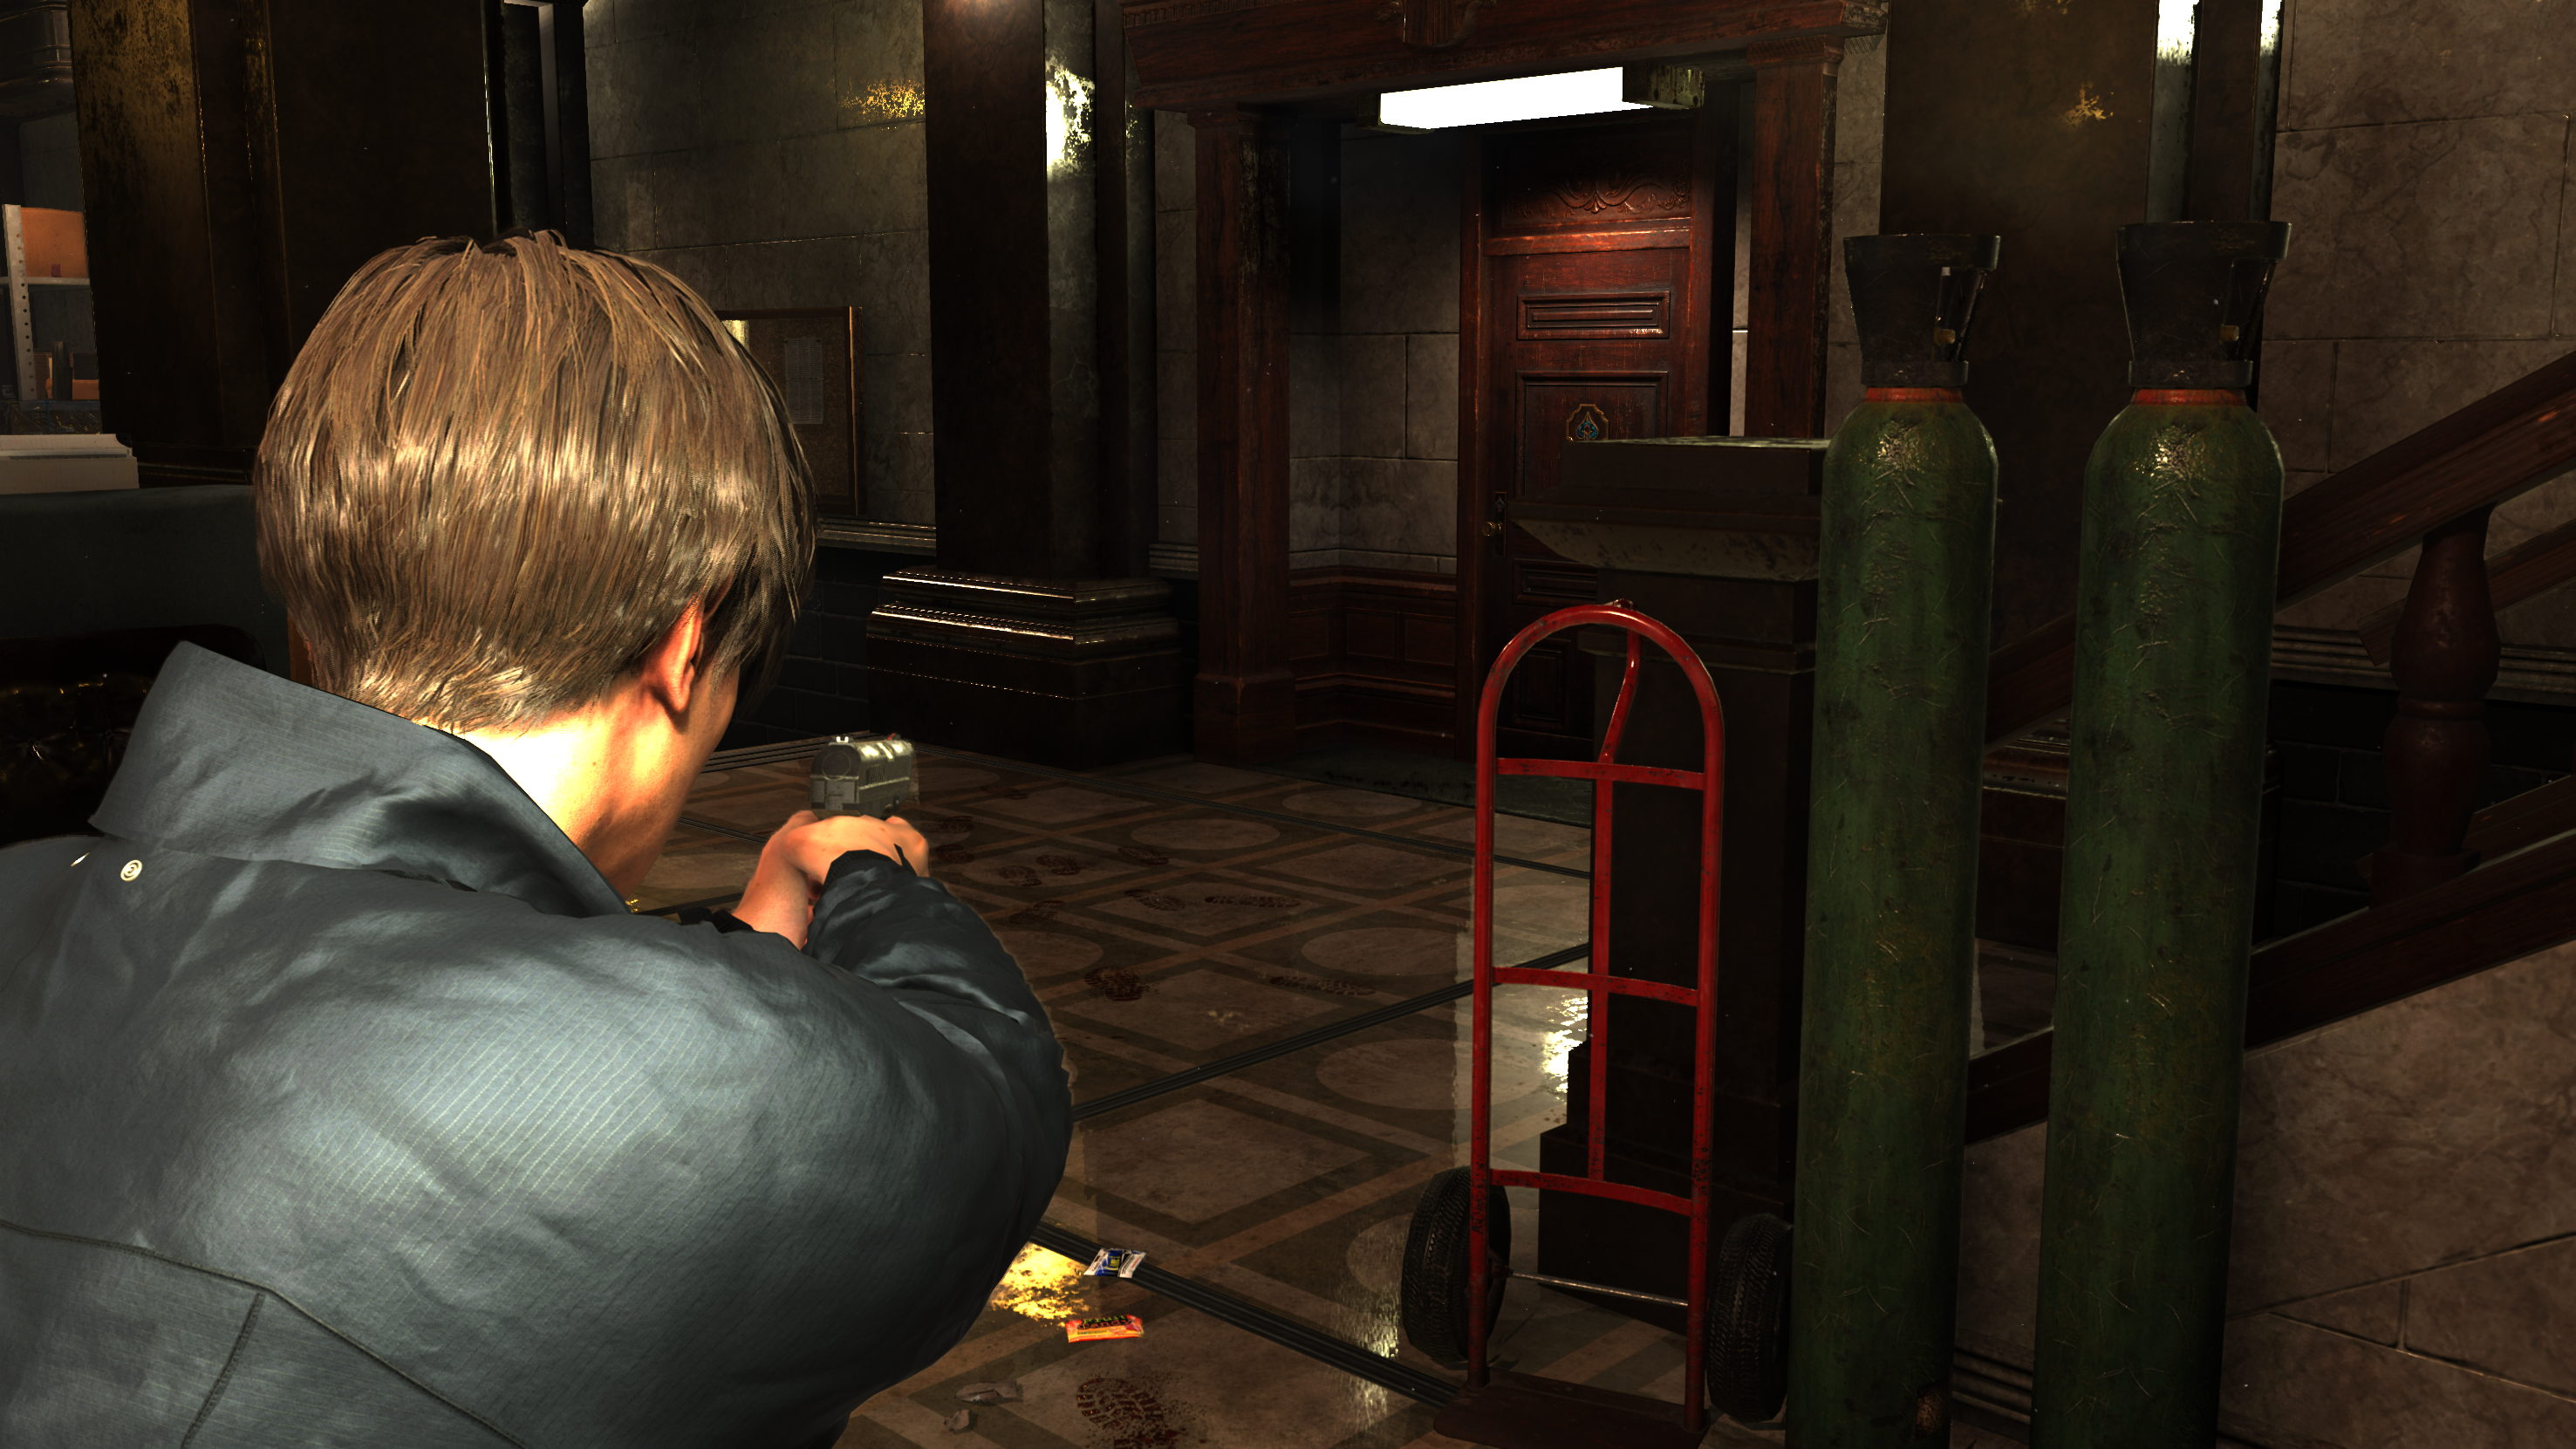
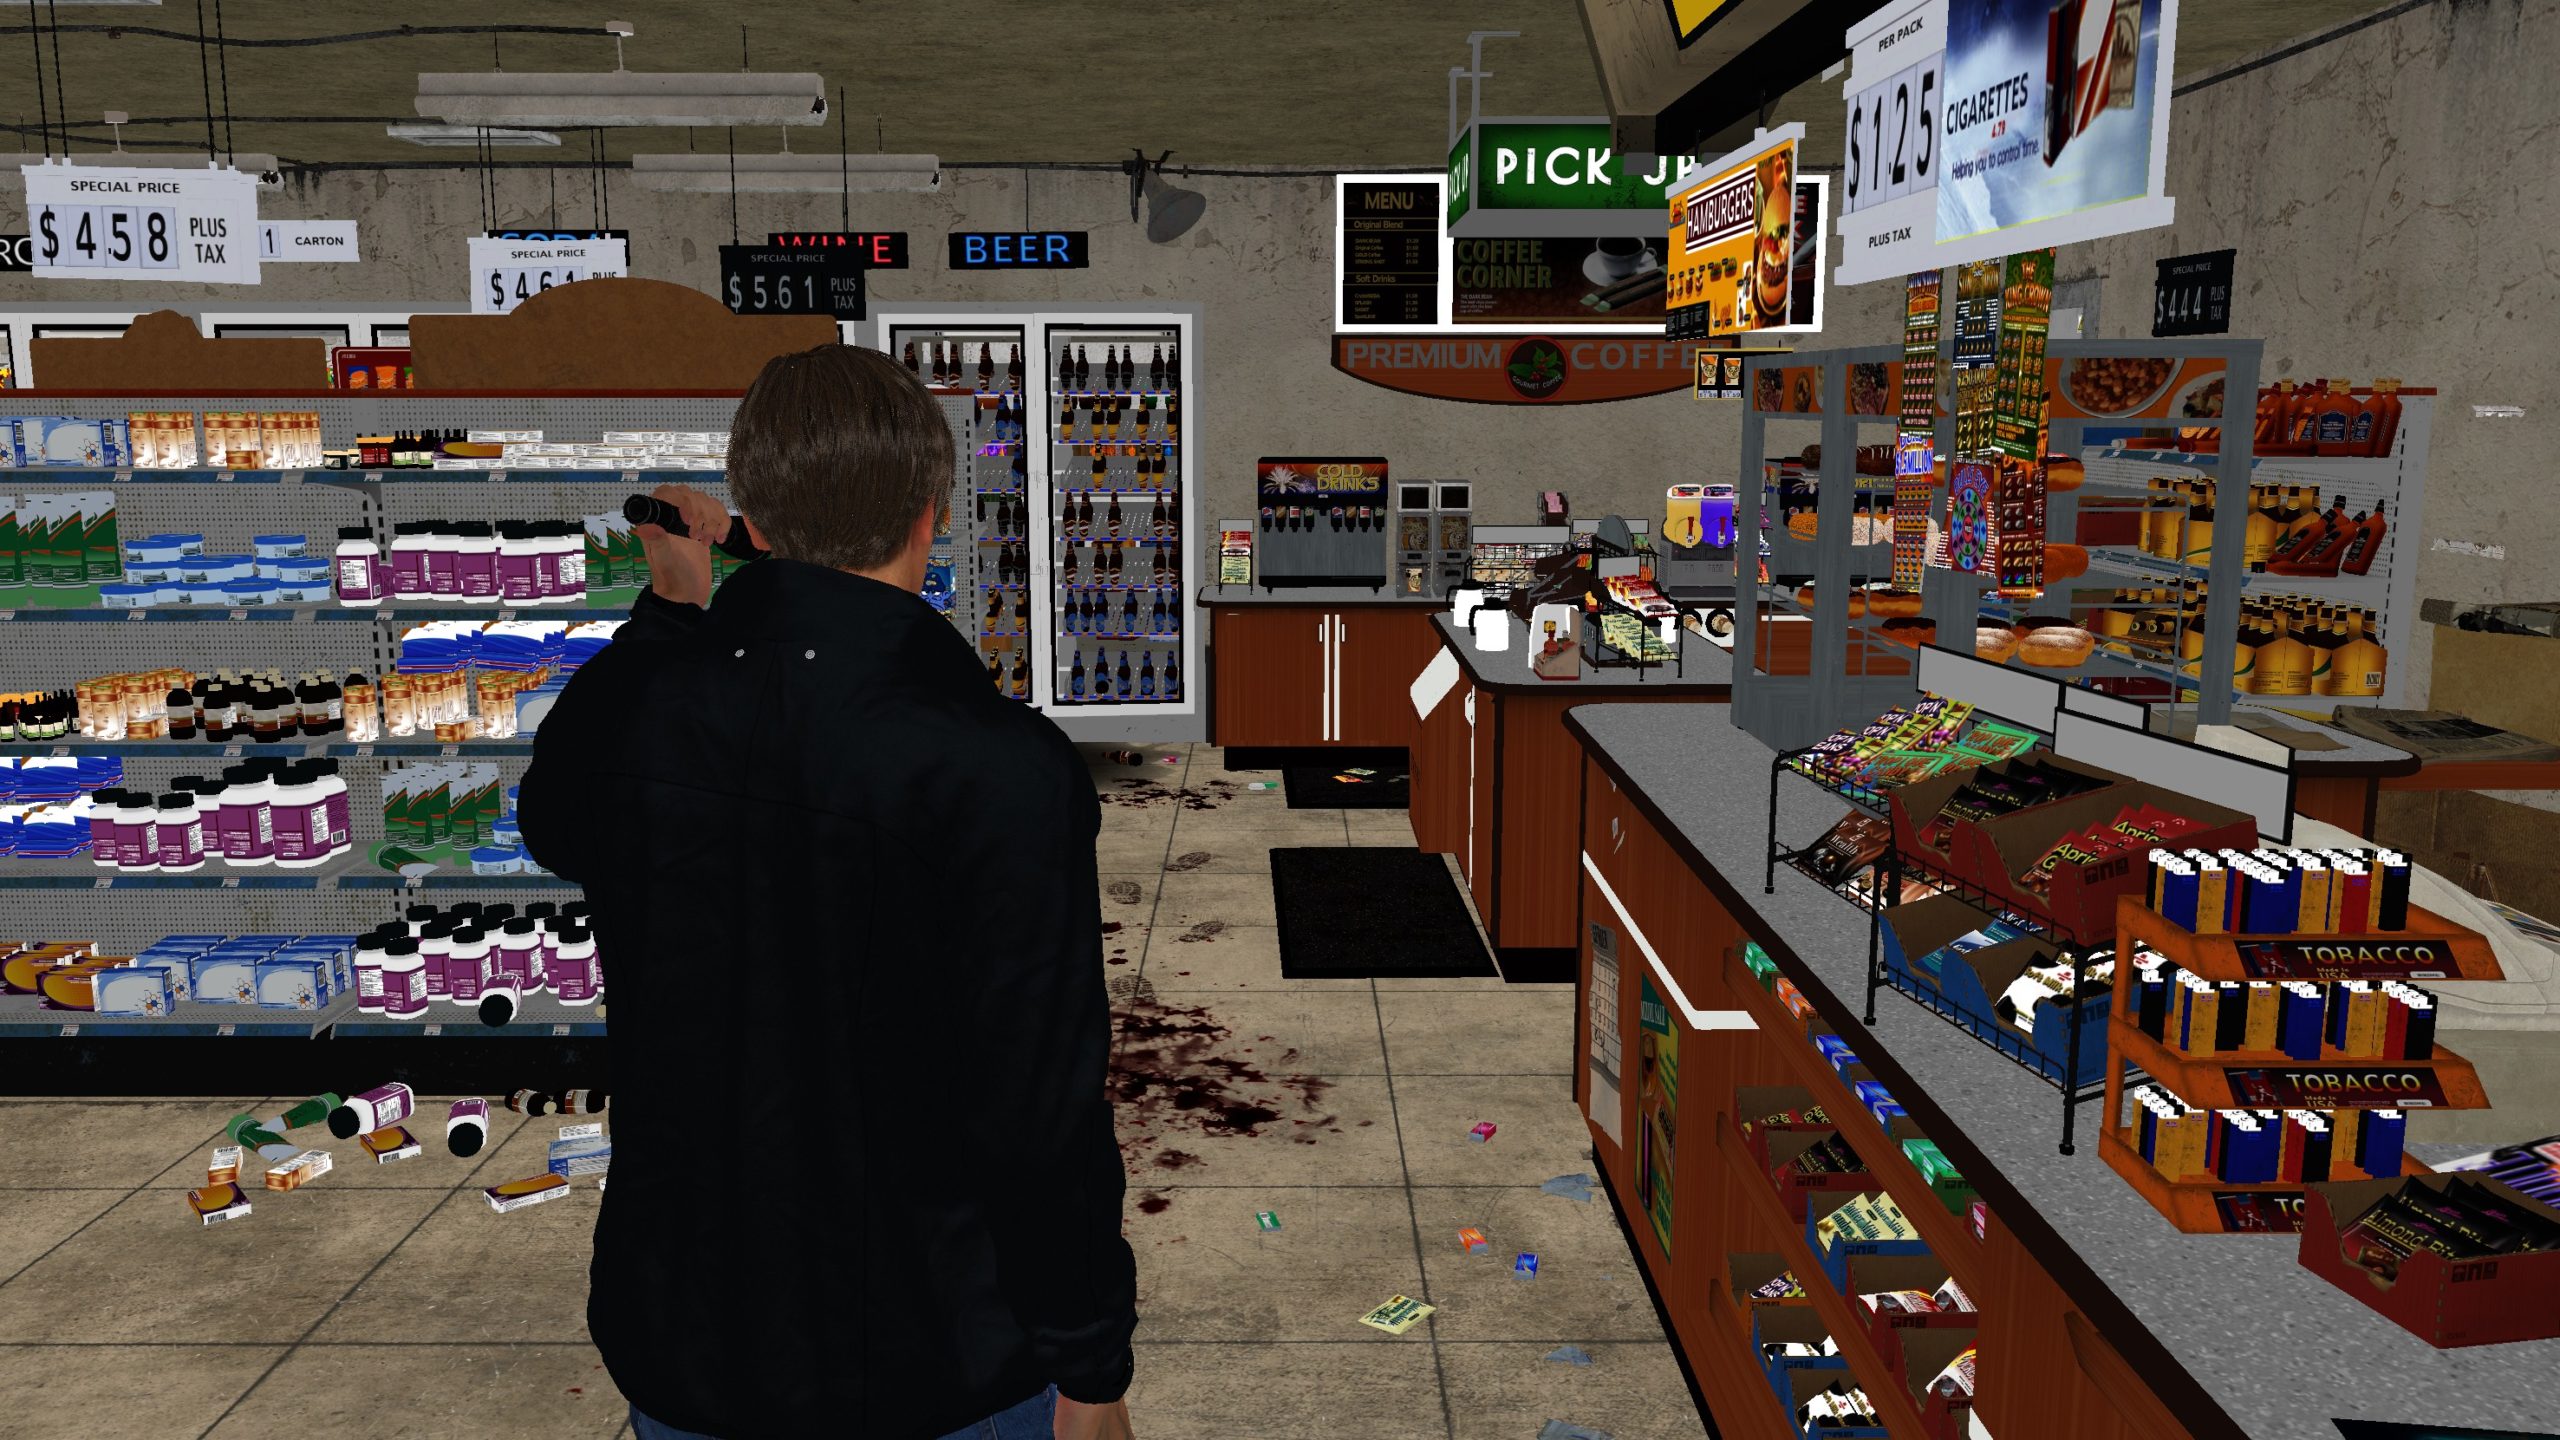
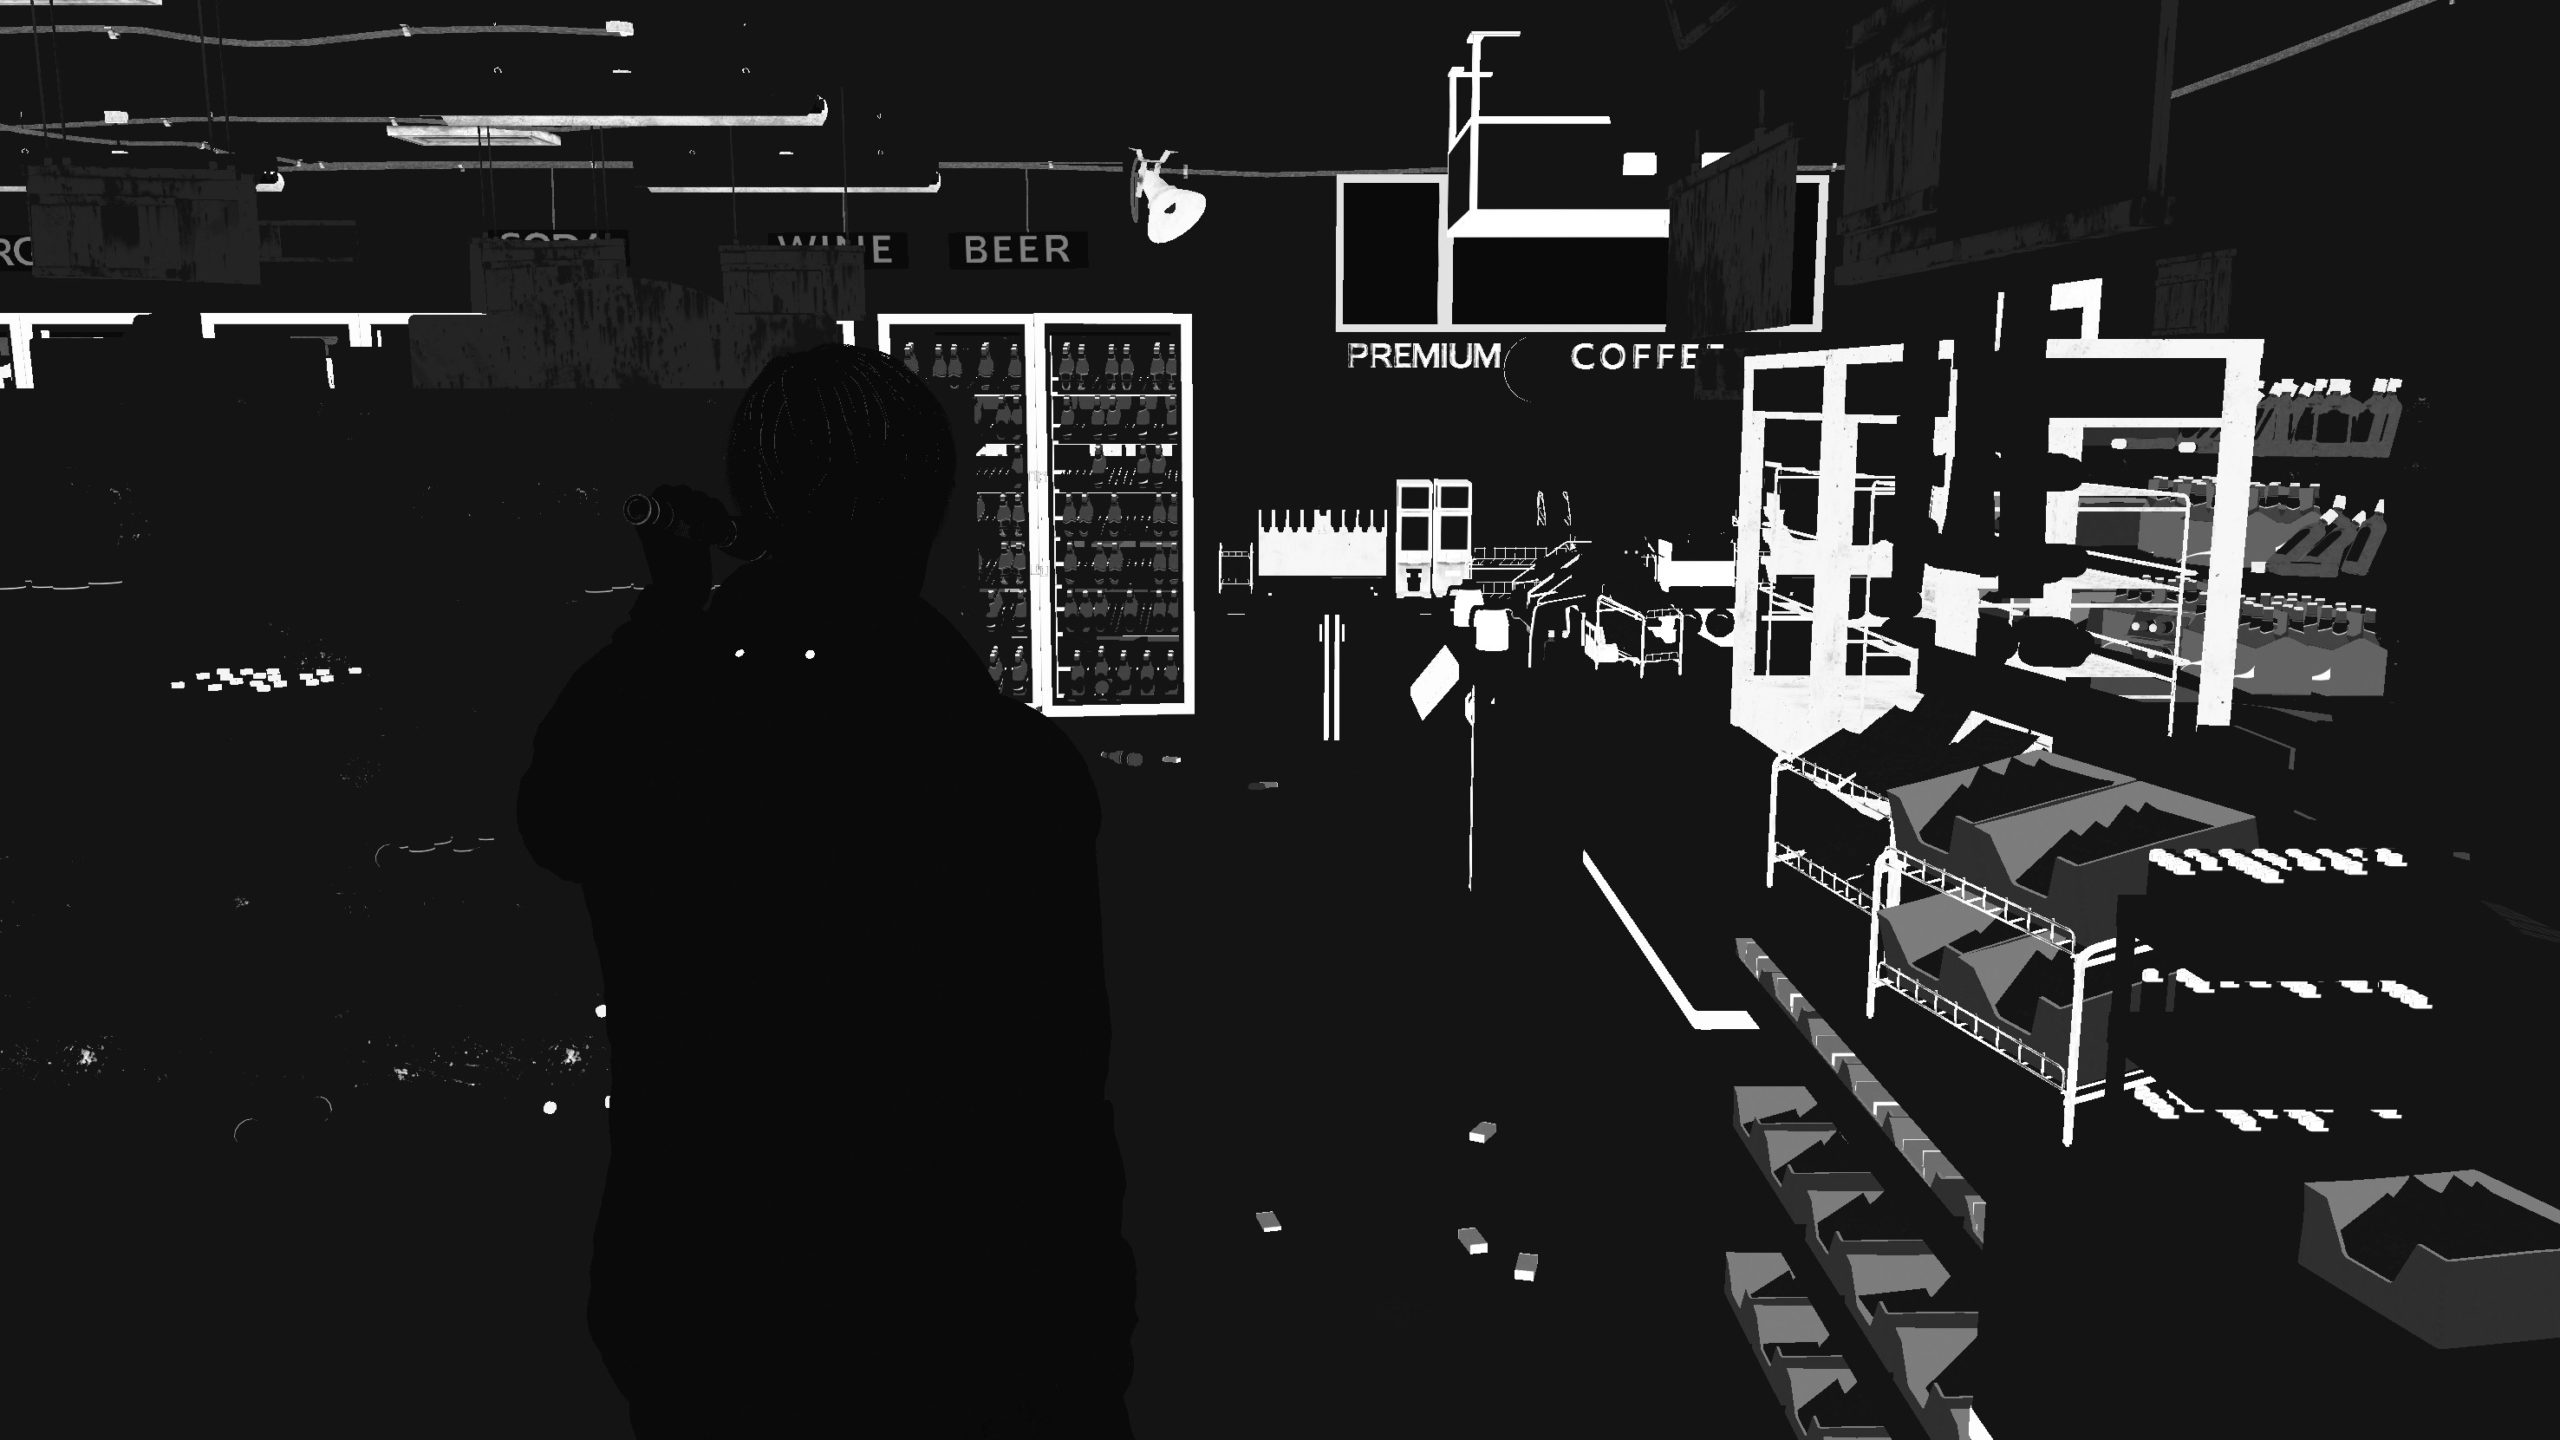
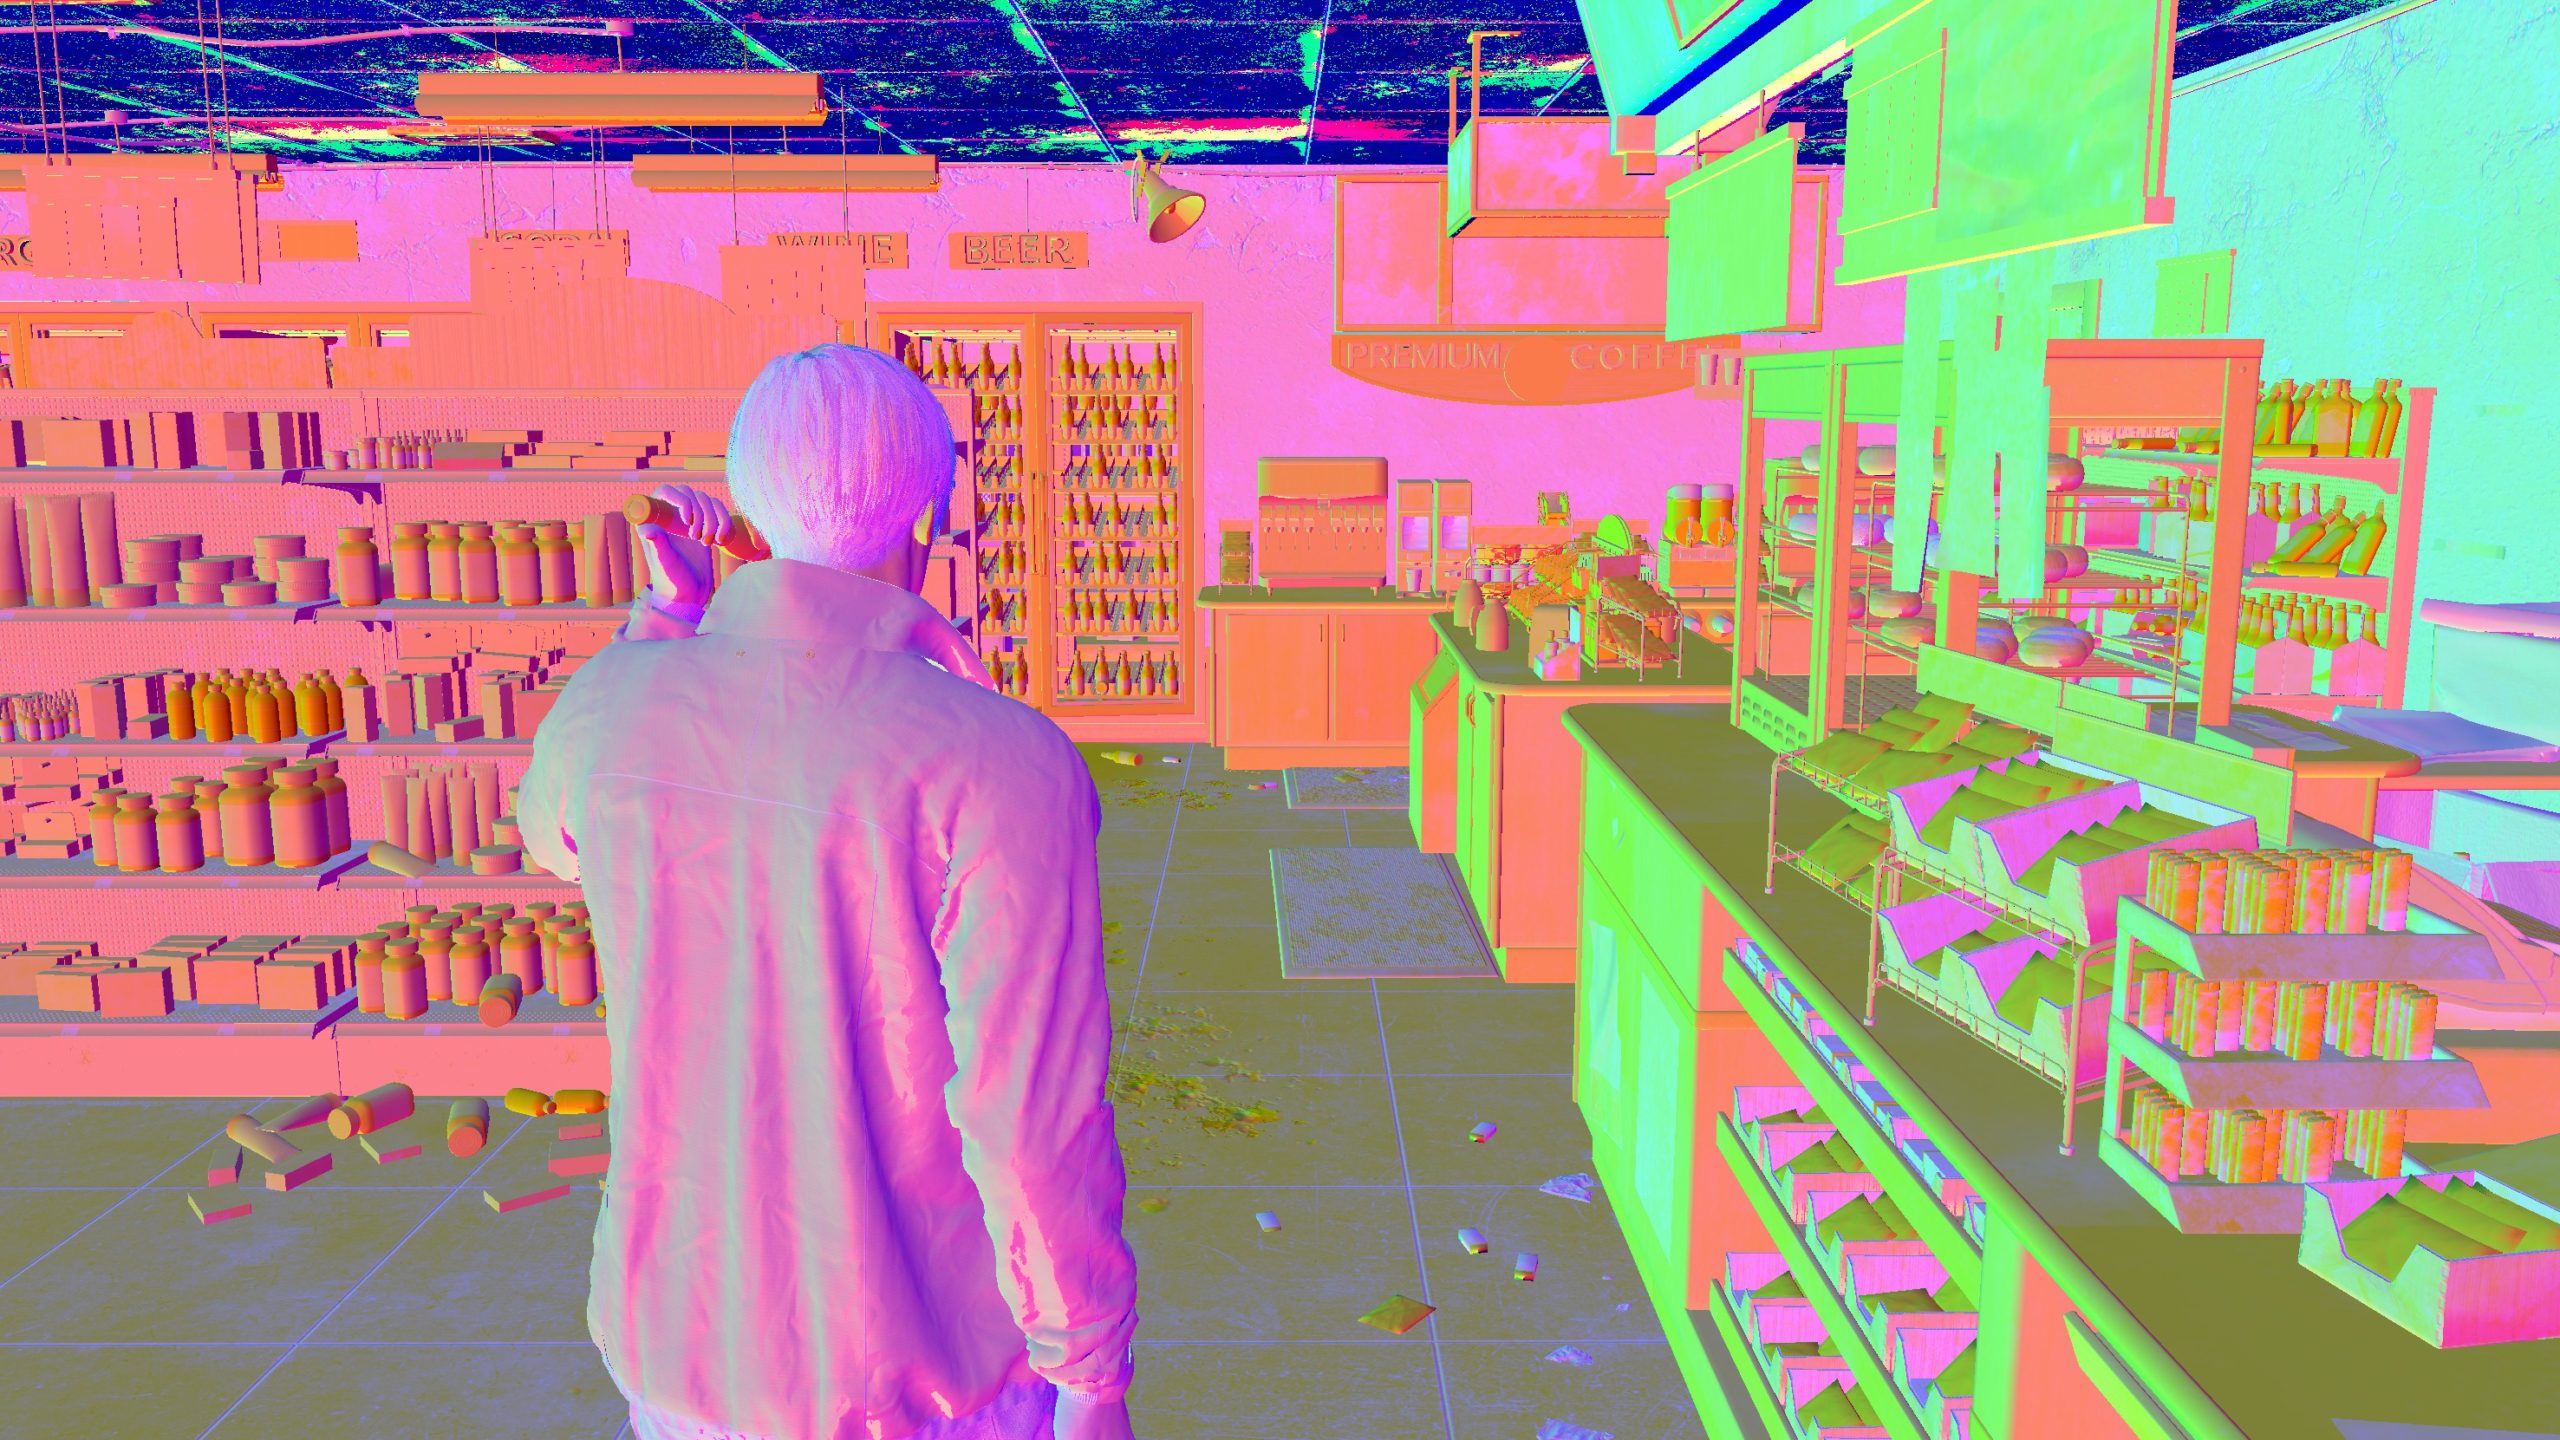
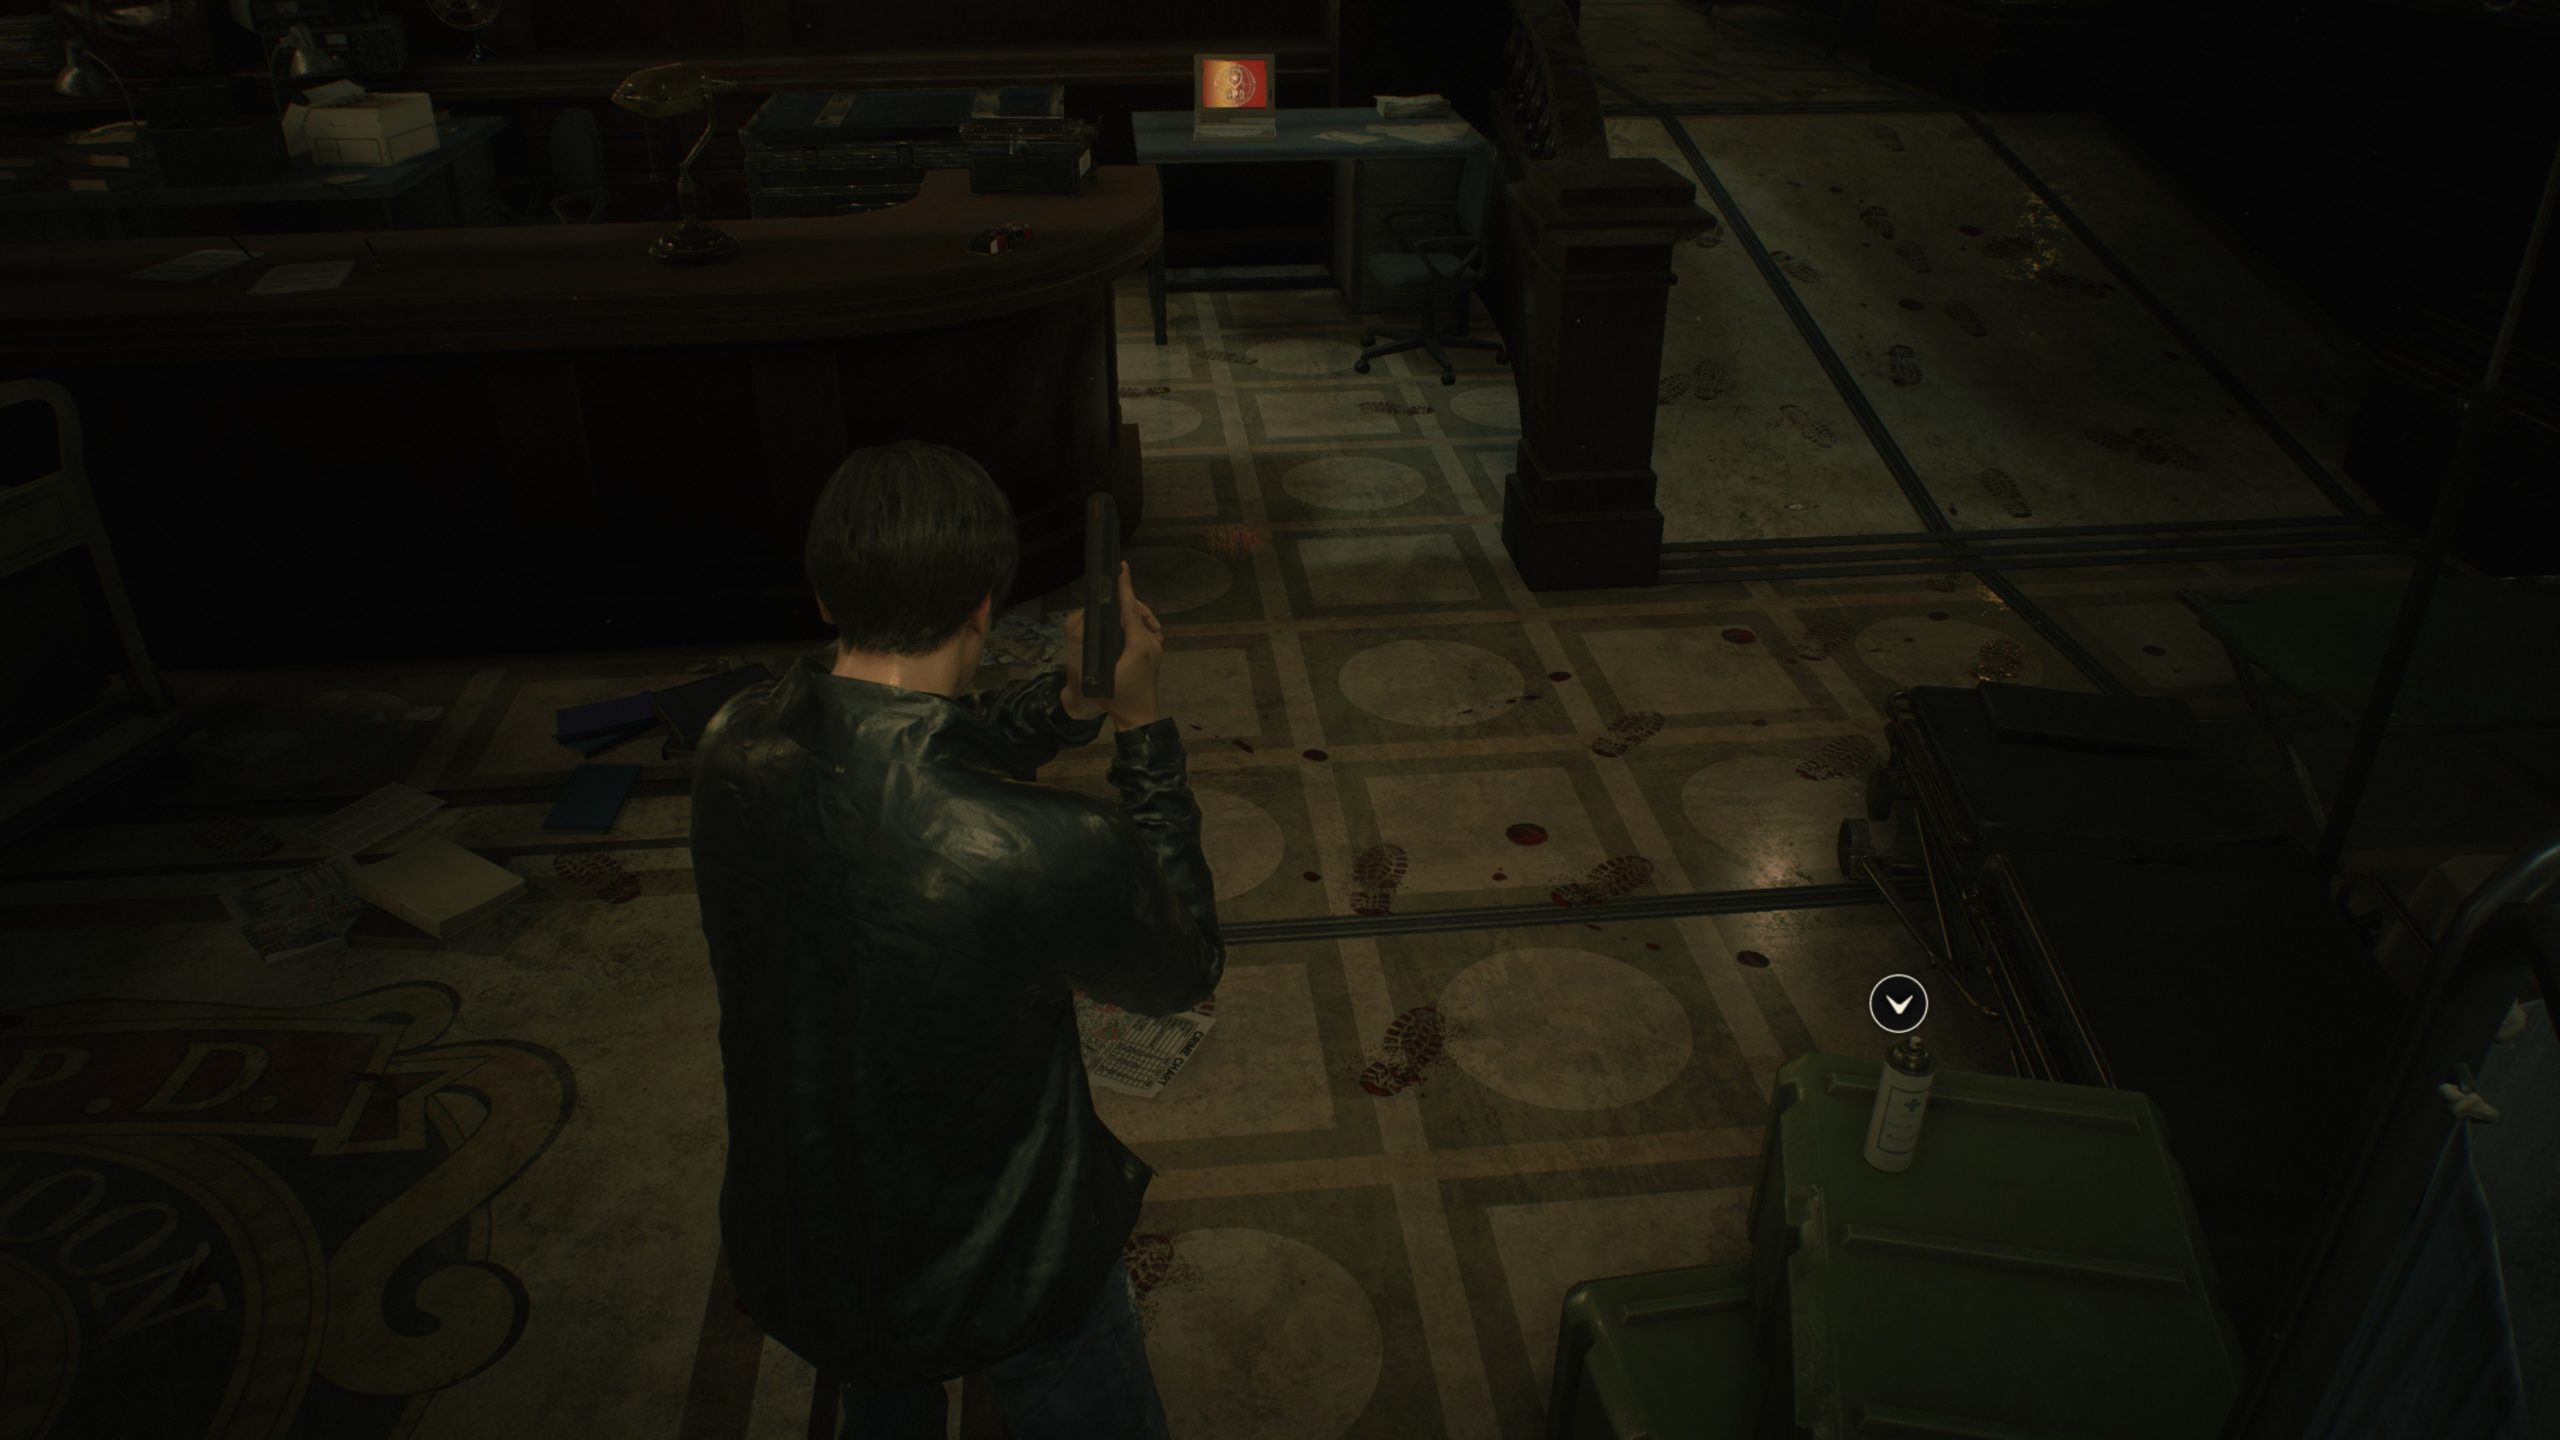
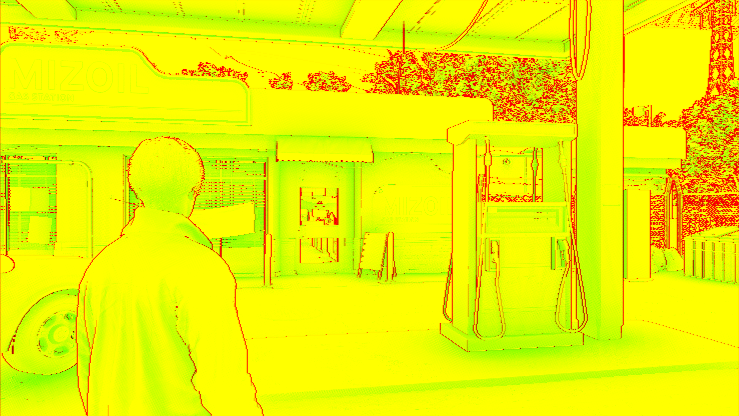
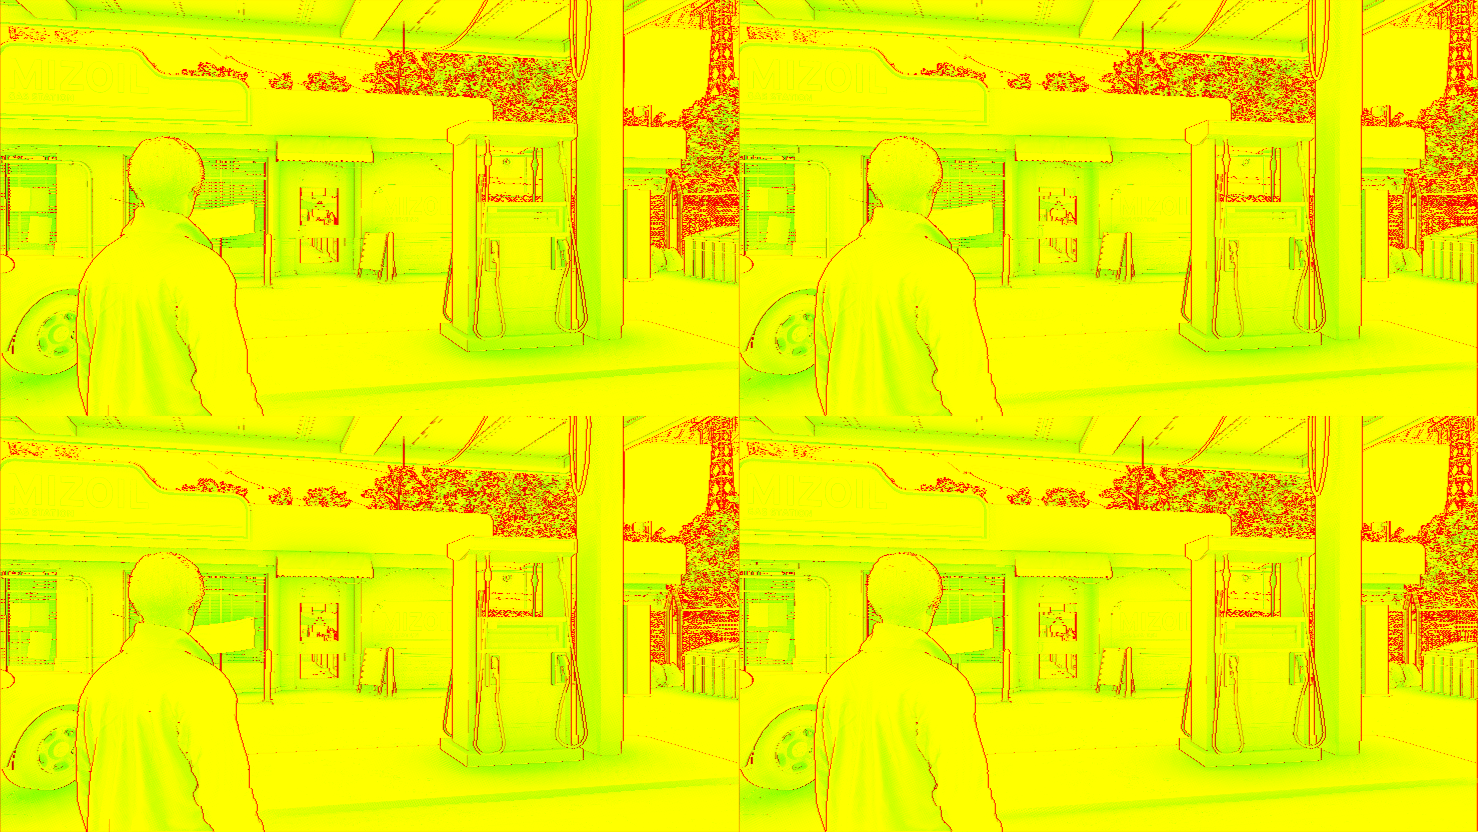
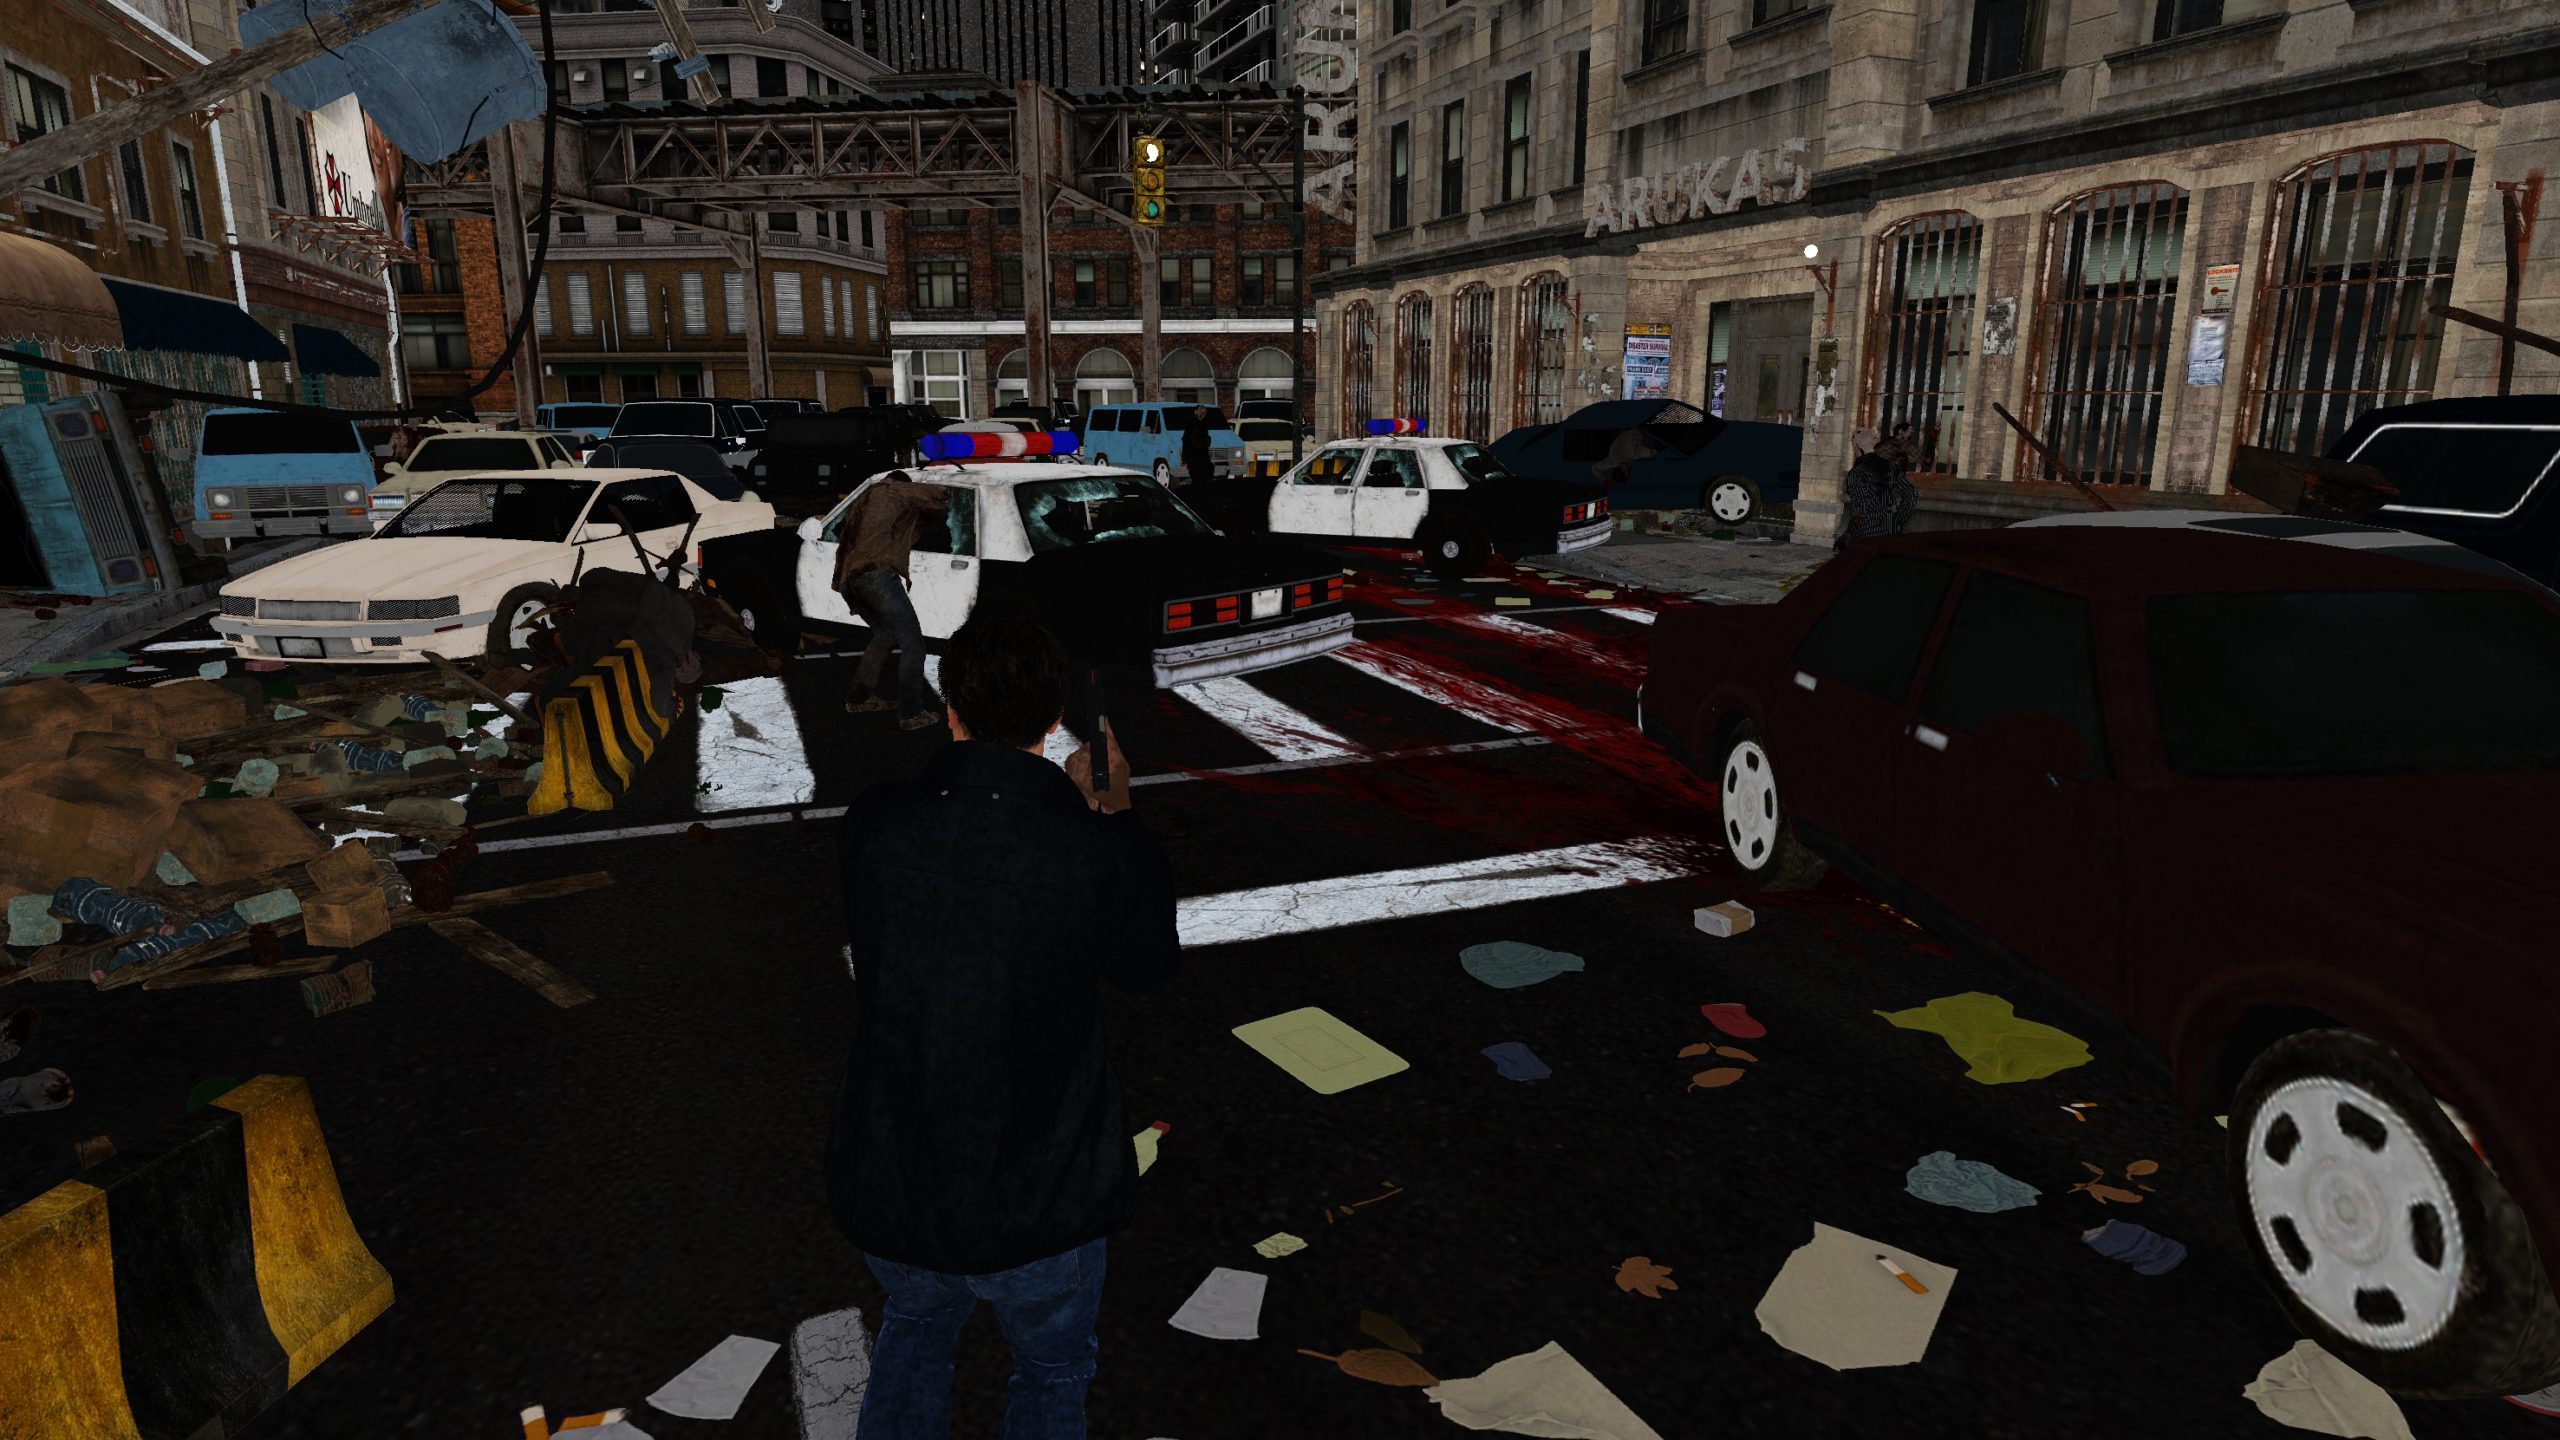
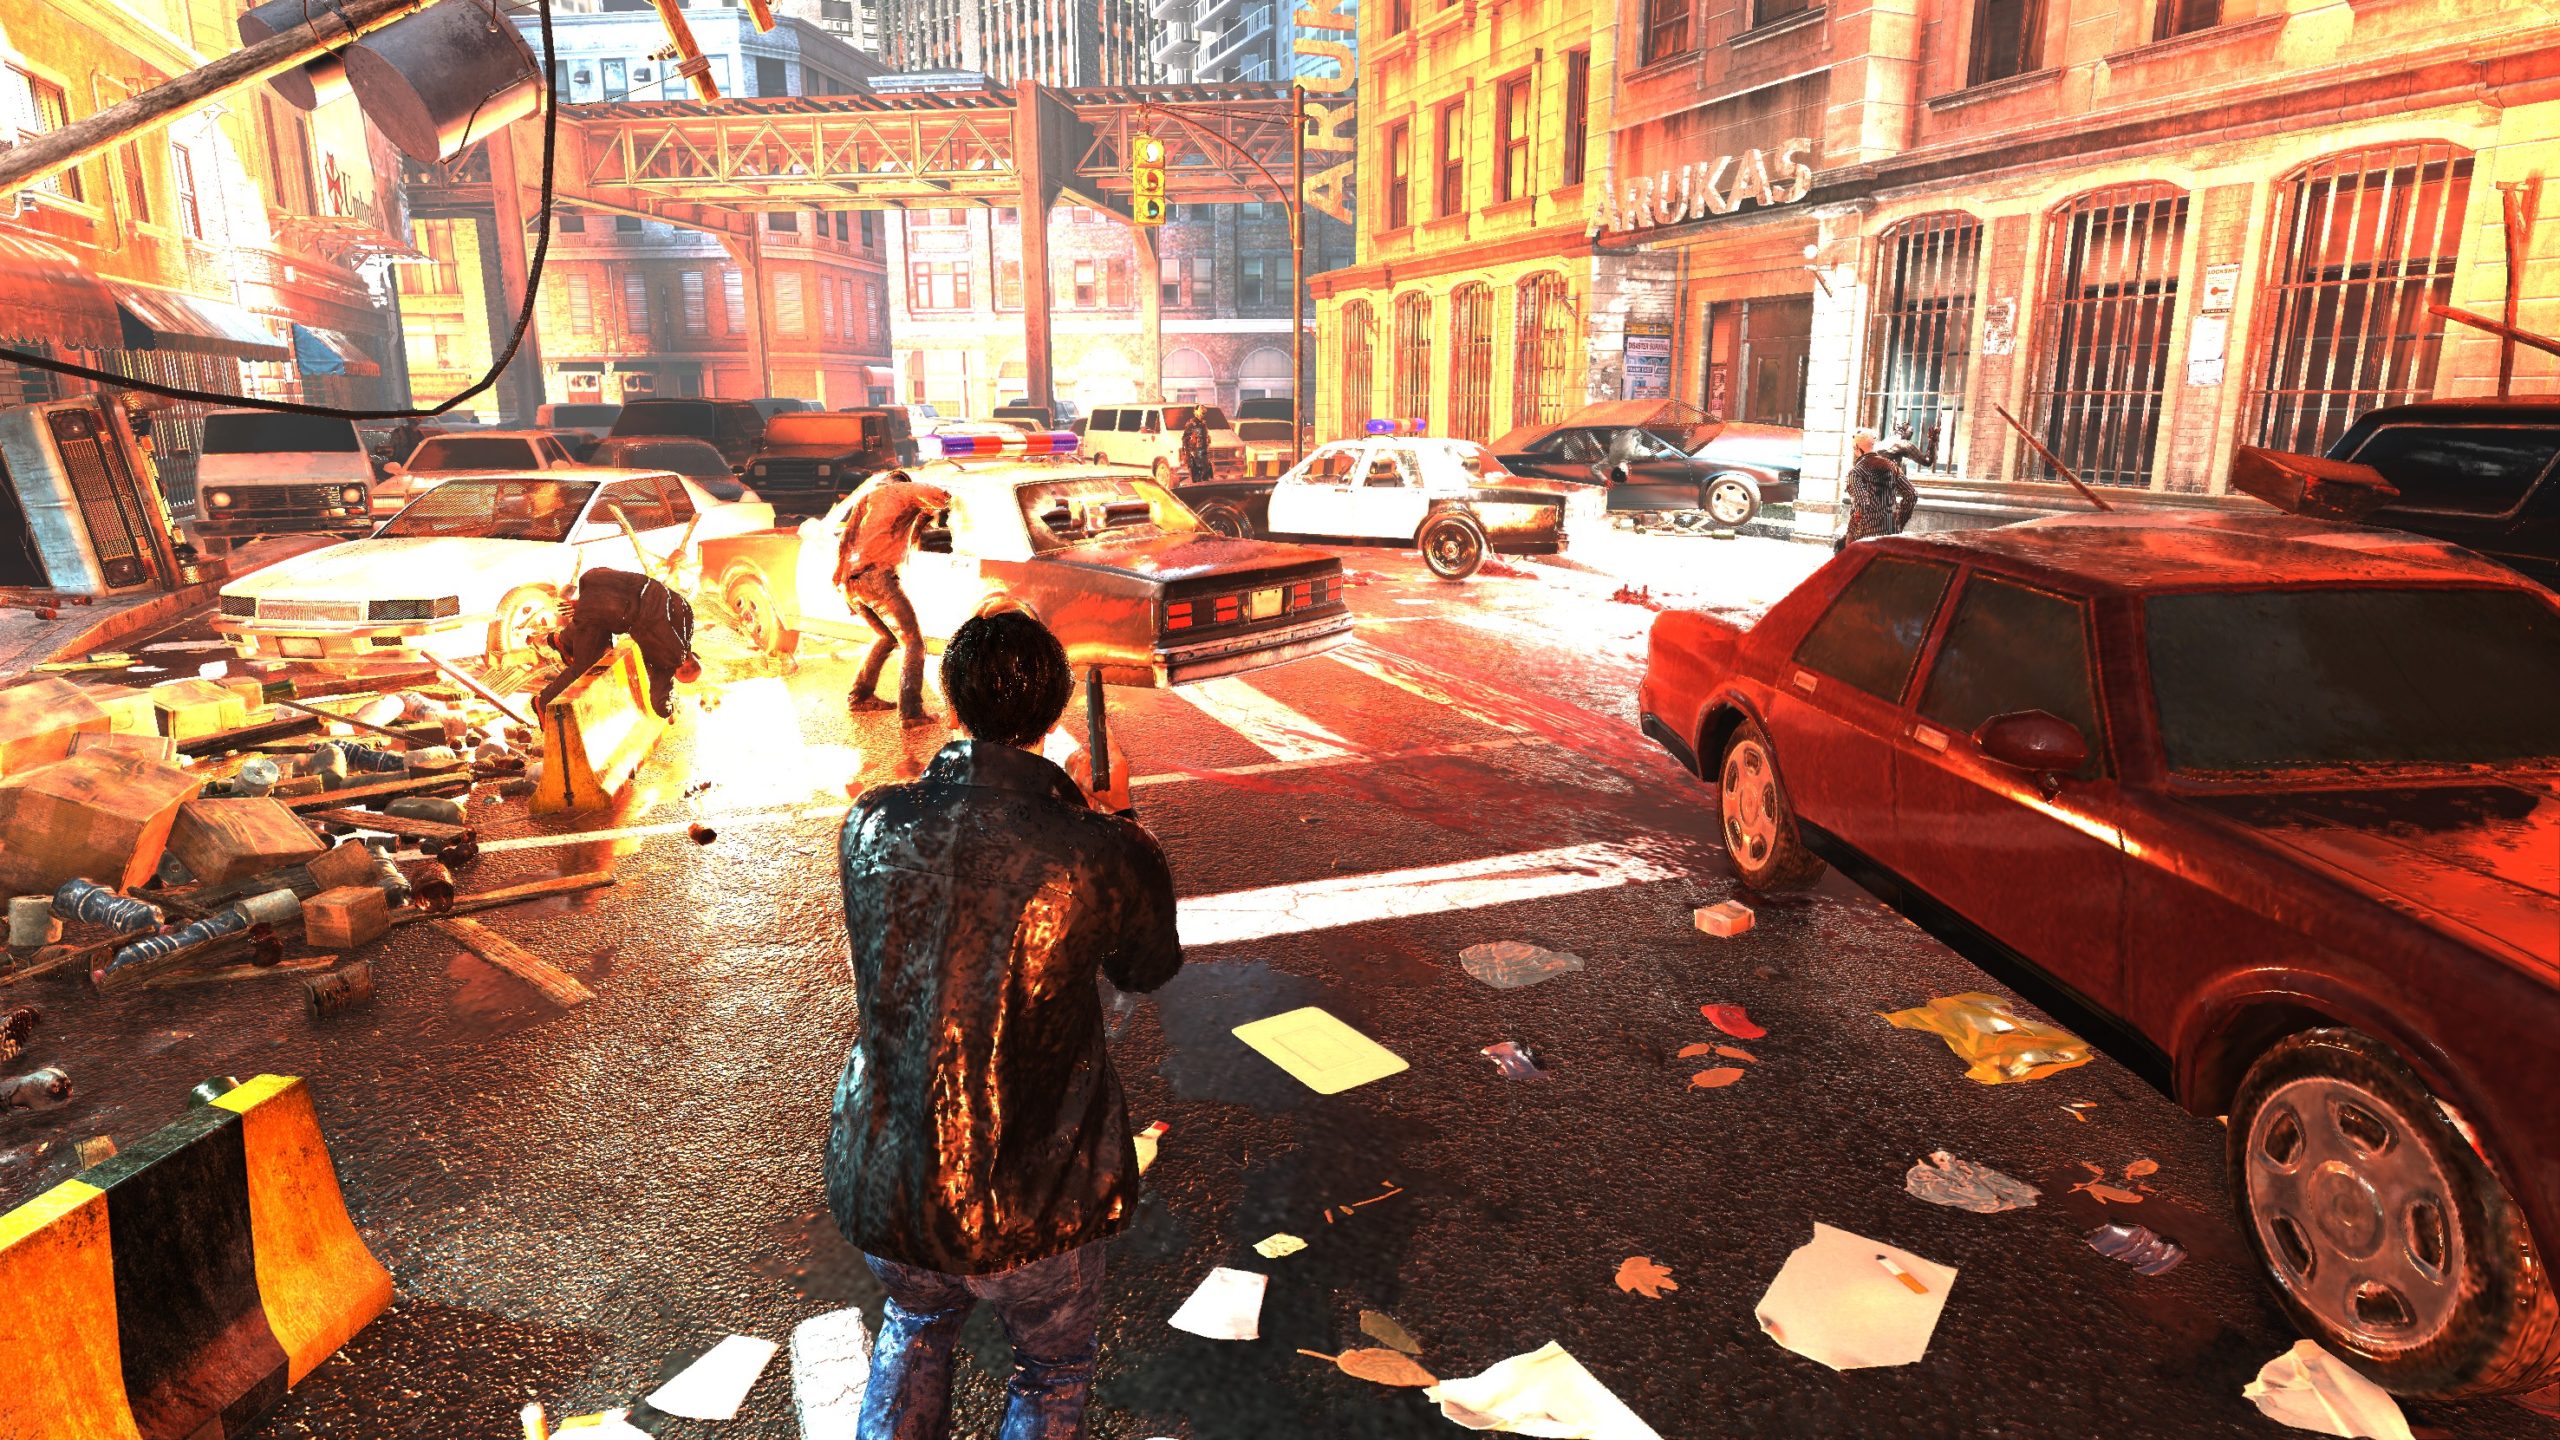
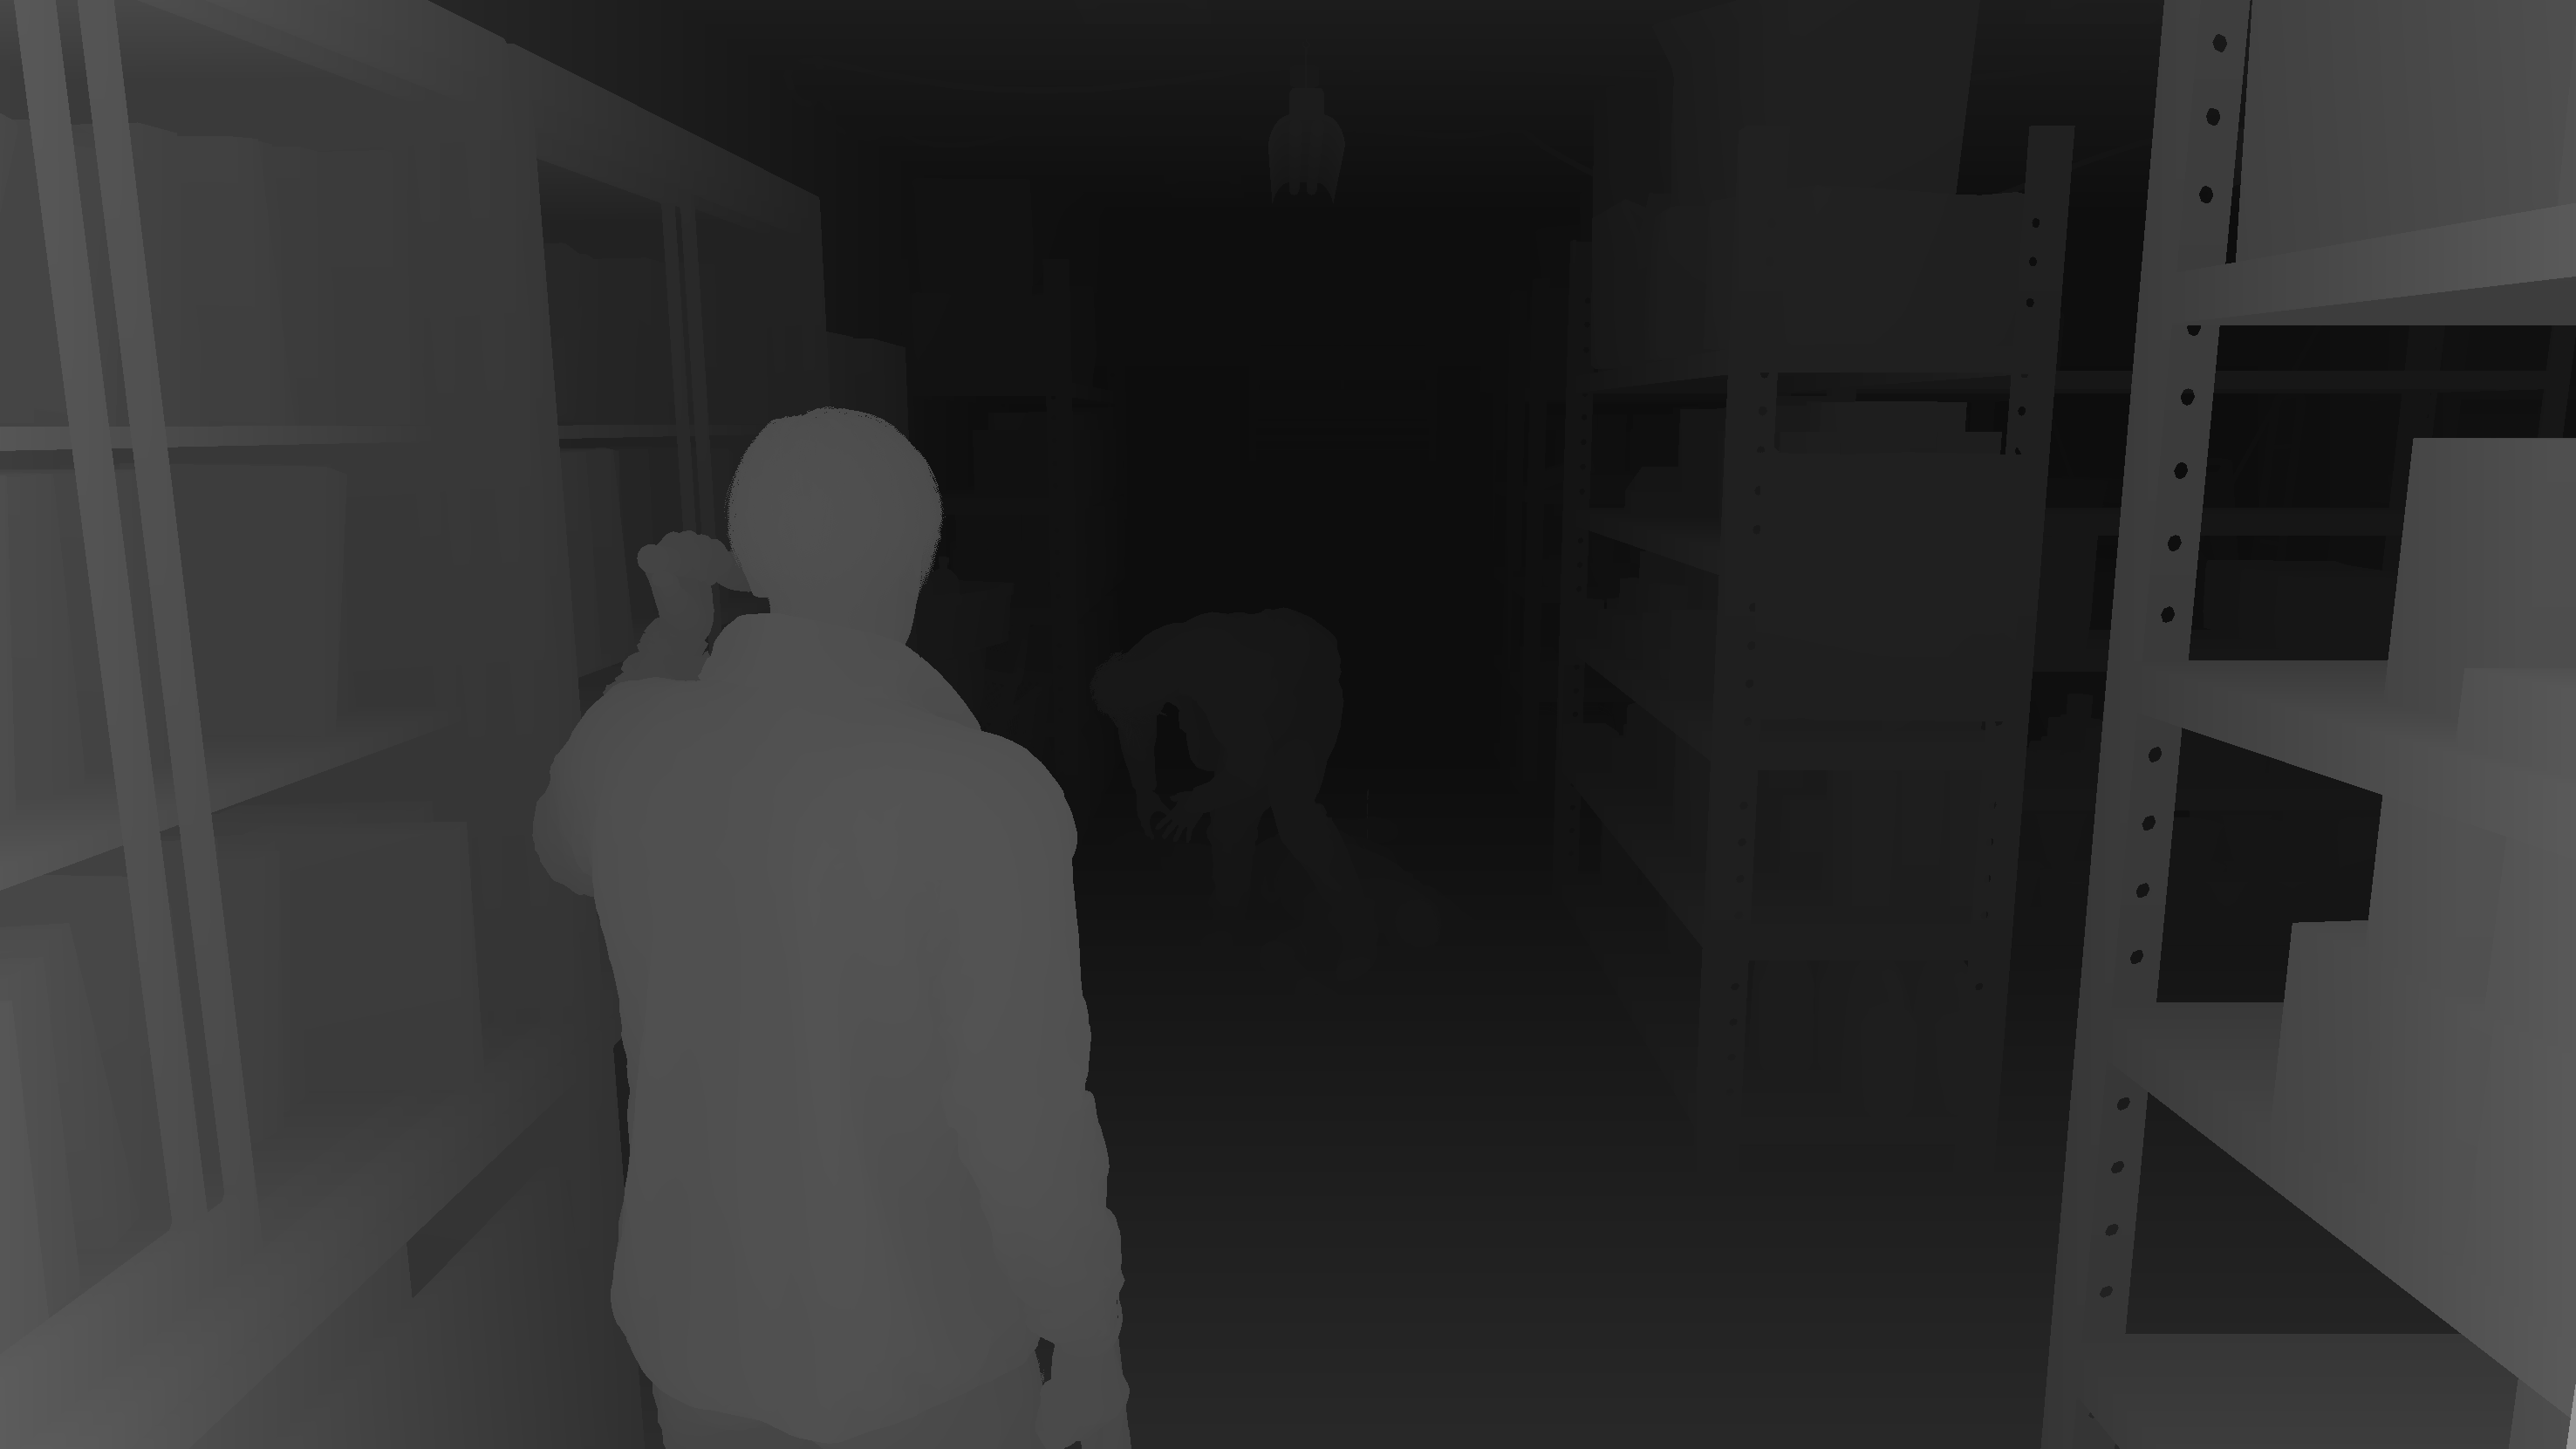
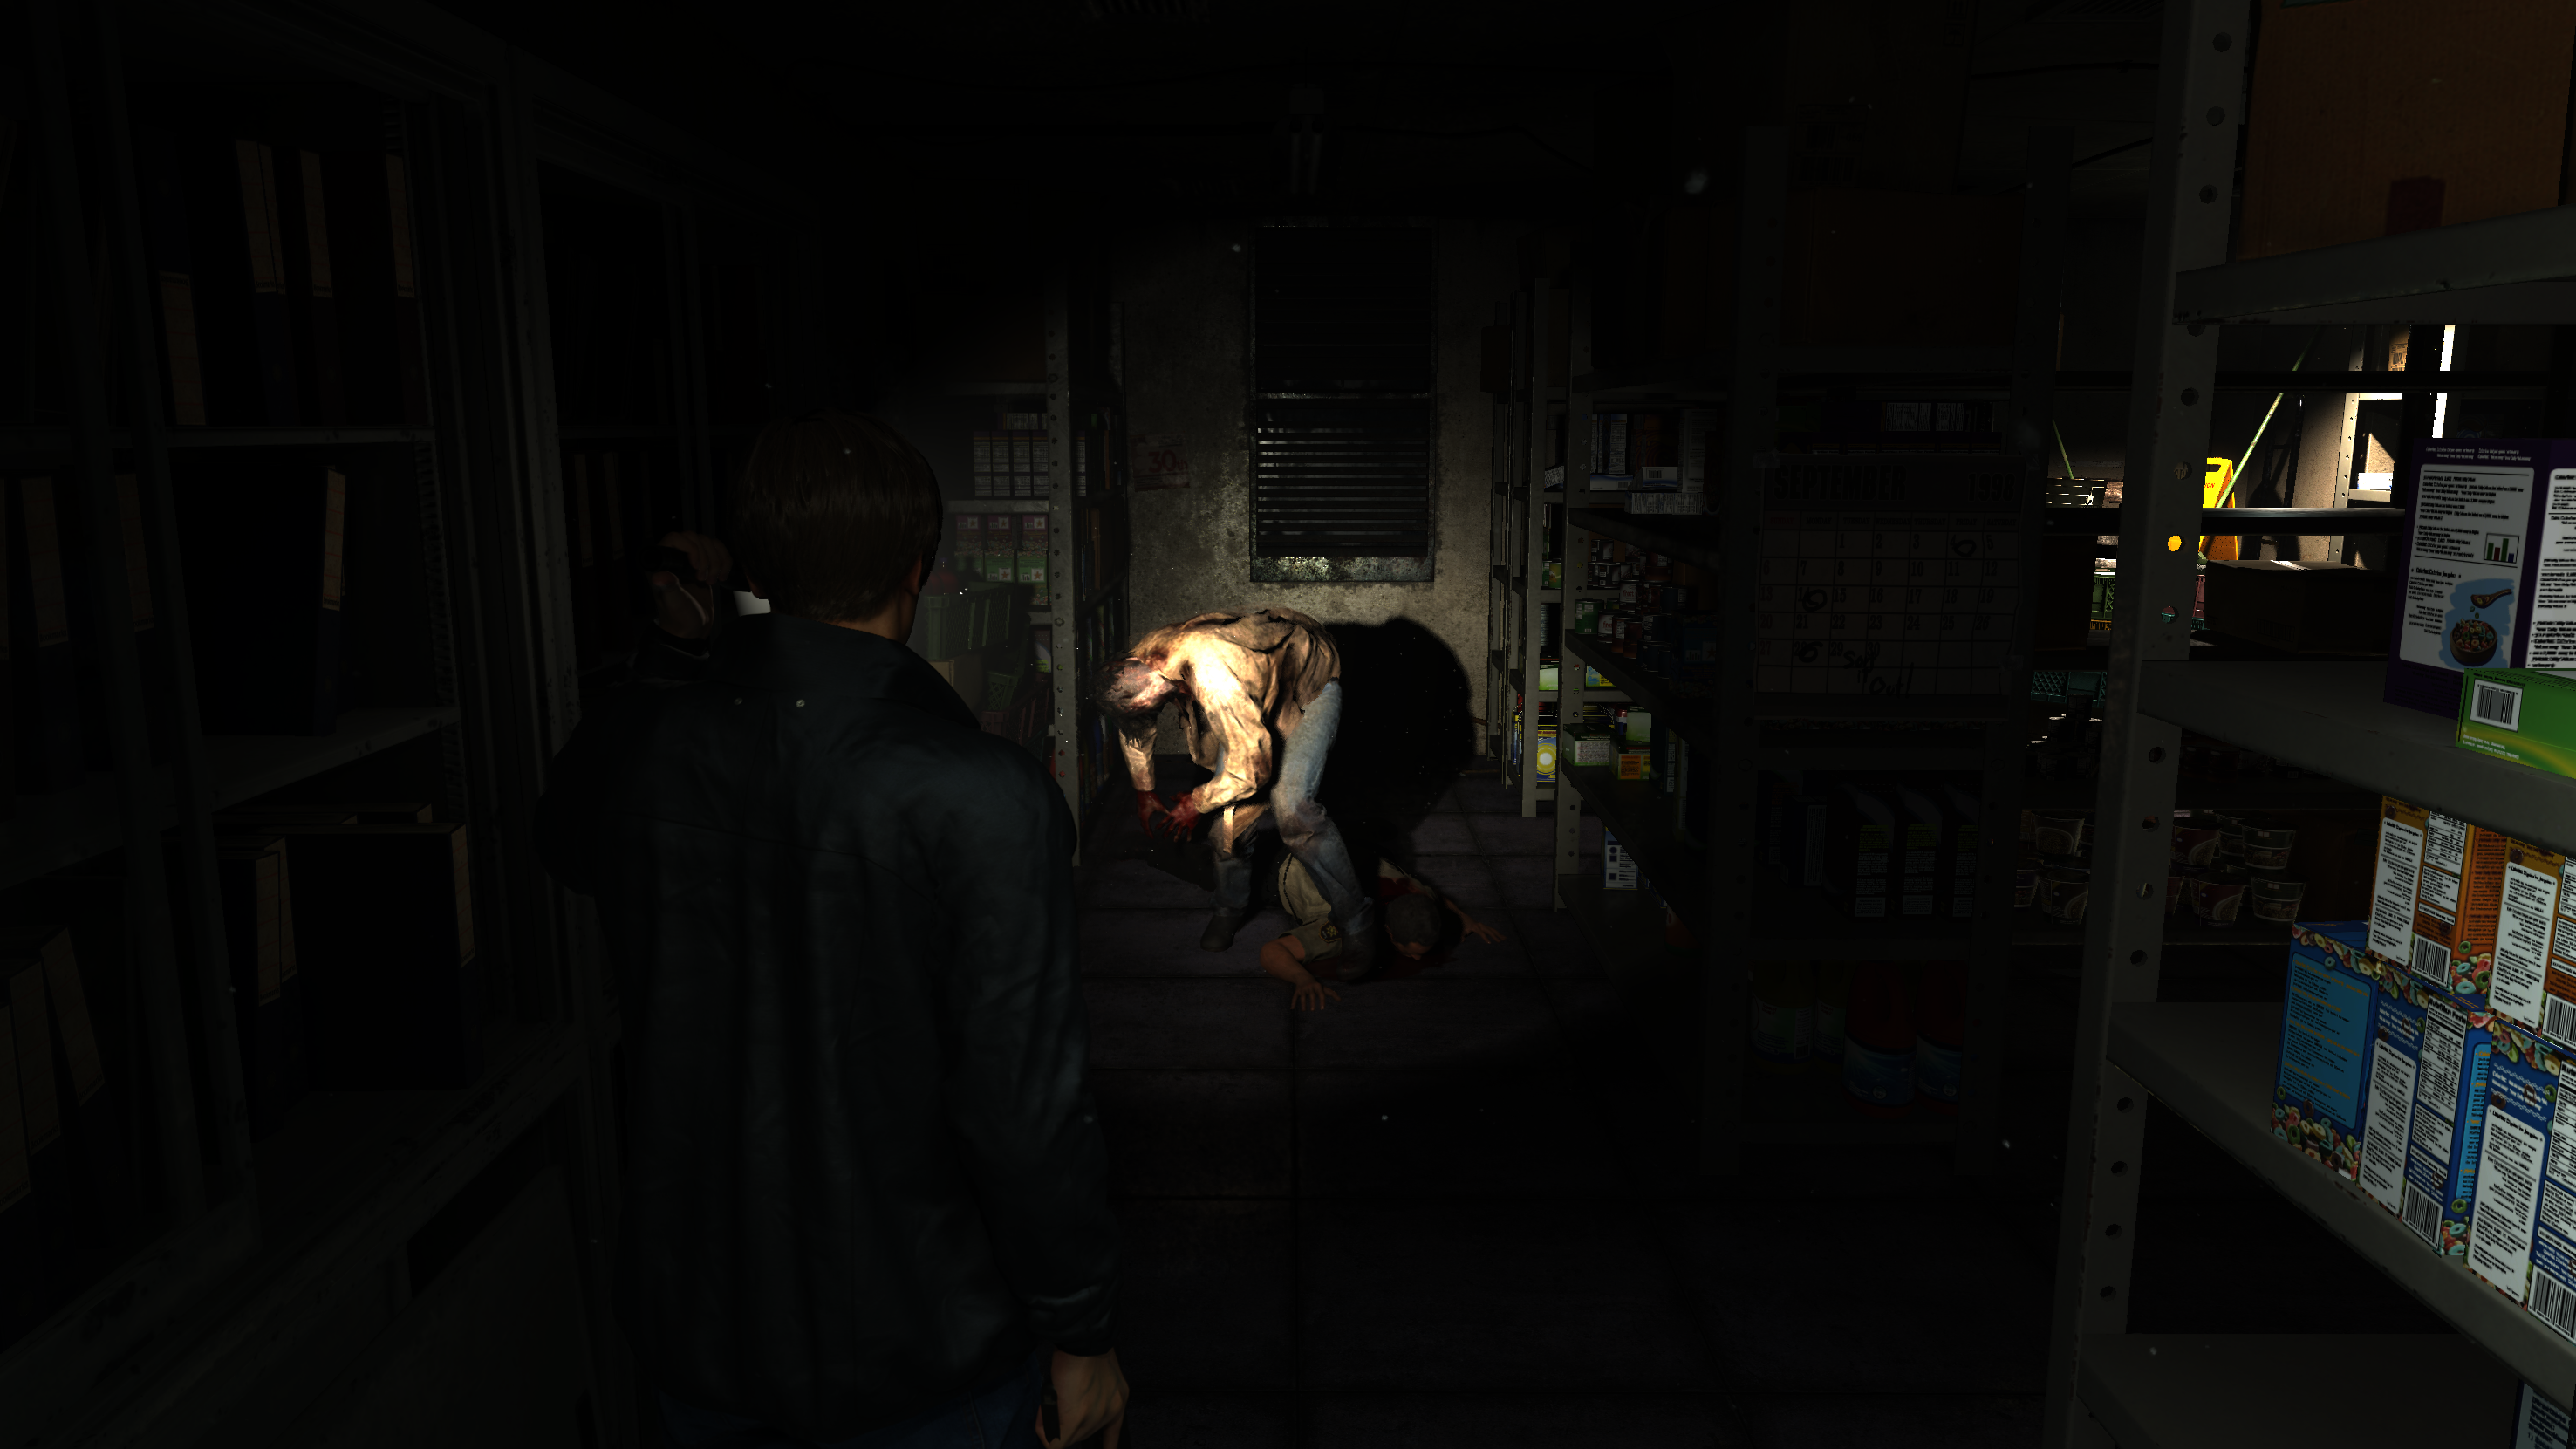
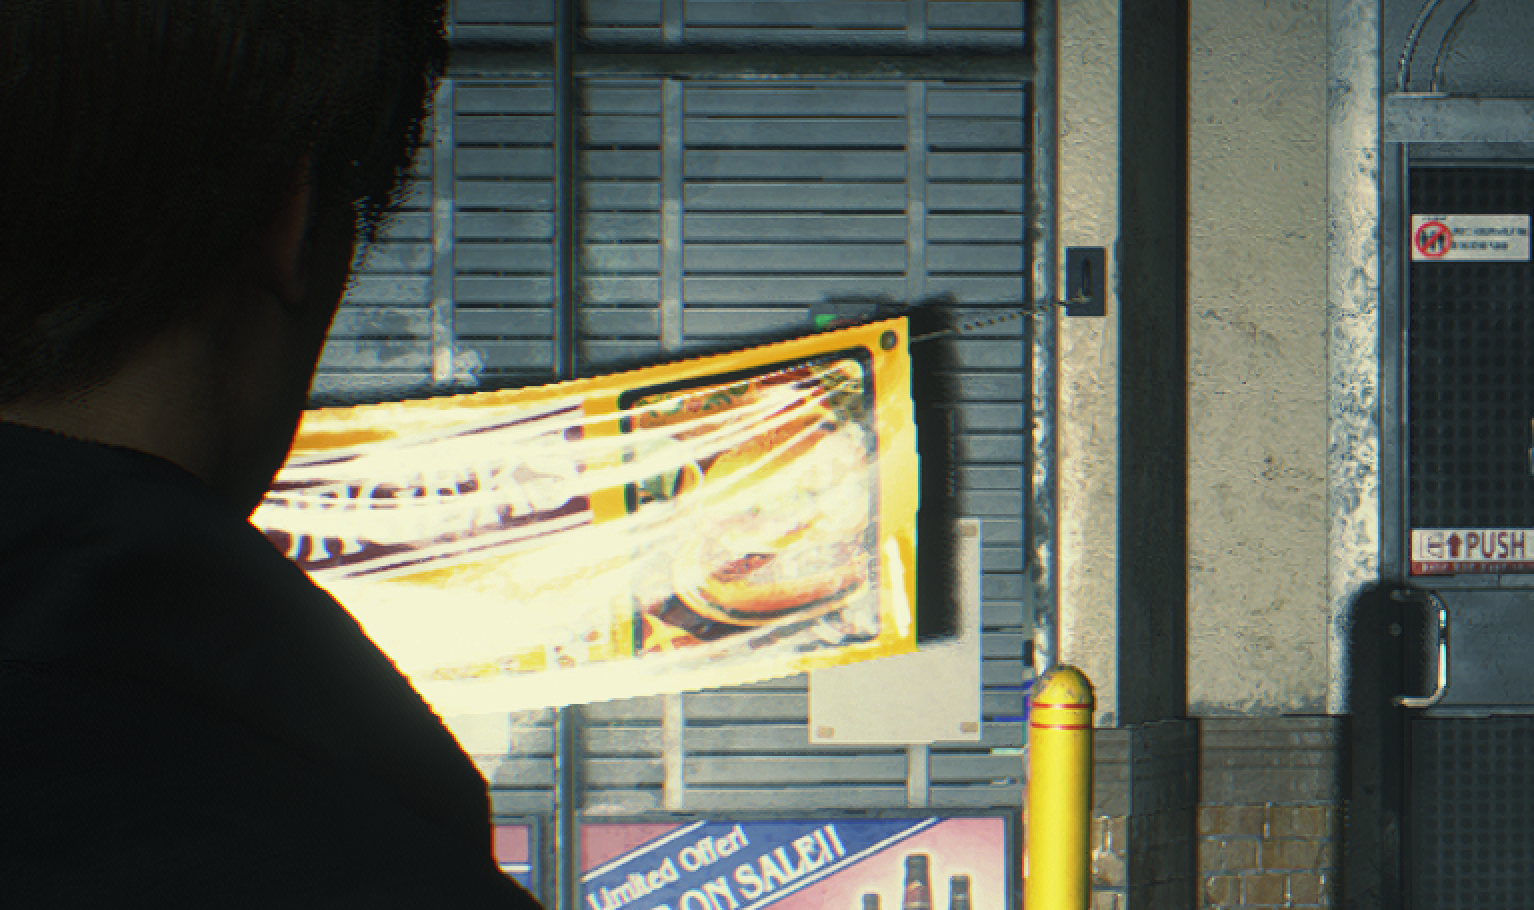
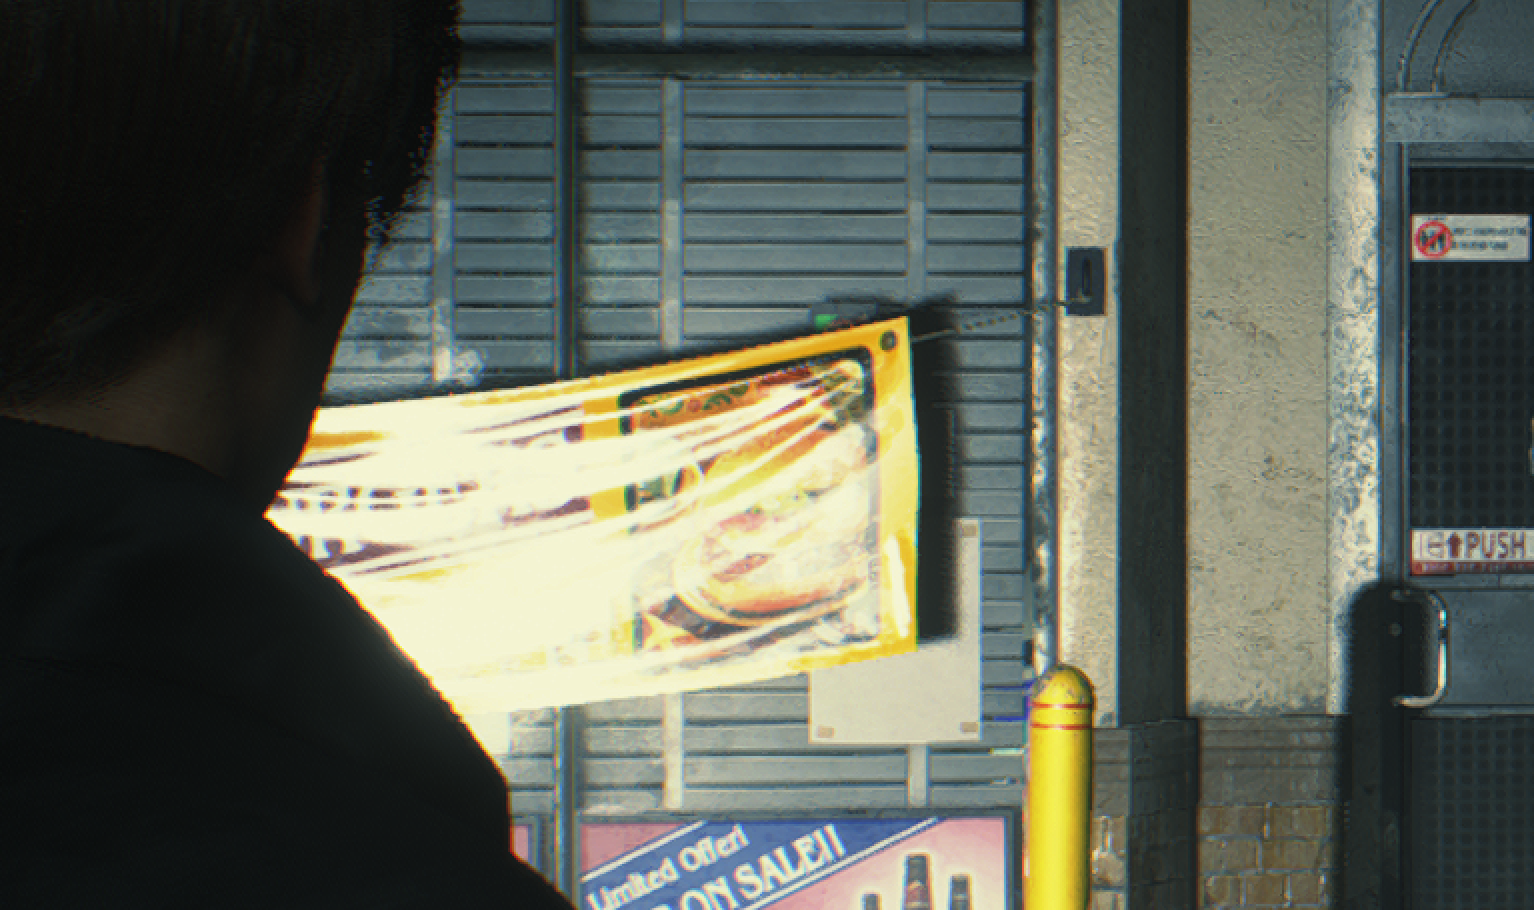
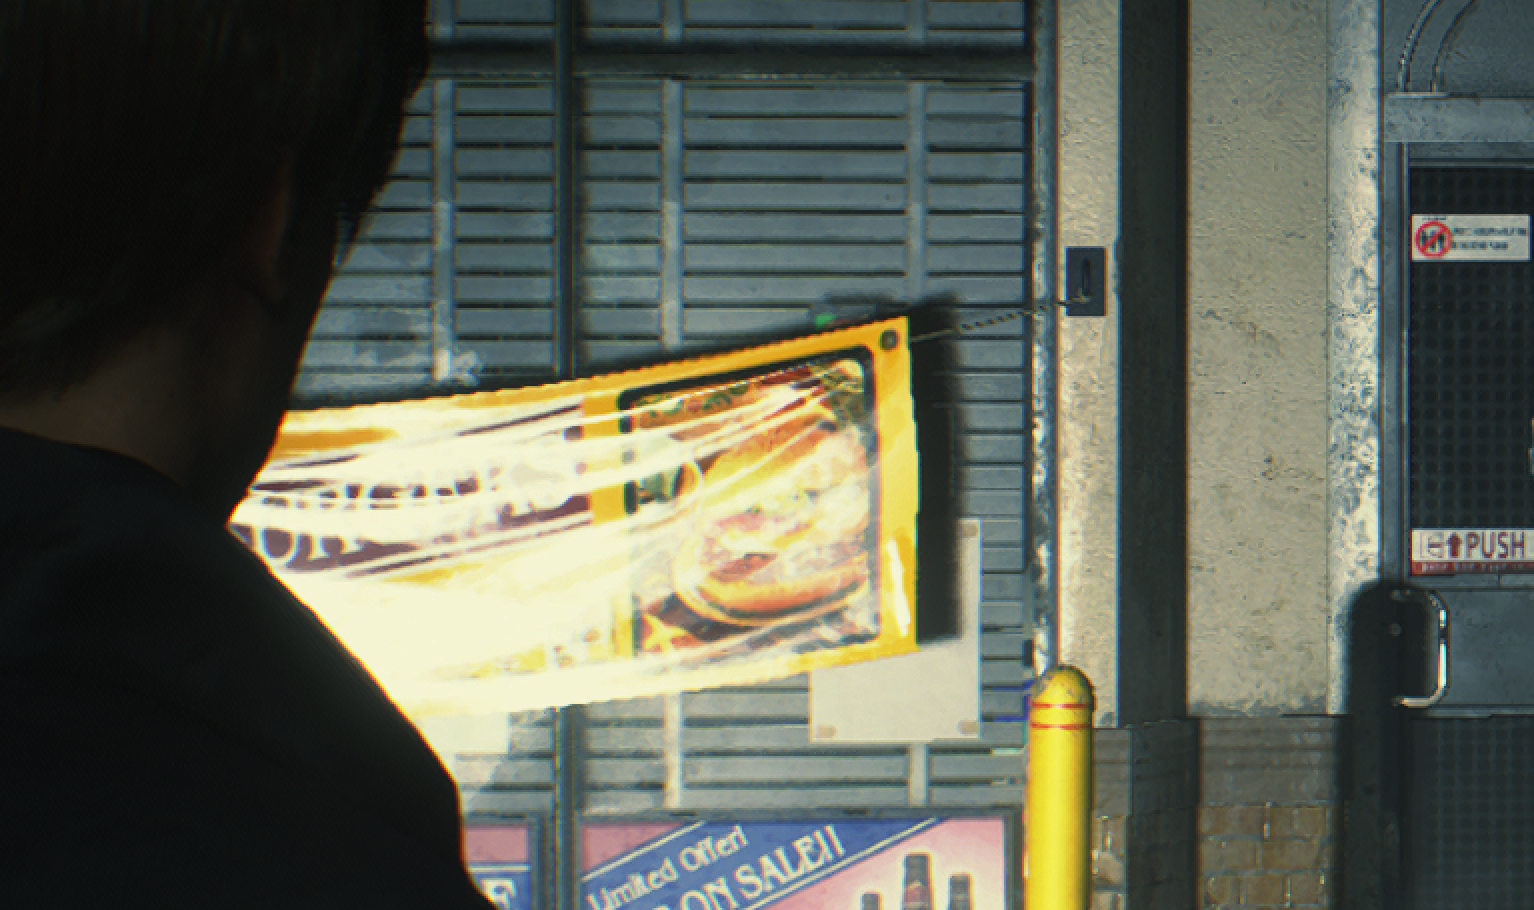
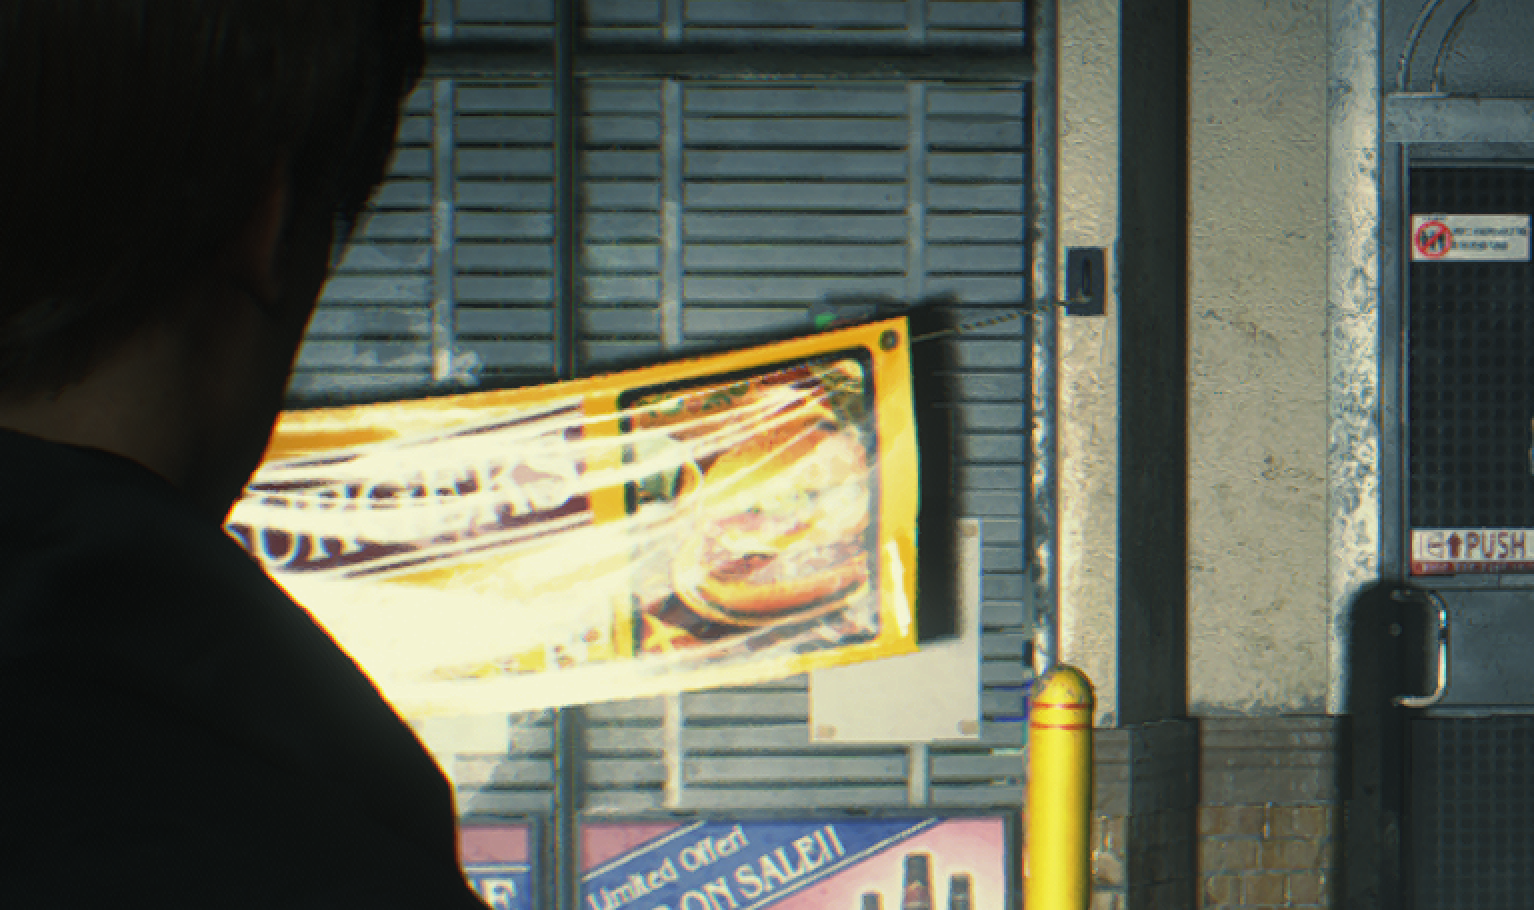
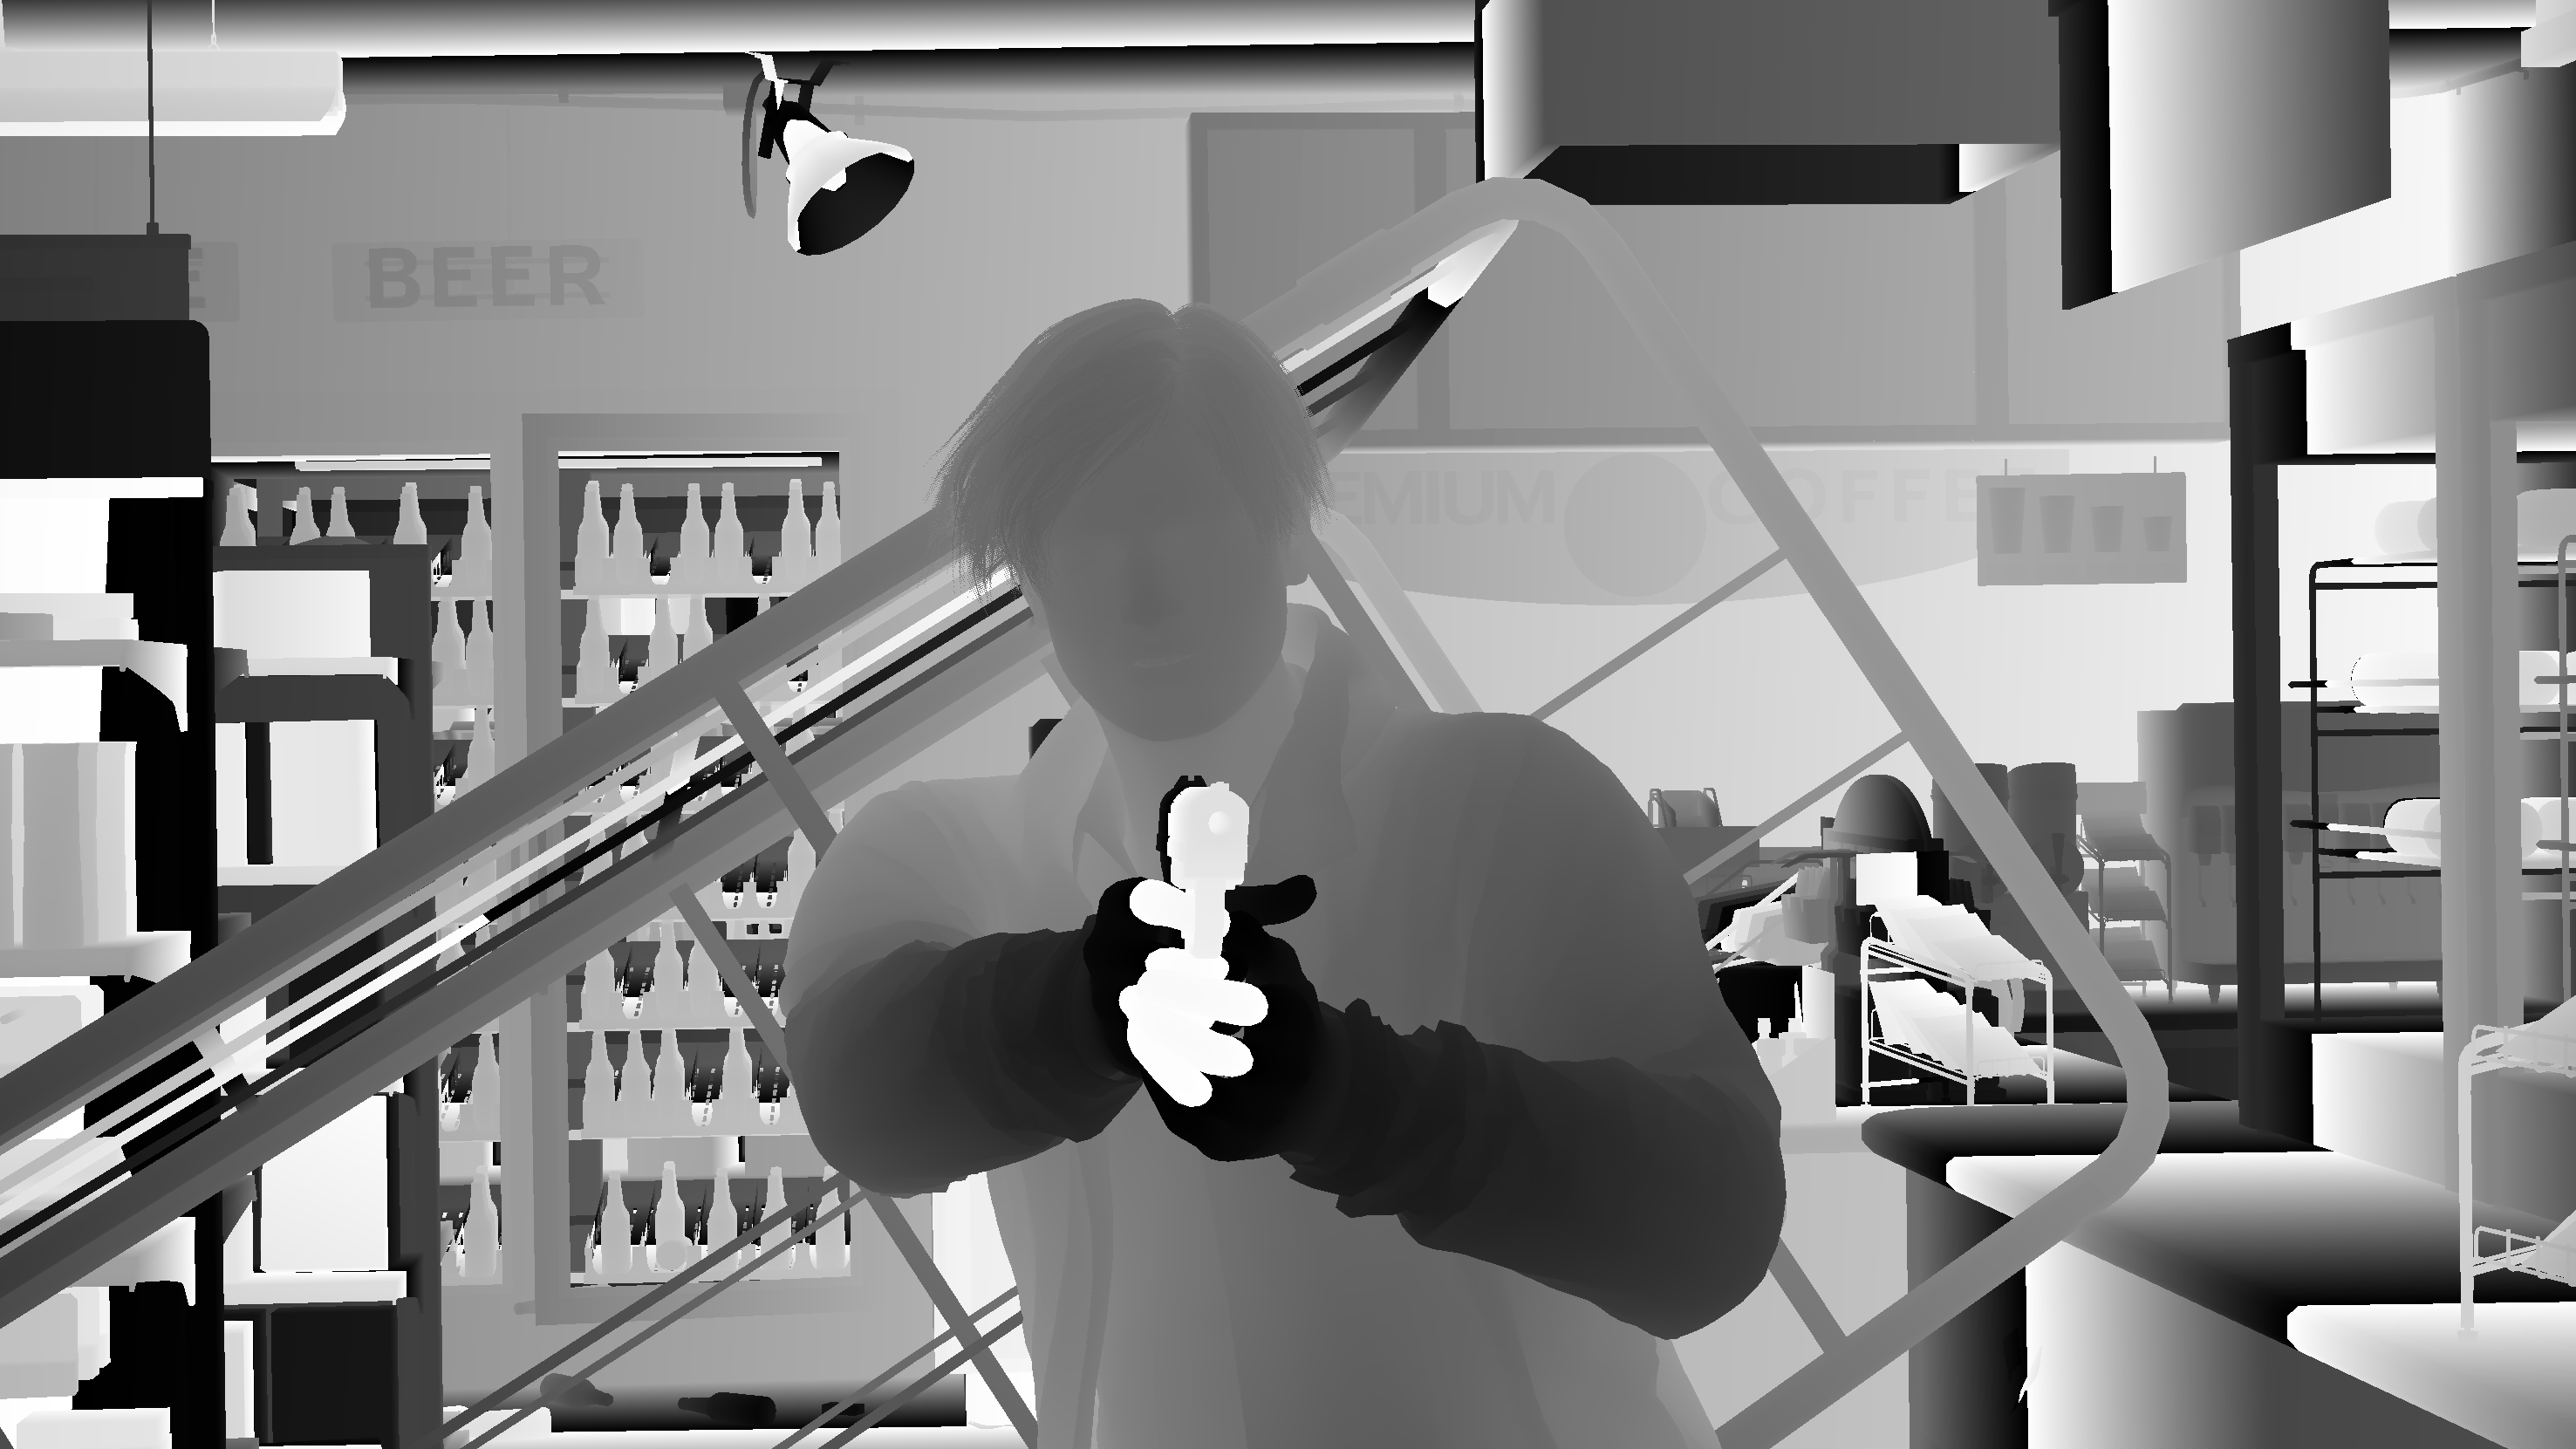
Nothing better than the supermarket level to demonstrate instancing. The super market while it’s chaotic, but it’s full of many instances of objects, starting from lighters, soda, medicines, chocolate, gum, to milk bottles, to cereal boxes,….and so on. Those draws are patched in several groups of ExecuteIndirect, each is a combination of several IndirectDrawIndexed.

Instancing is every time a group of “same” object shows up, this is an ExecuteIndirect draw
While this pass could seem to be dedicated to “drawing instances” as it is following right away the instancing compute, but drawing instances is not happening all at once in a dedicated pass, drawing process is a mixed bag of instances and normal unique objects draw. So don’t get confused from the gif. Instances are the ones that show up in batches, where single objects are usual normal draw (this including Leon as a GPU skinned object).
Totally Not Important Interesting Note
Leon’s vertices count for major parts is as follow
- Leon’s Head = 54348
- Leon’s Eyes = 10320
- Leon’s Pants = 53505
- Leon’s Hands = 24582
- Leon’s Buttons = 2436
- Leon’s Shirt = 18378
- Leon’s Jacket = 115986 + 5619 //jacket + outlines
- Leon’s Hair = 11484 + 80565 //2hair layers
- Leon’s Eyebrow & Eyelids = 16194
- Leon’s Shoes = 9348
There are some other details here & there, but those are the main parts of Leon!
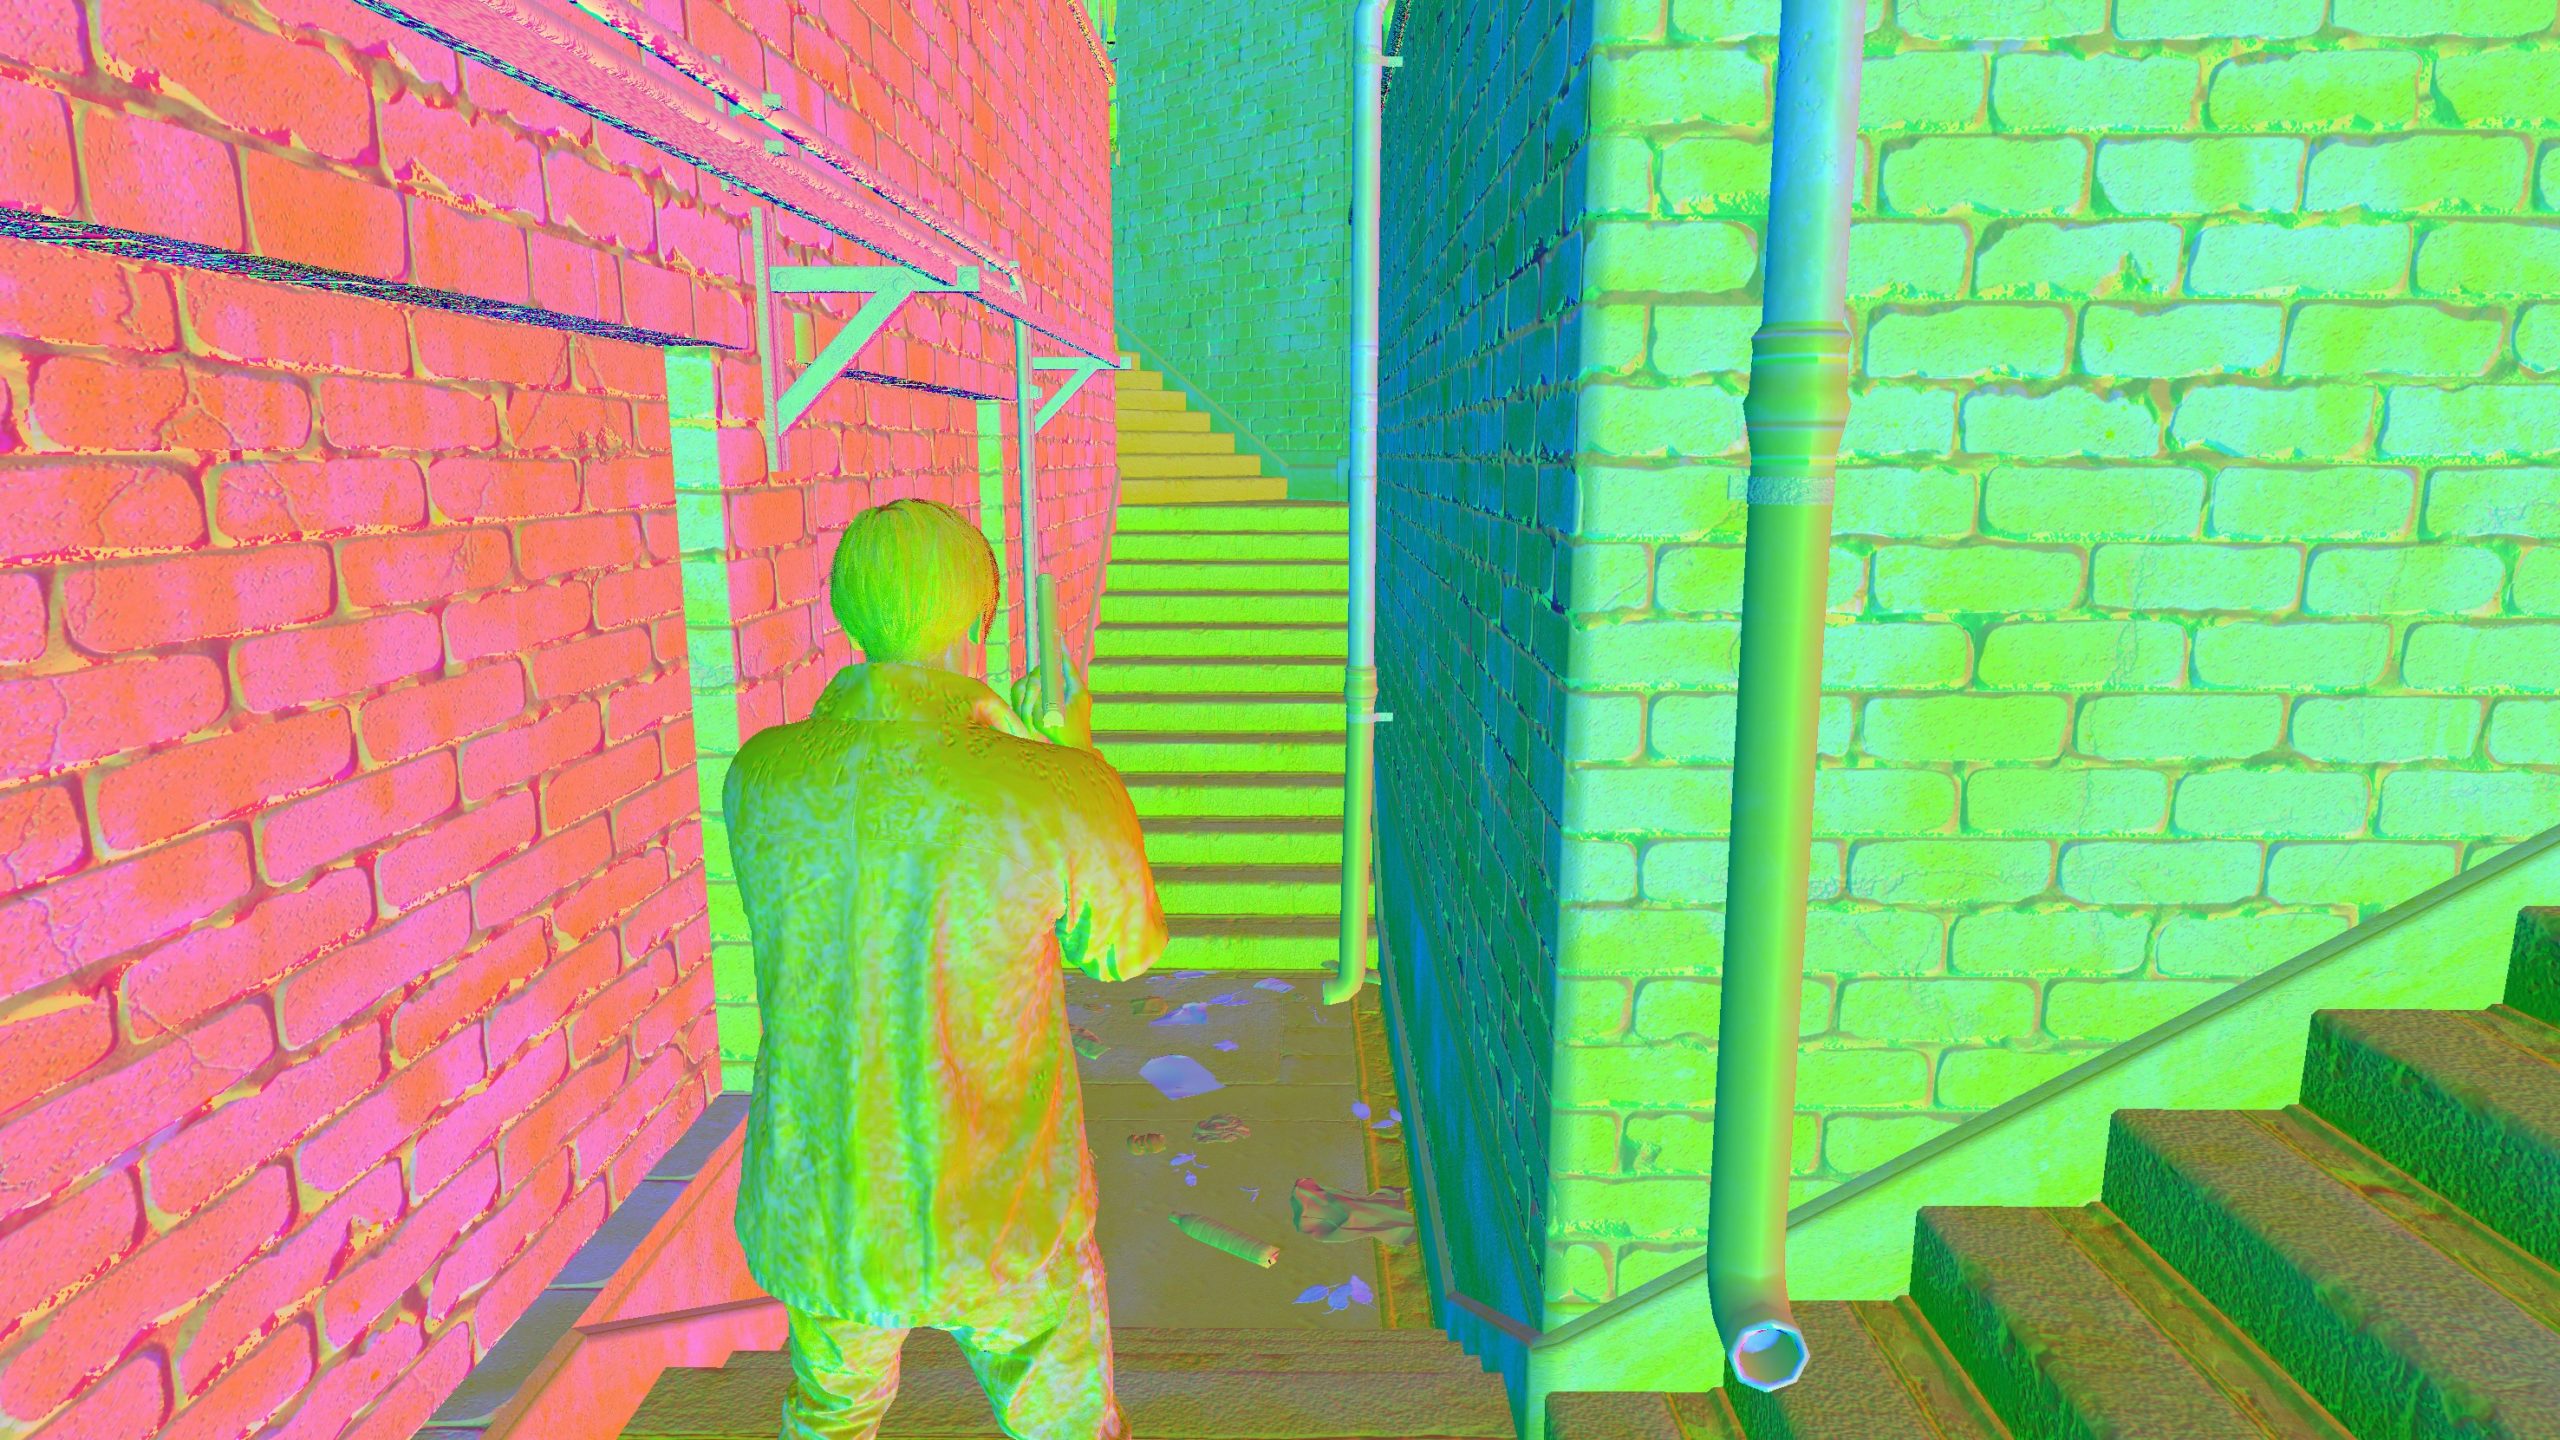
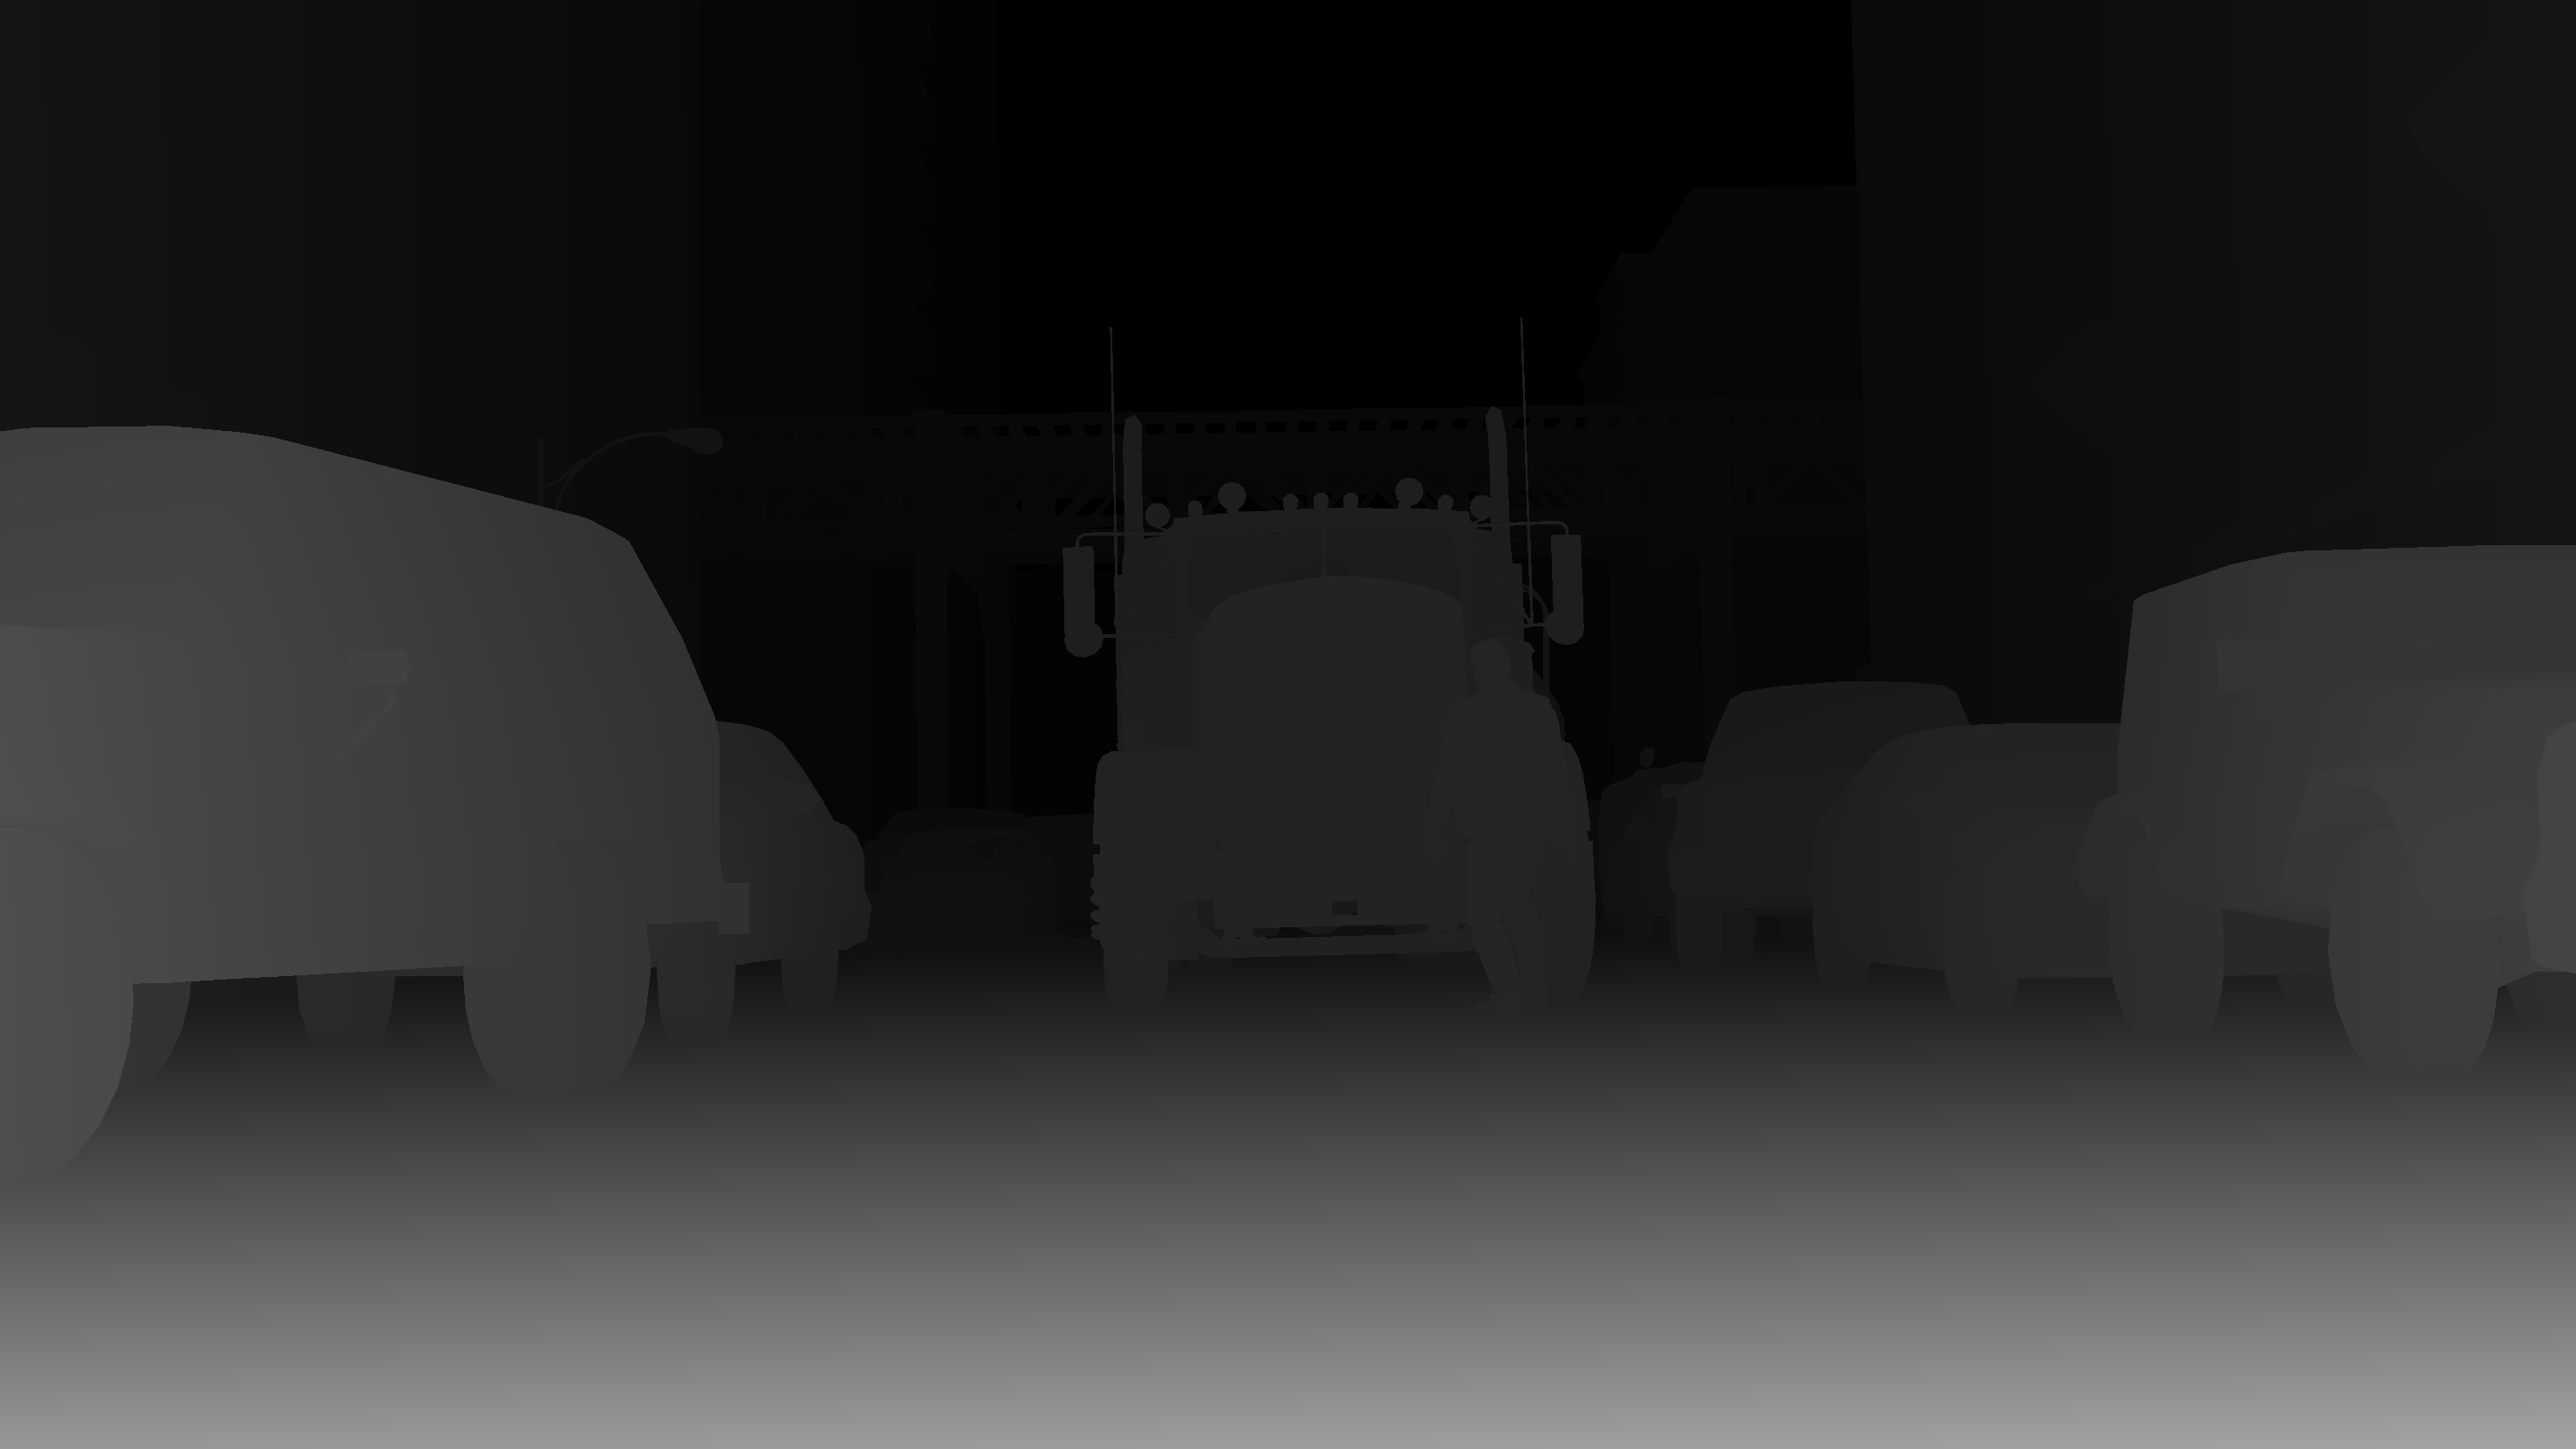
GBuffer/Deferred
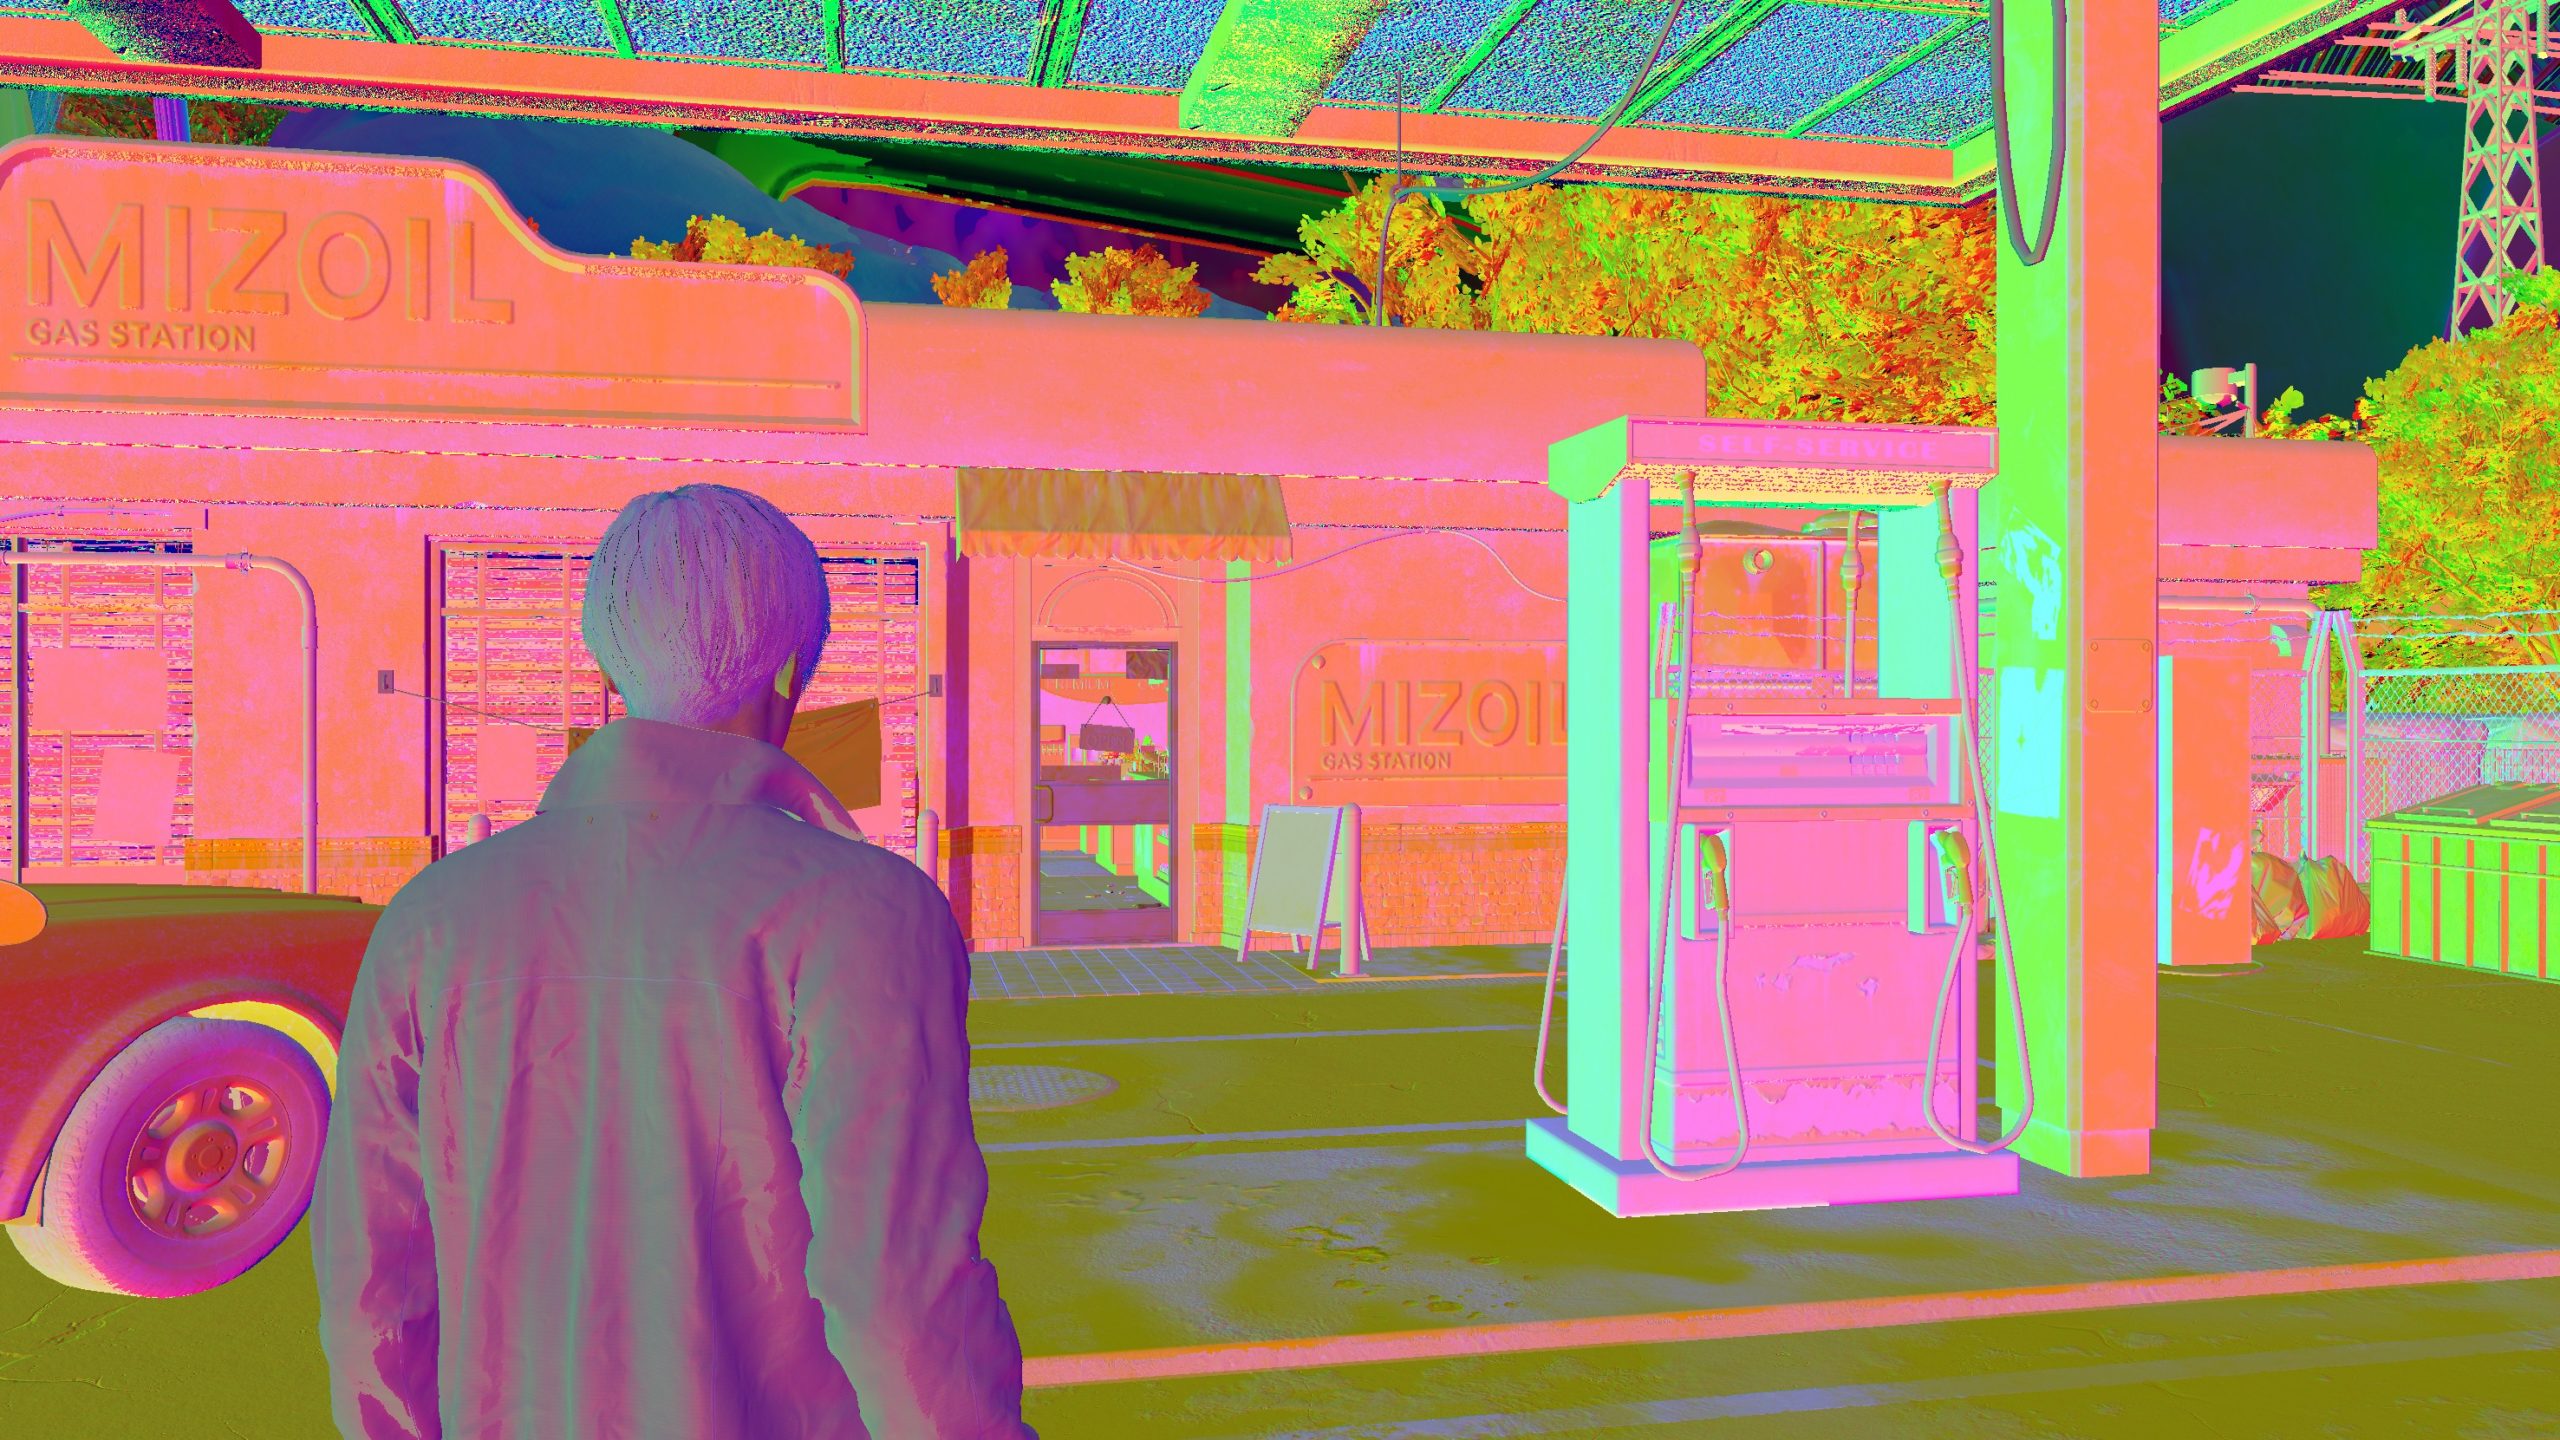
Geometry
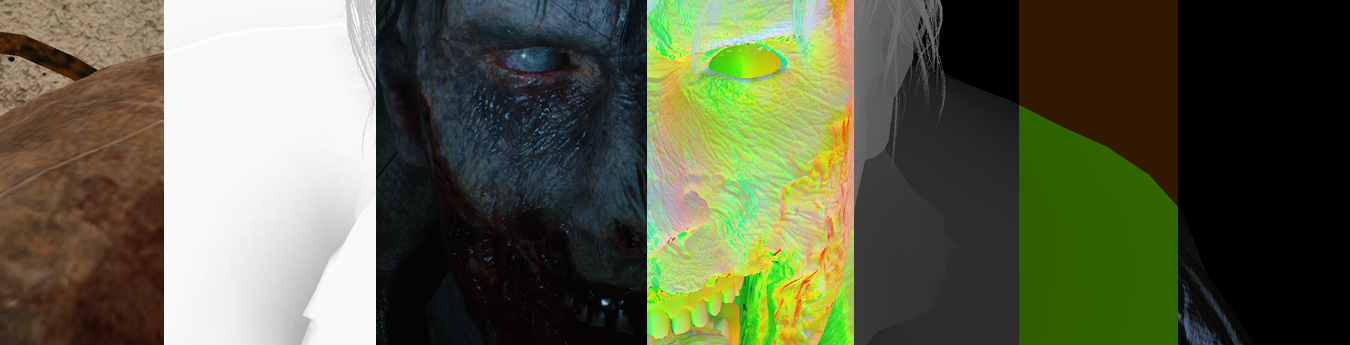
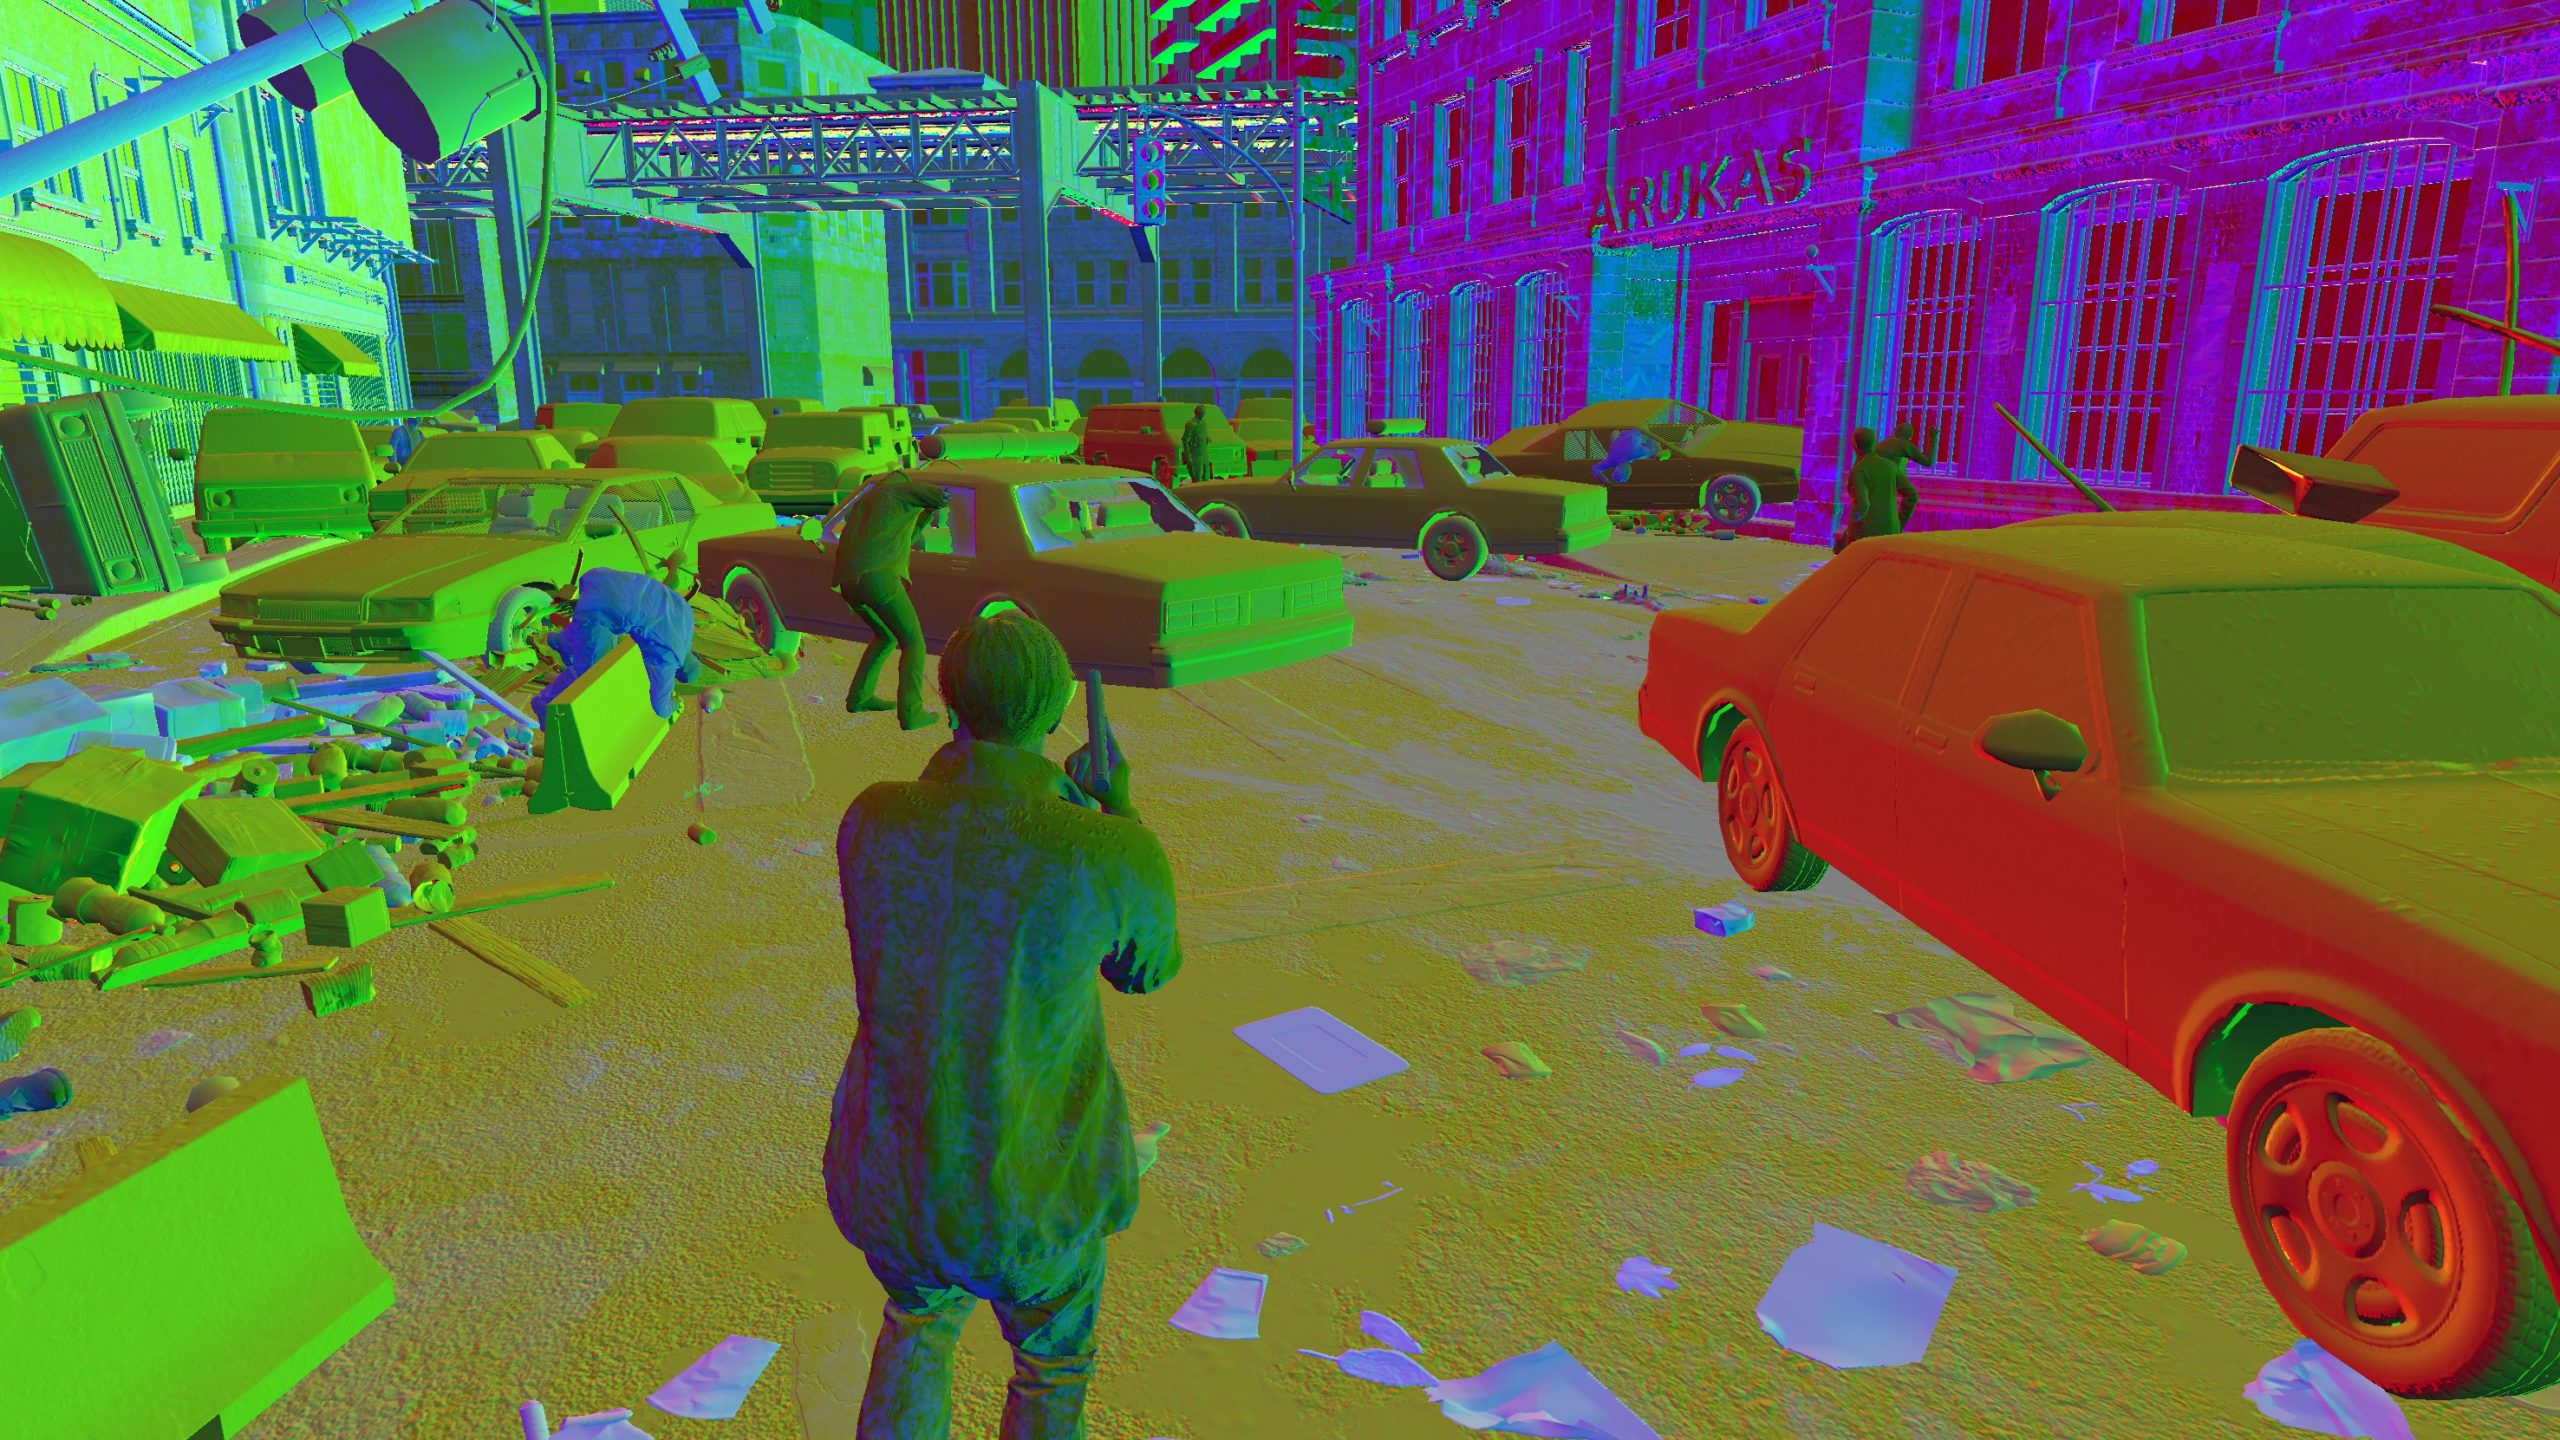
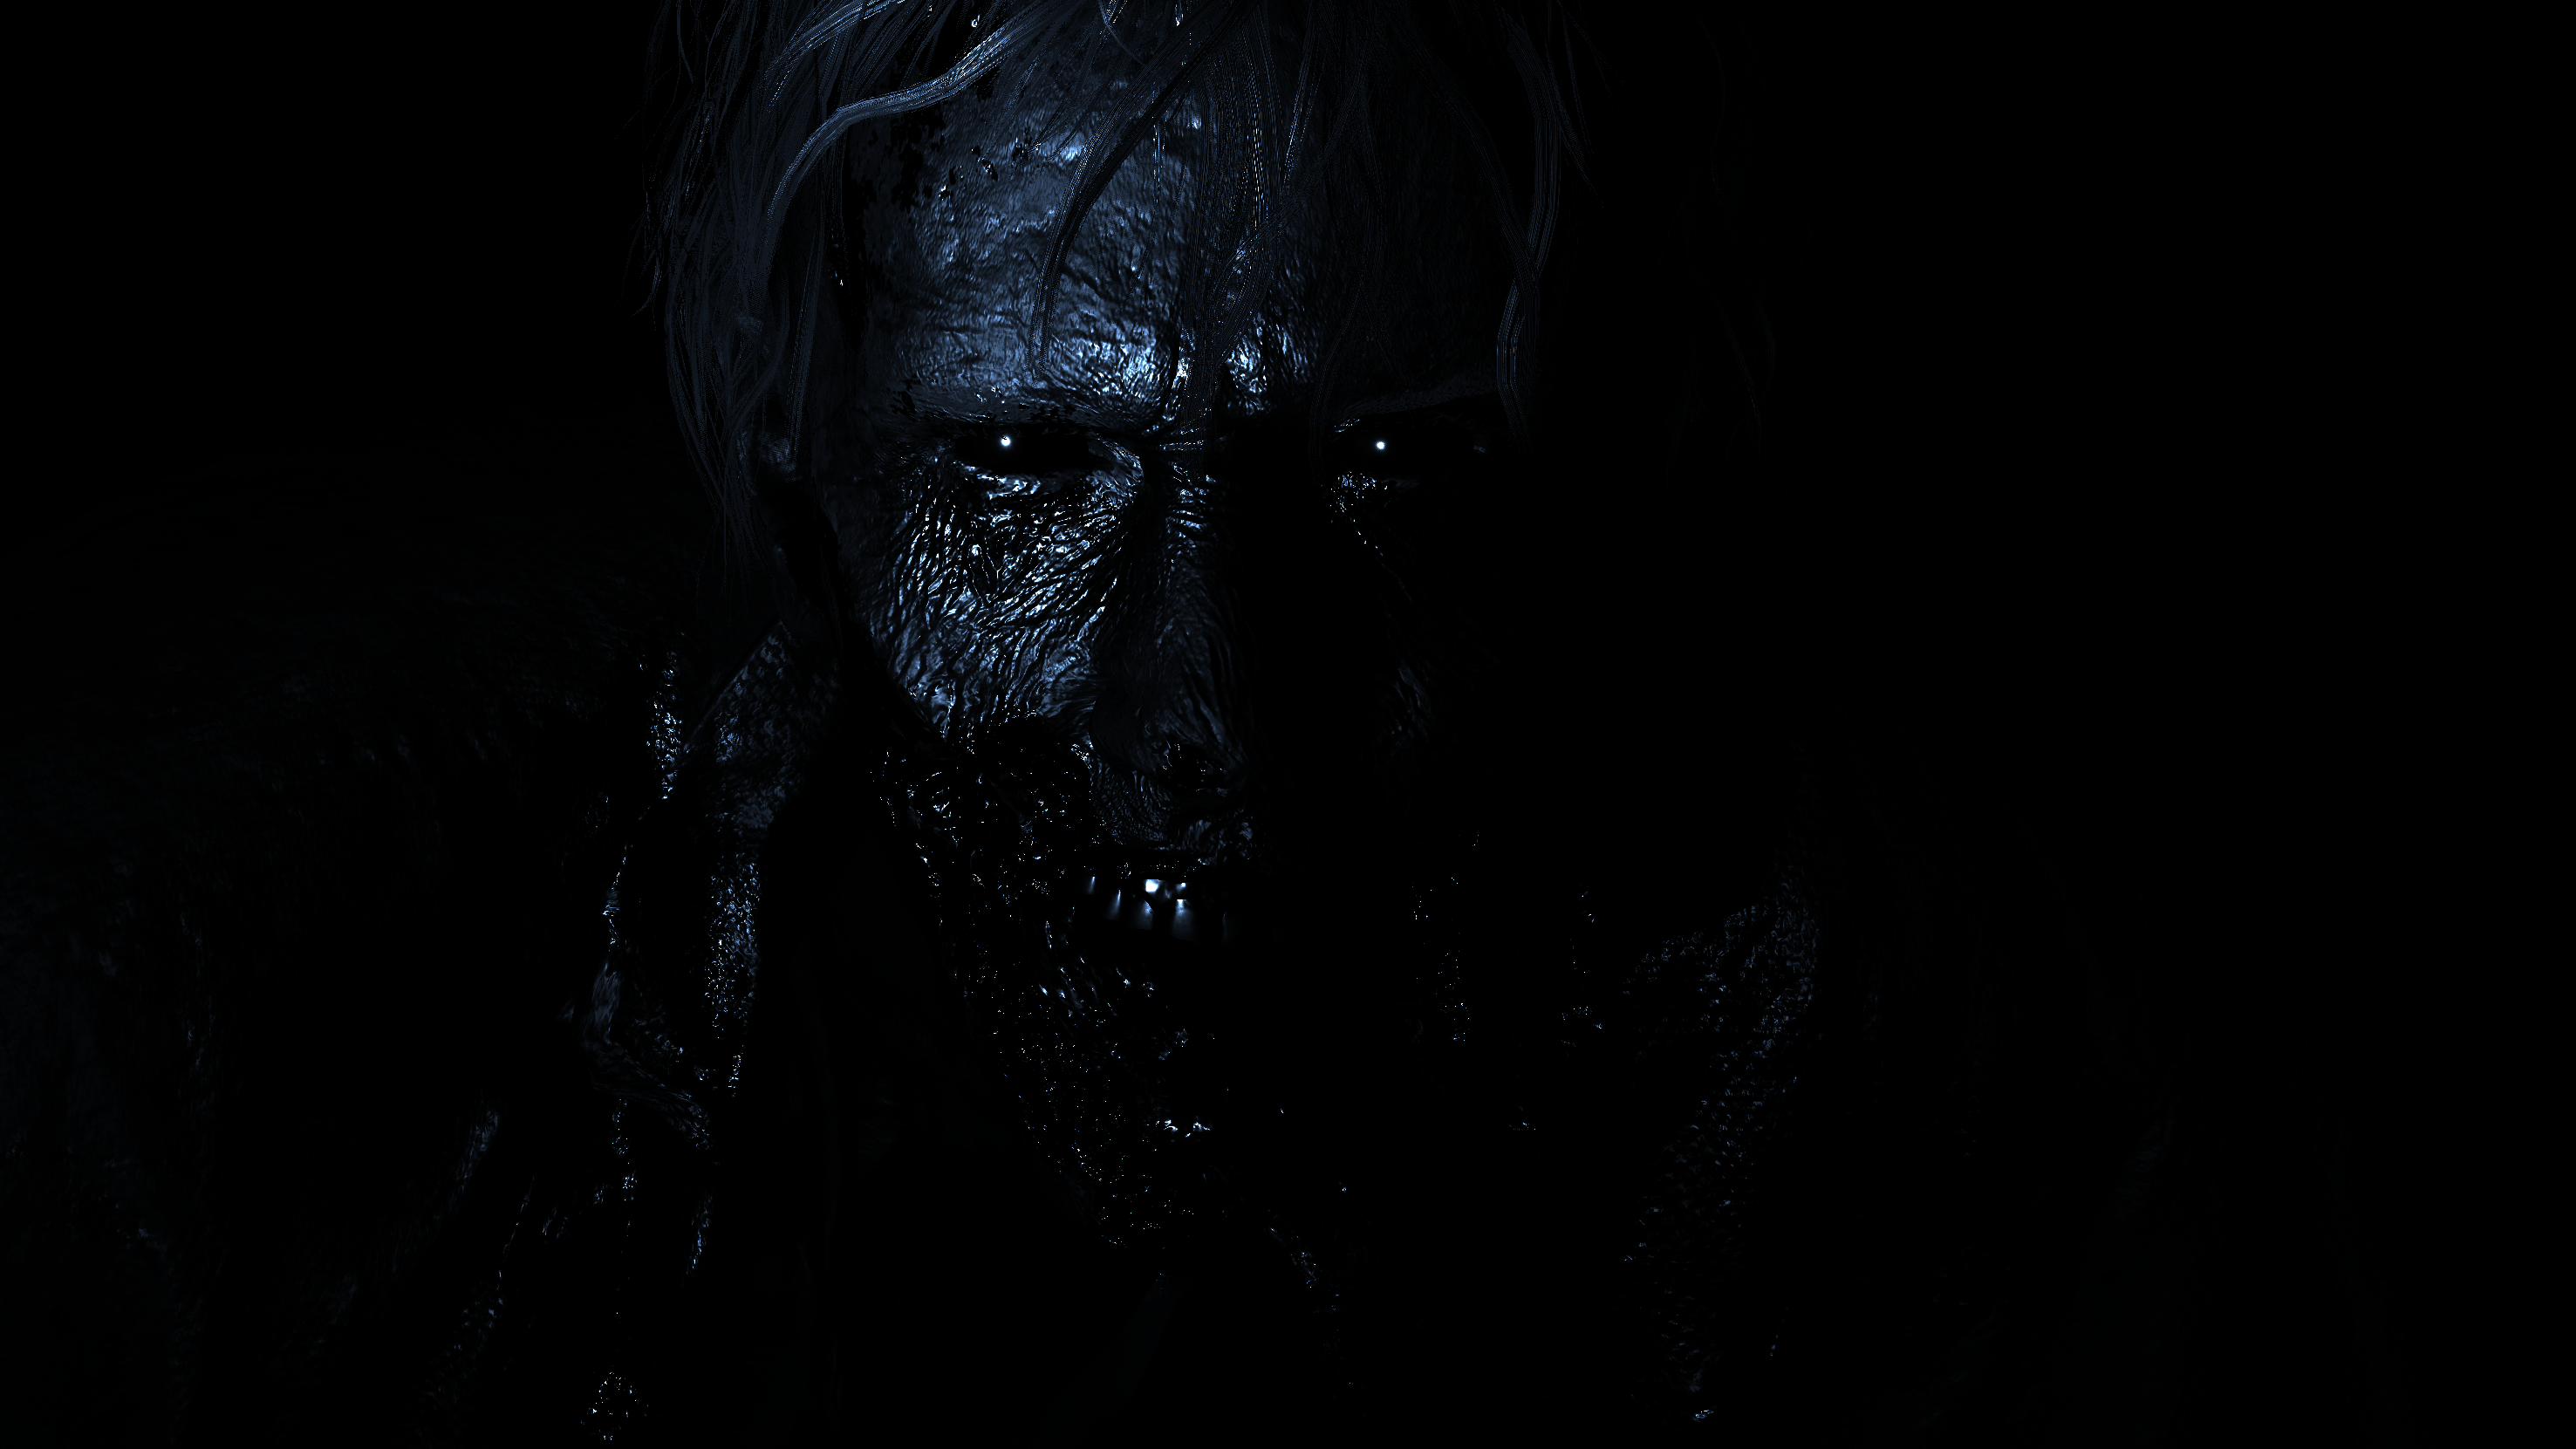
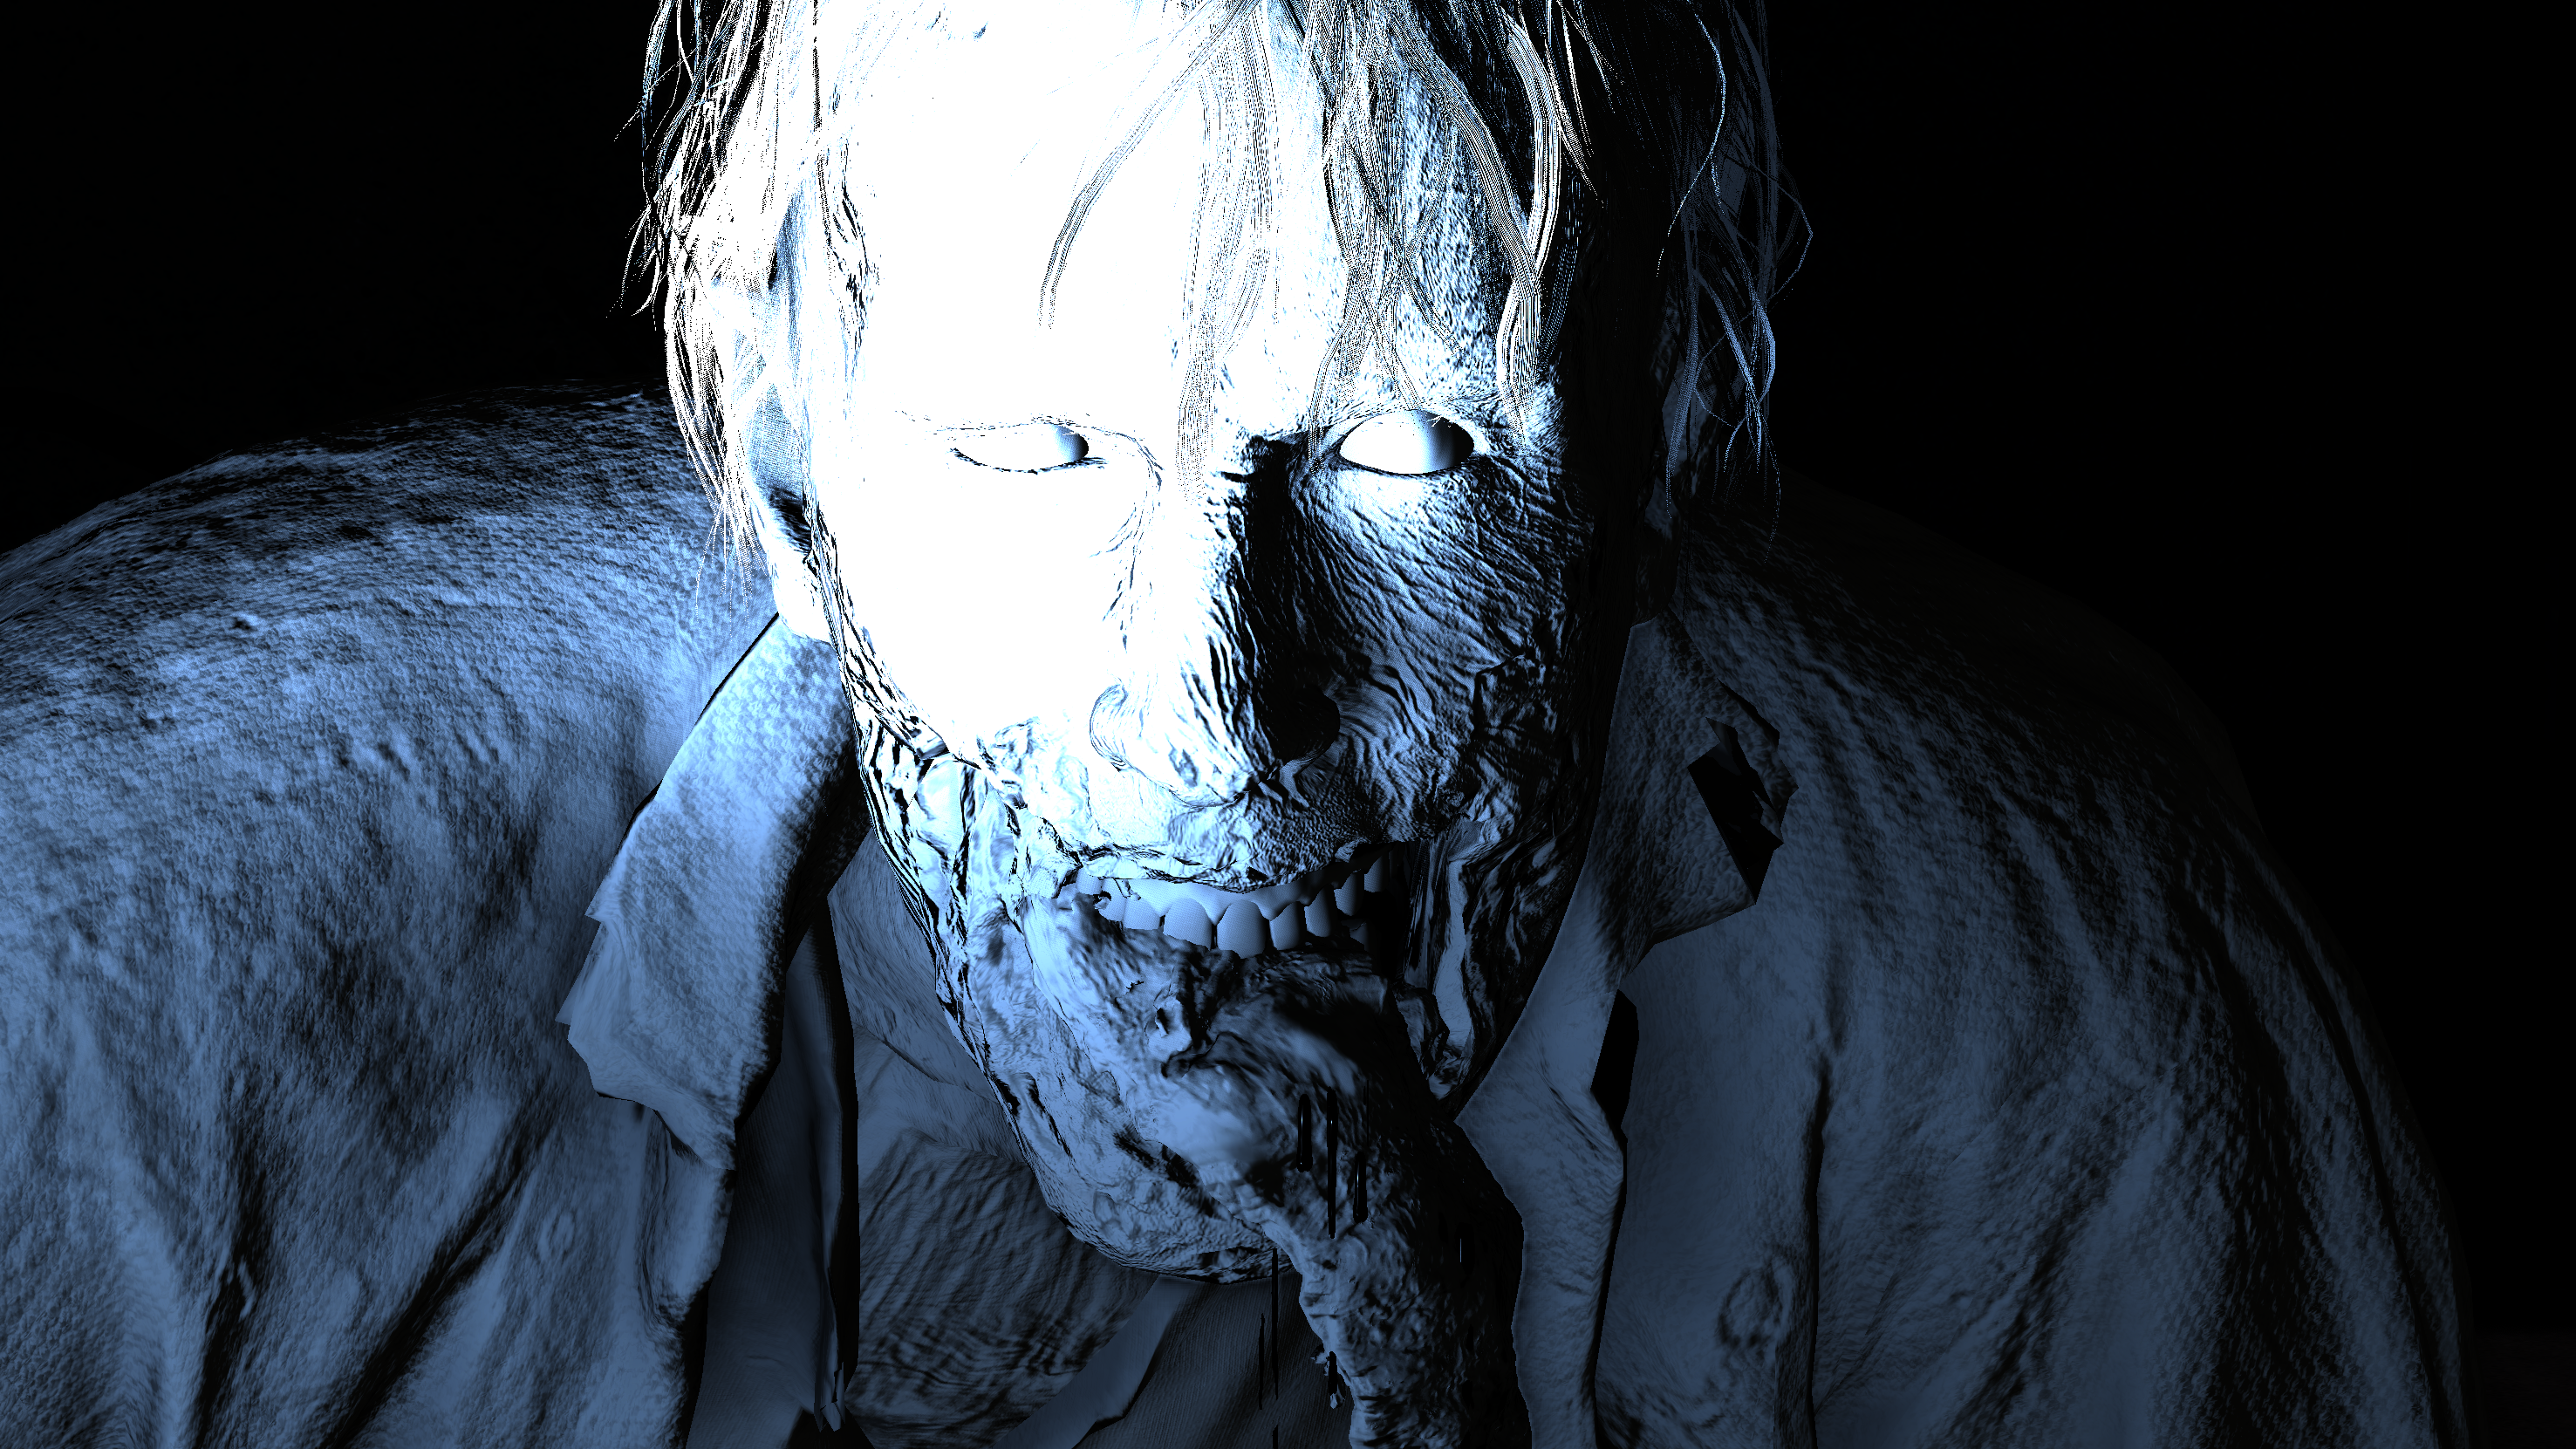
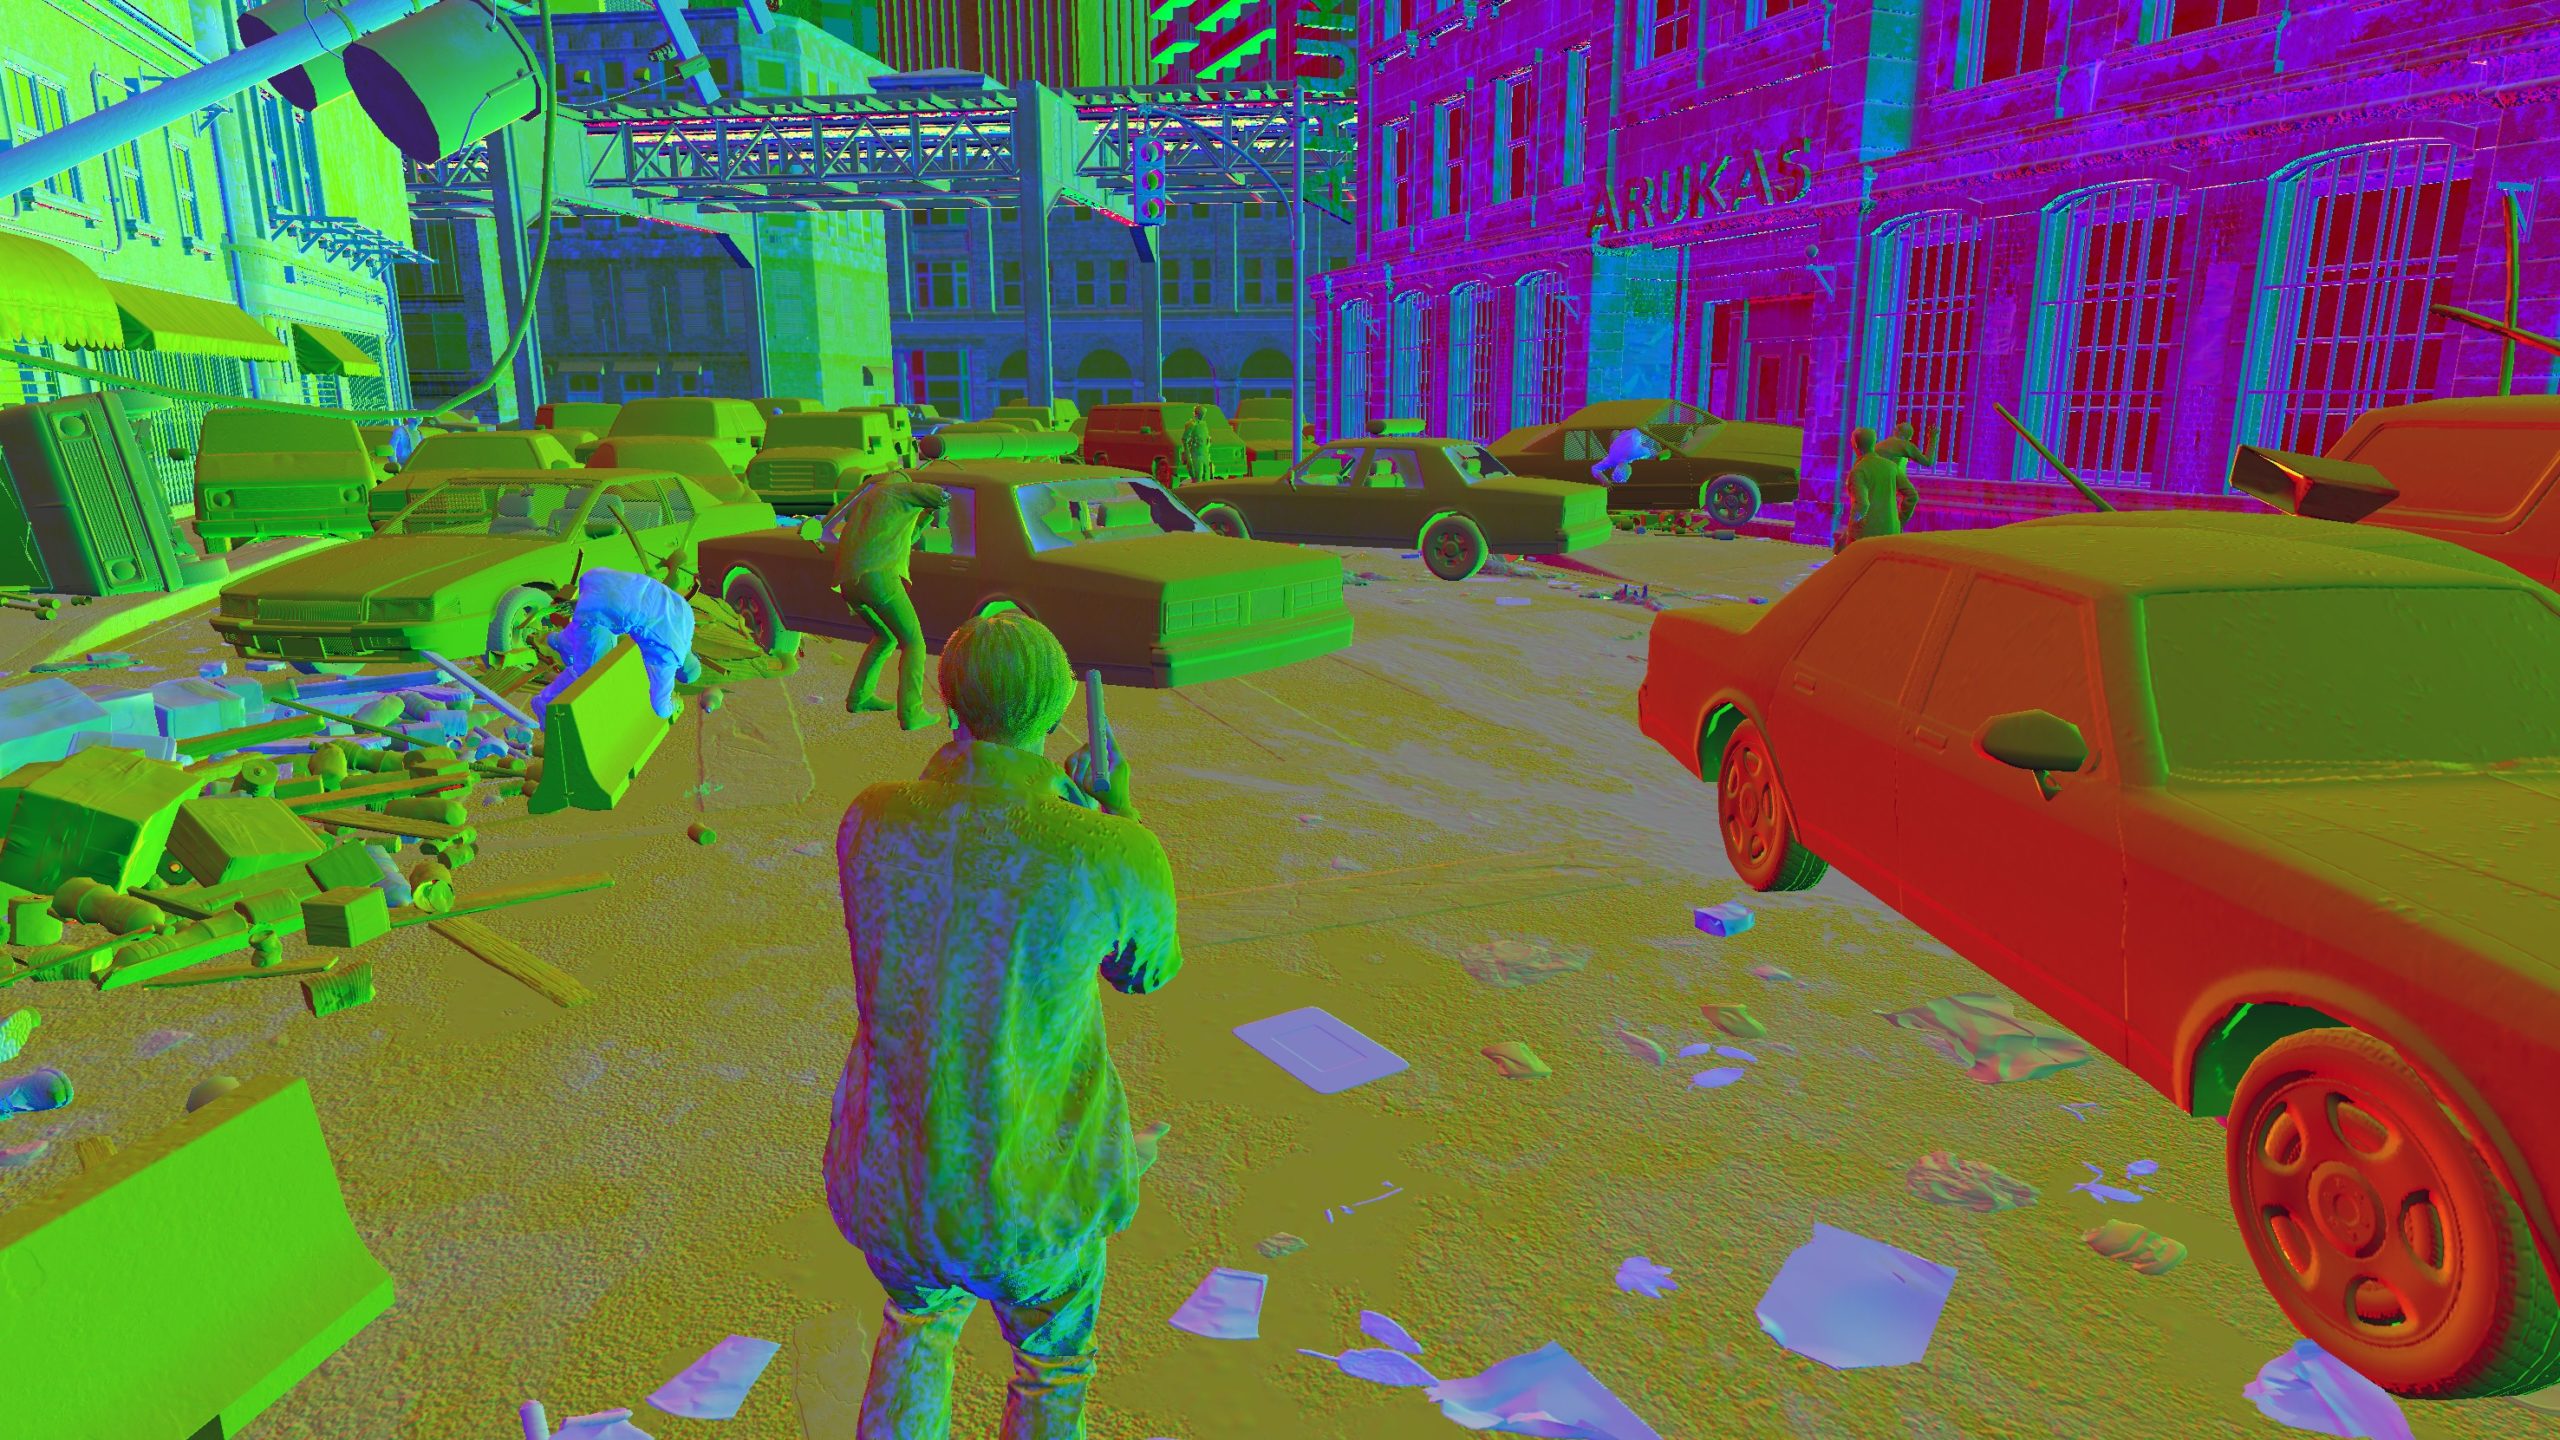
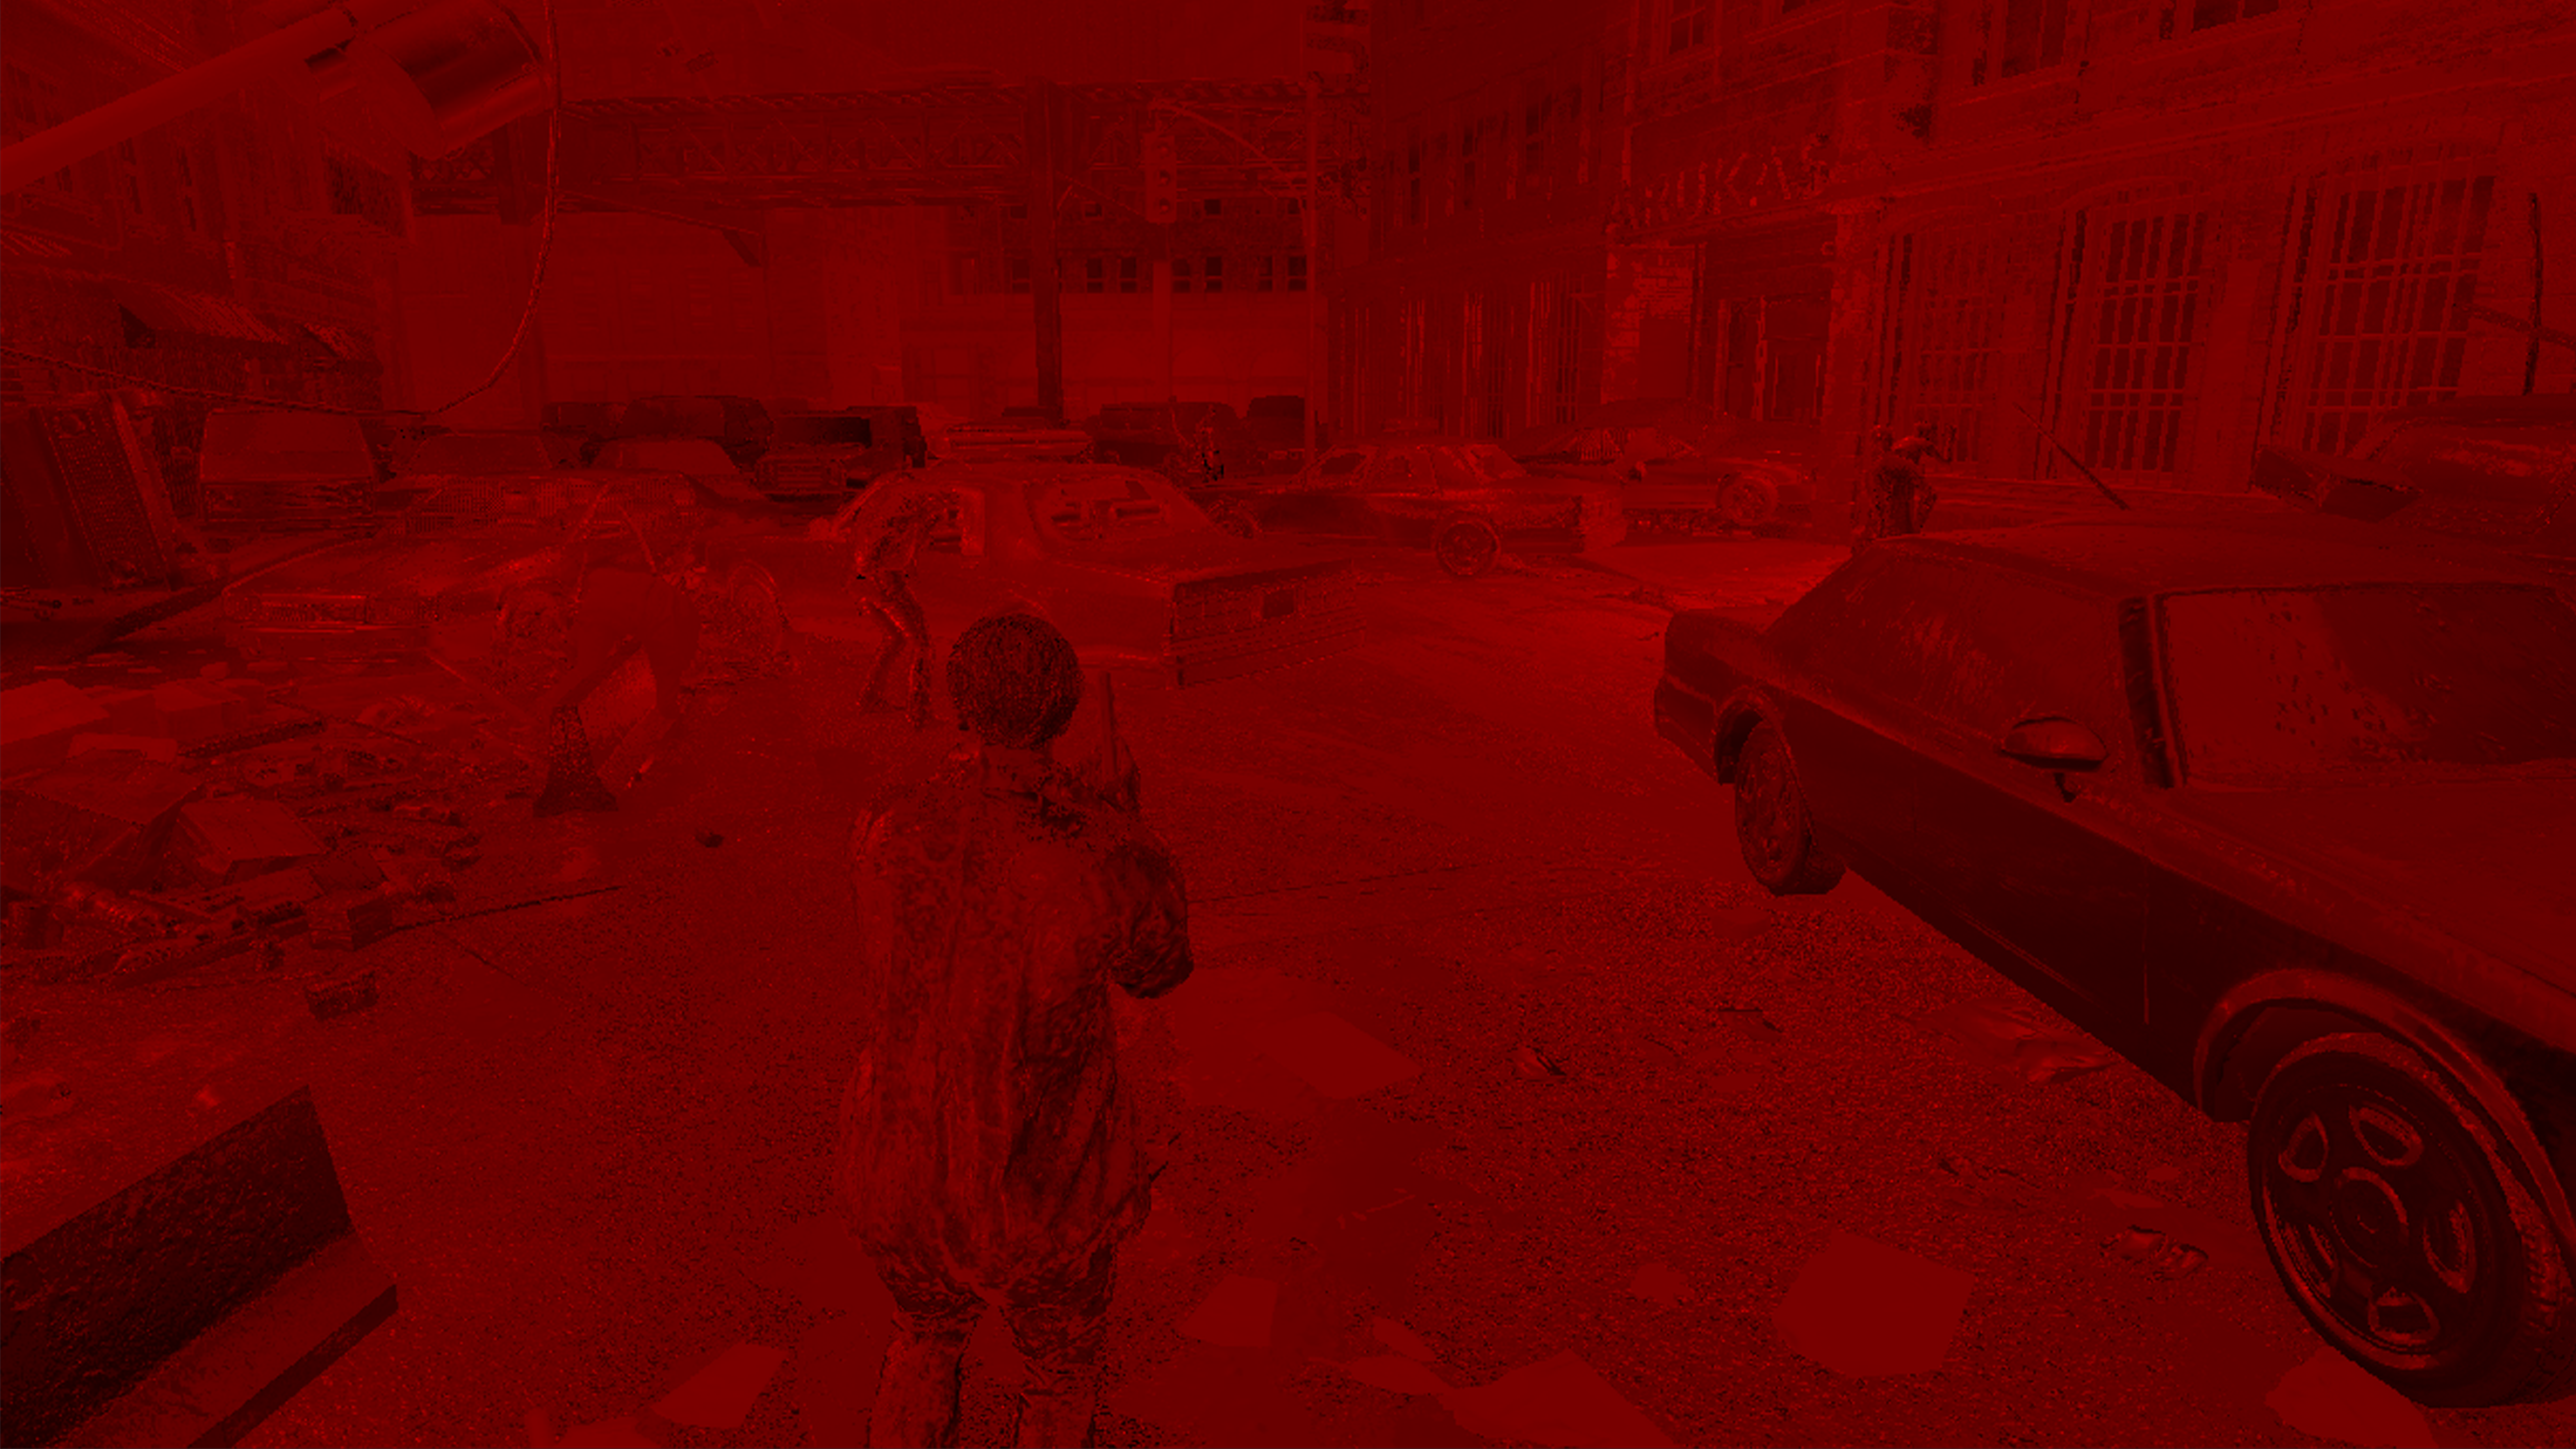
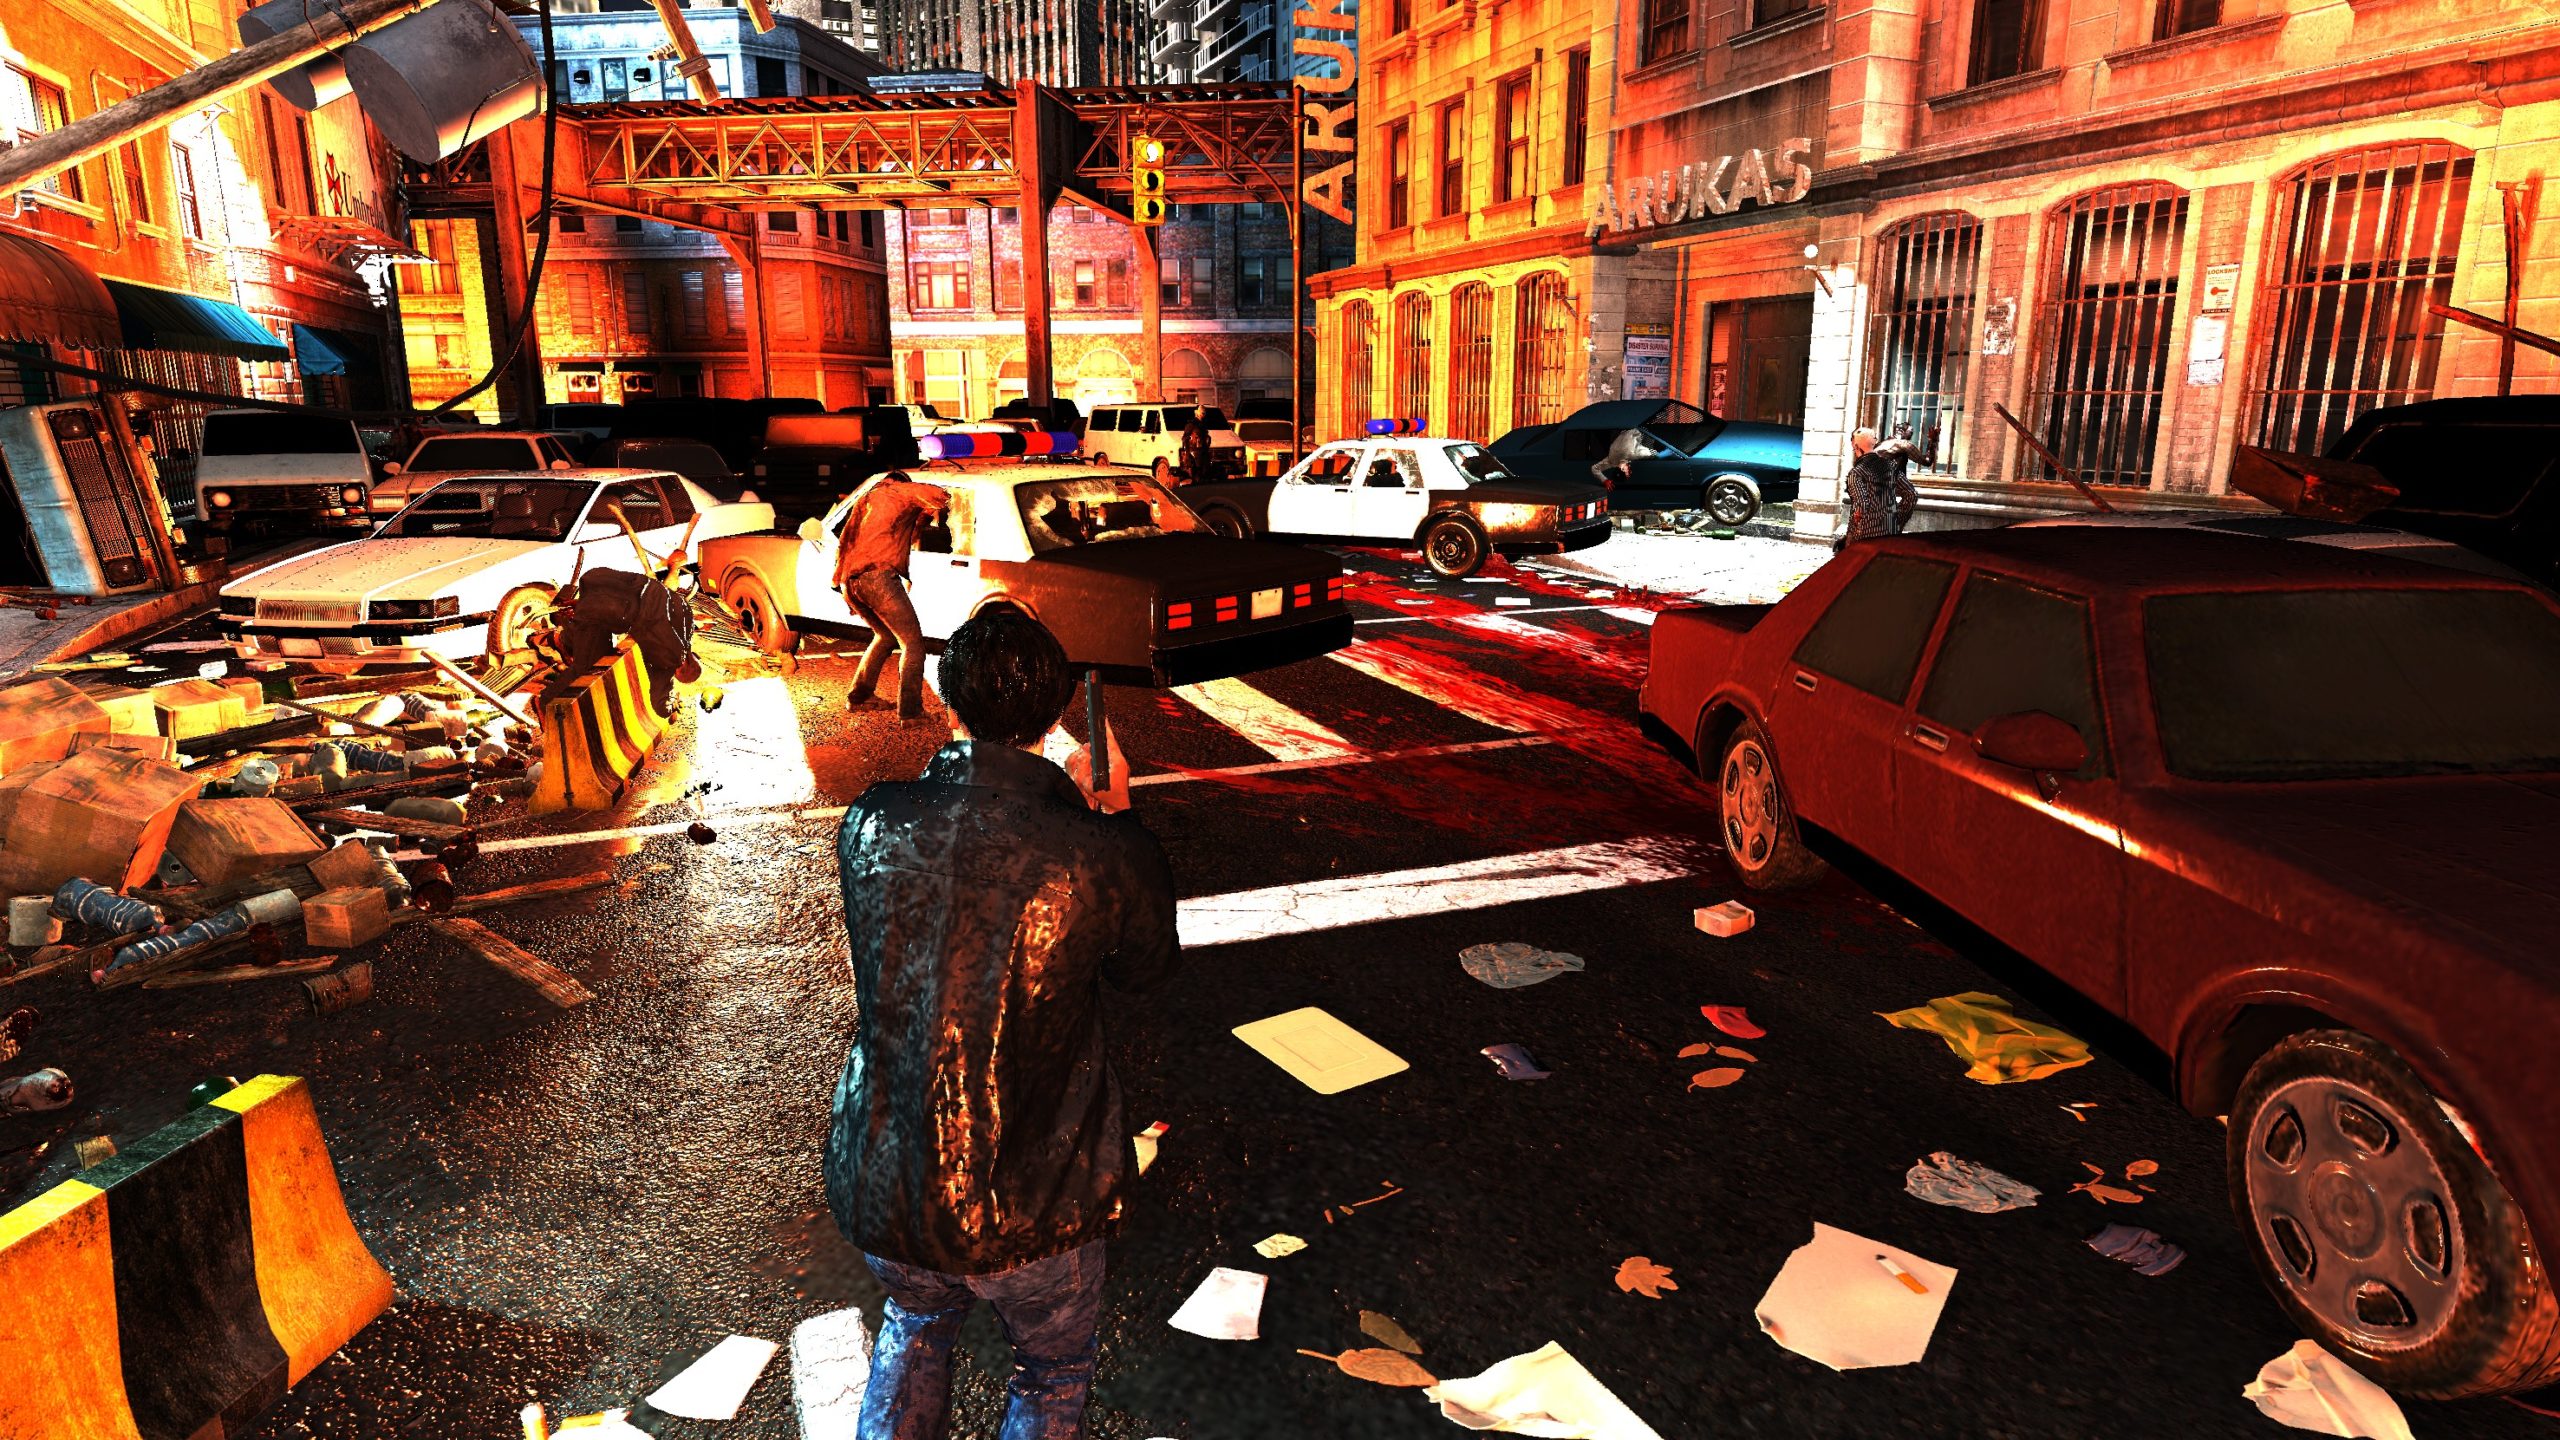
When i started “casually” looking into RE games frame captures, i was not very keen that i’ll proceed in that or not. it happens many times that i lose interest. But because the last few games i checked (2 of them made it to articles already) i was not a big fan of the GBuffer utilization. It’s either a big-fat GBuffer, or it is manageable amount of targets, but most of them have solid black unused channels. Either way, those GBuffers was not resulting that WOW visual quality for the final frames. BUT…and it’s a big BUT, as soon as i saw the GBuffer for RE games, i decided to proceed with the captures till the end.
GBuffers in RE Engine based games are well utilized, very small amount of targets, well planned, and every channel is used. Not only that, with that 3 targets in the GBuffer (which is in good formats as well) the engine is able to deliver a very impressive visual quality for the final frames…


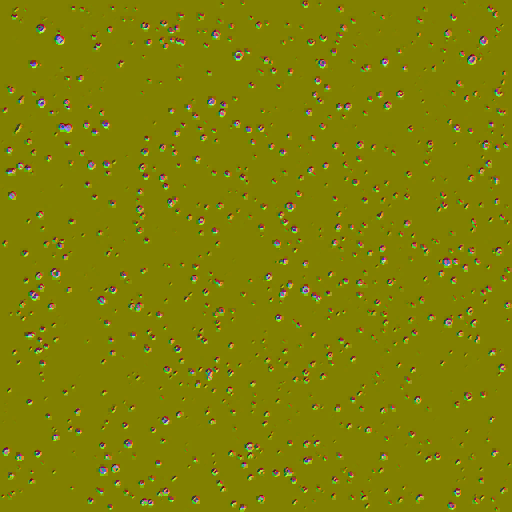
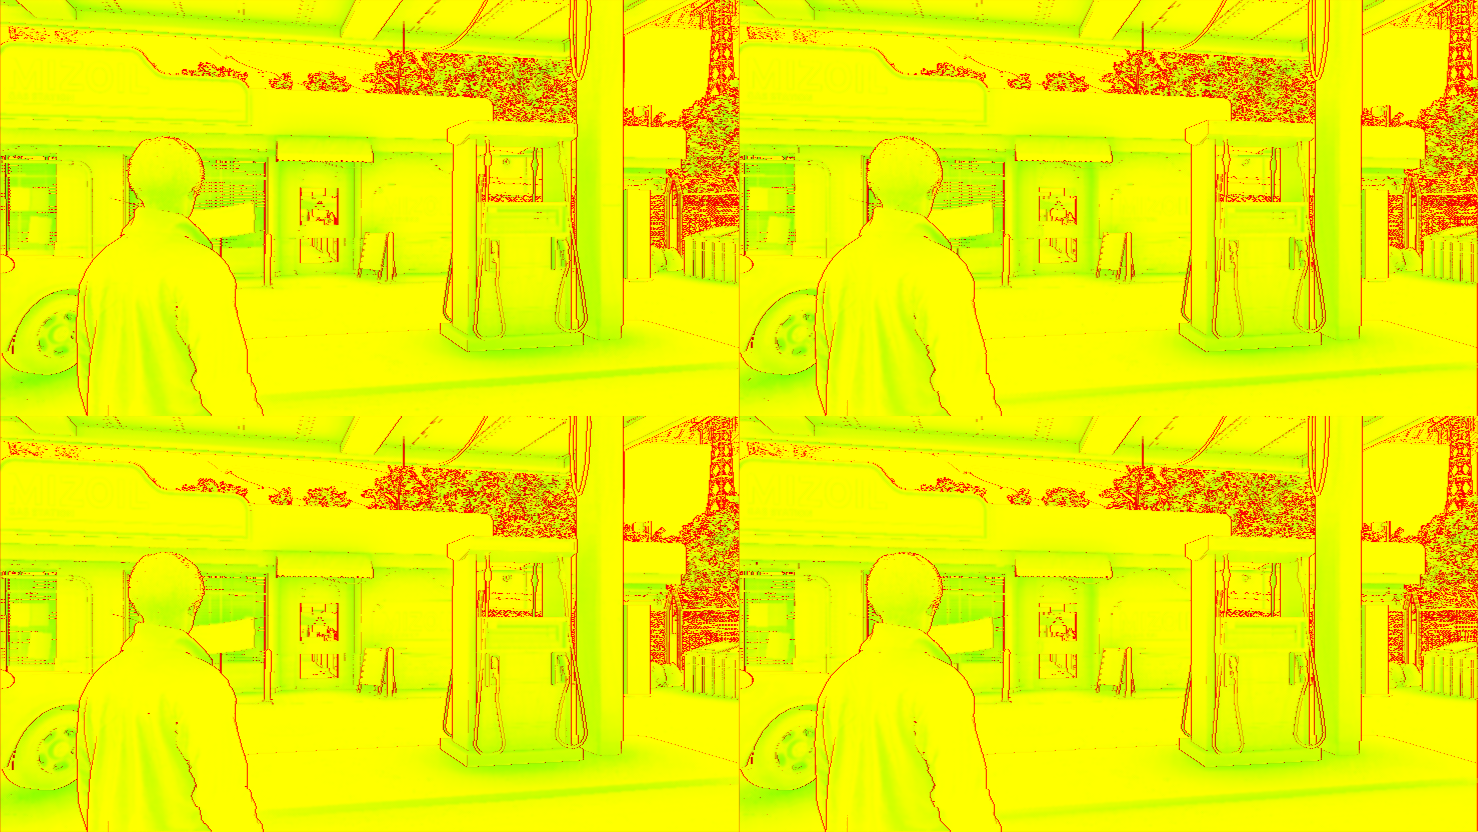
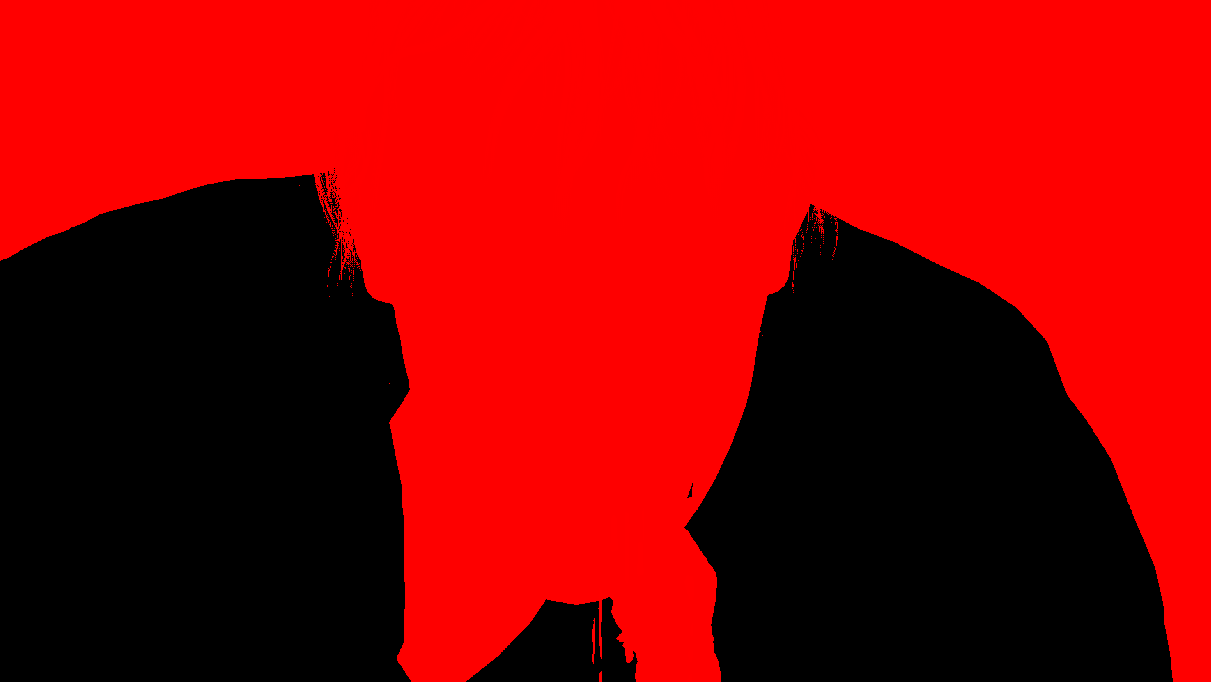
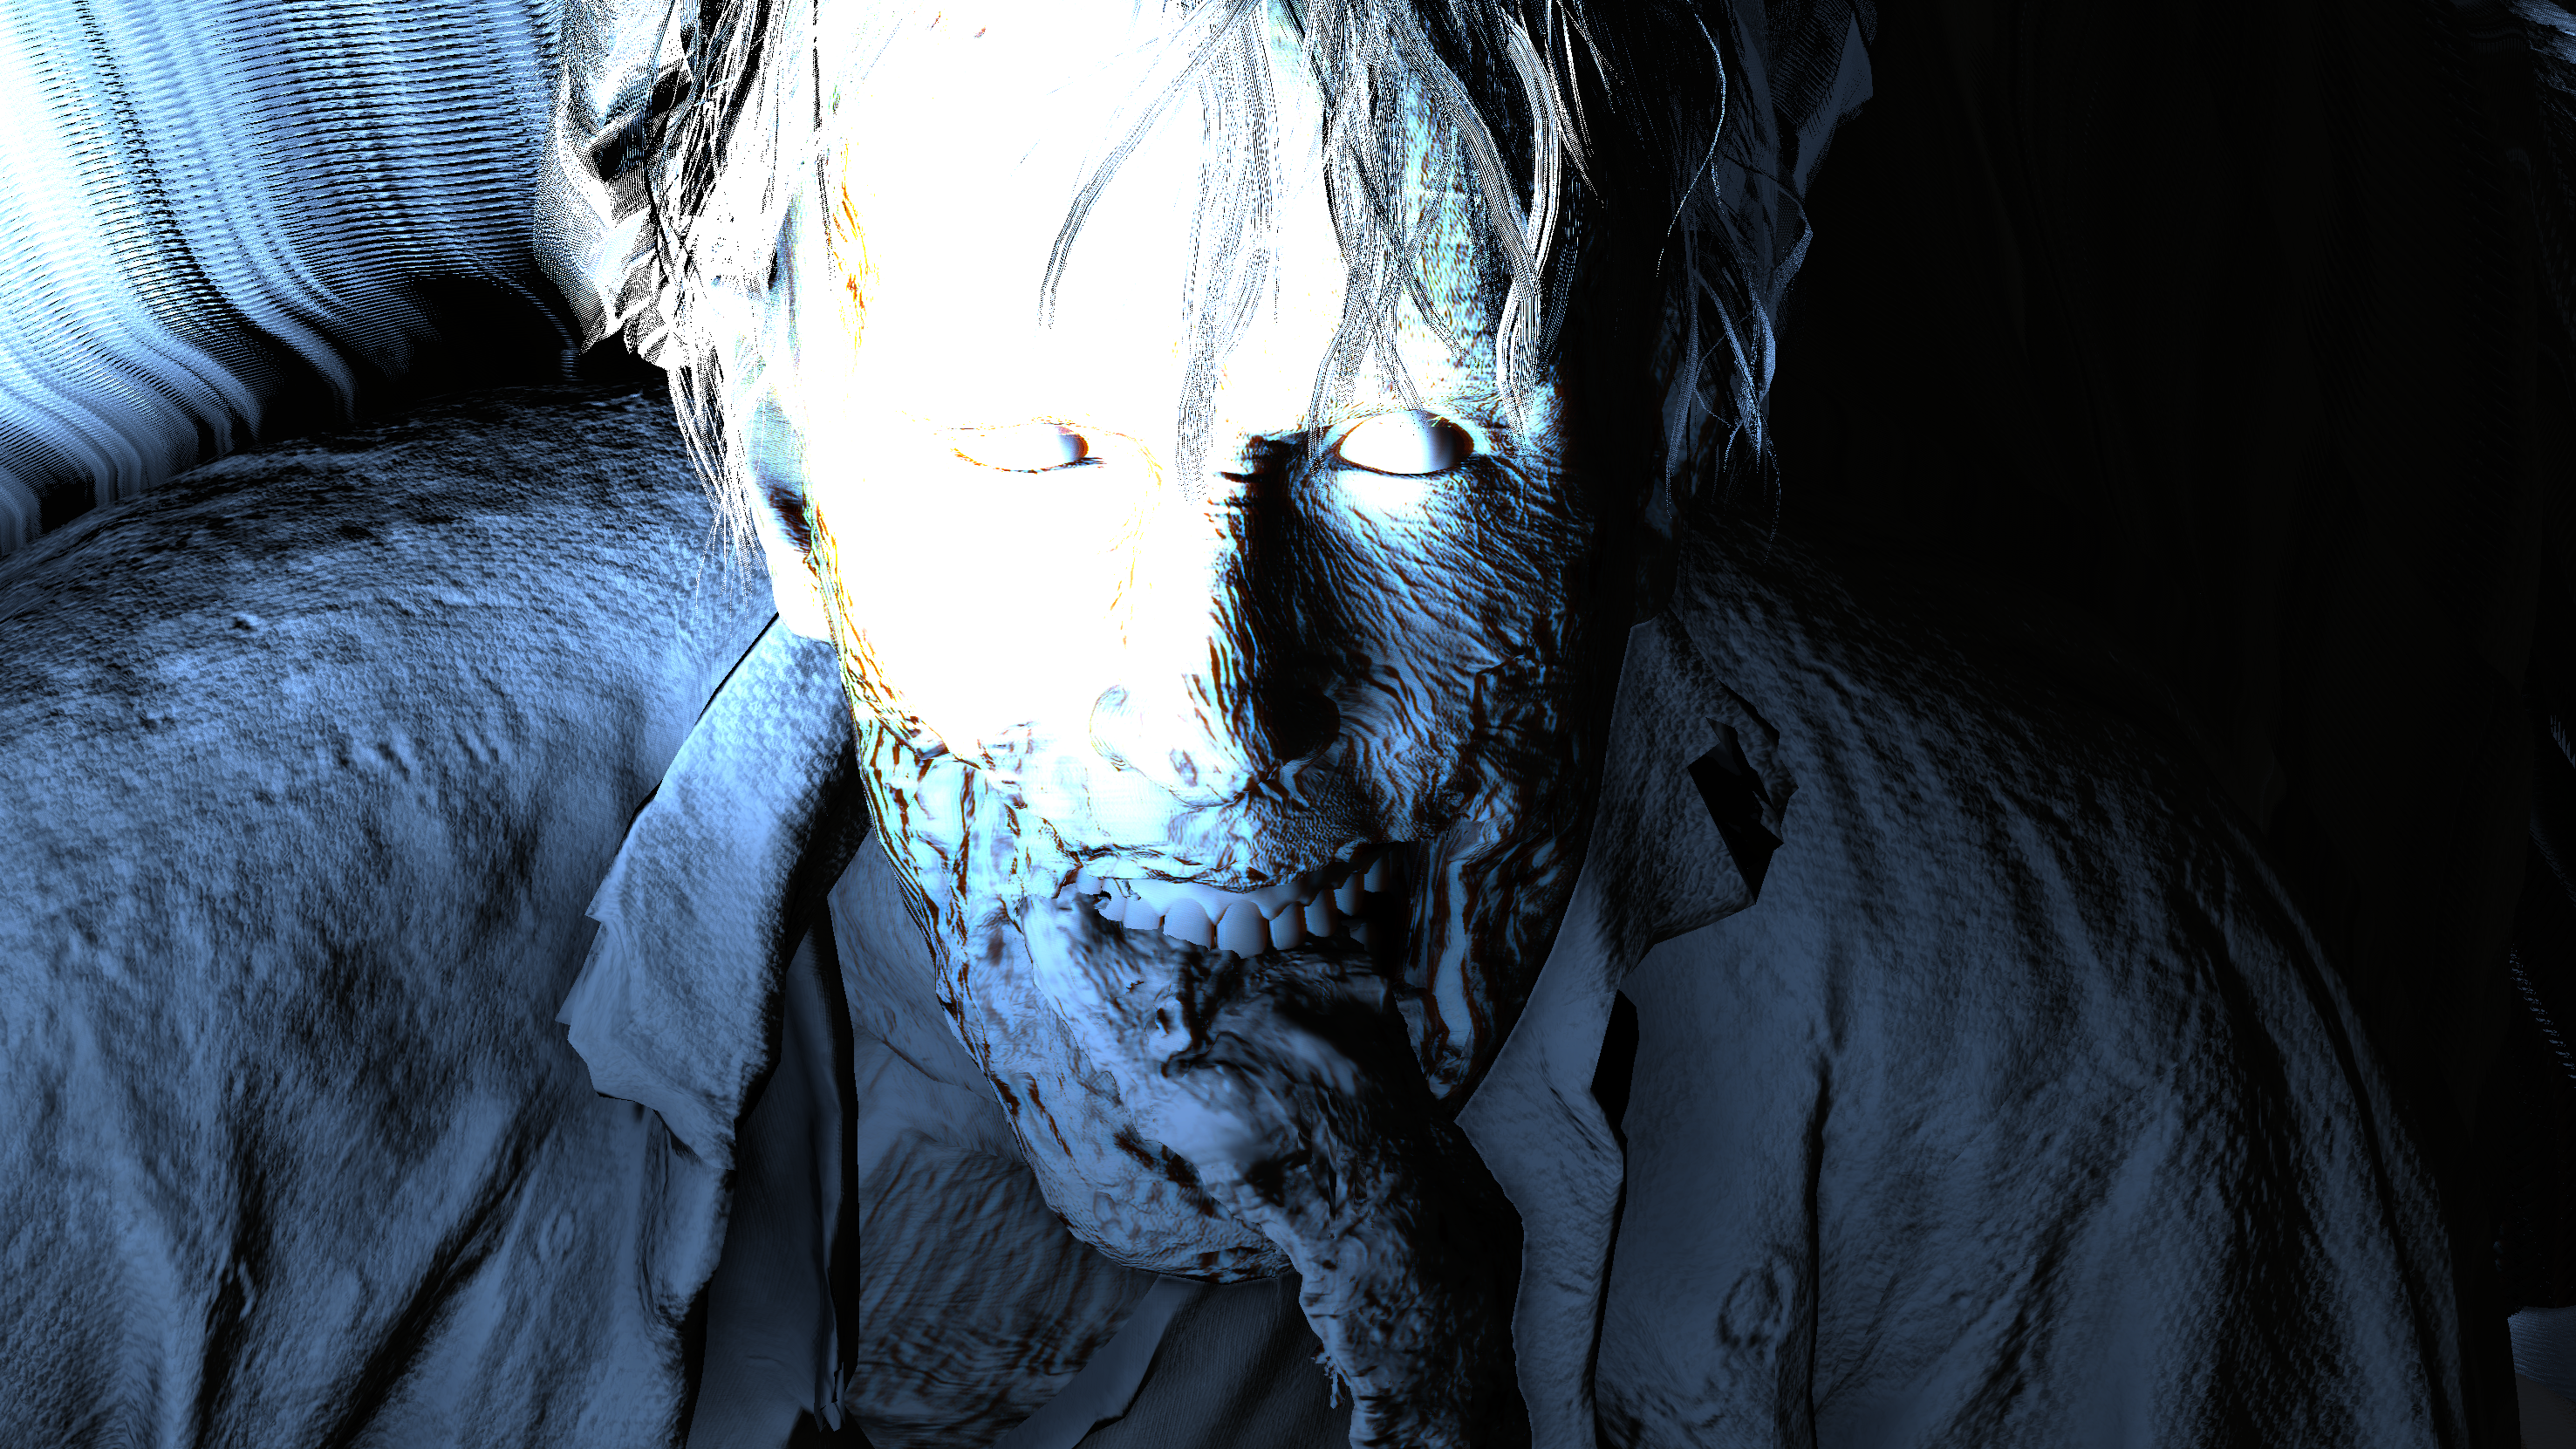
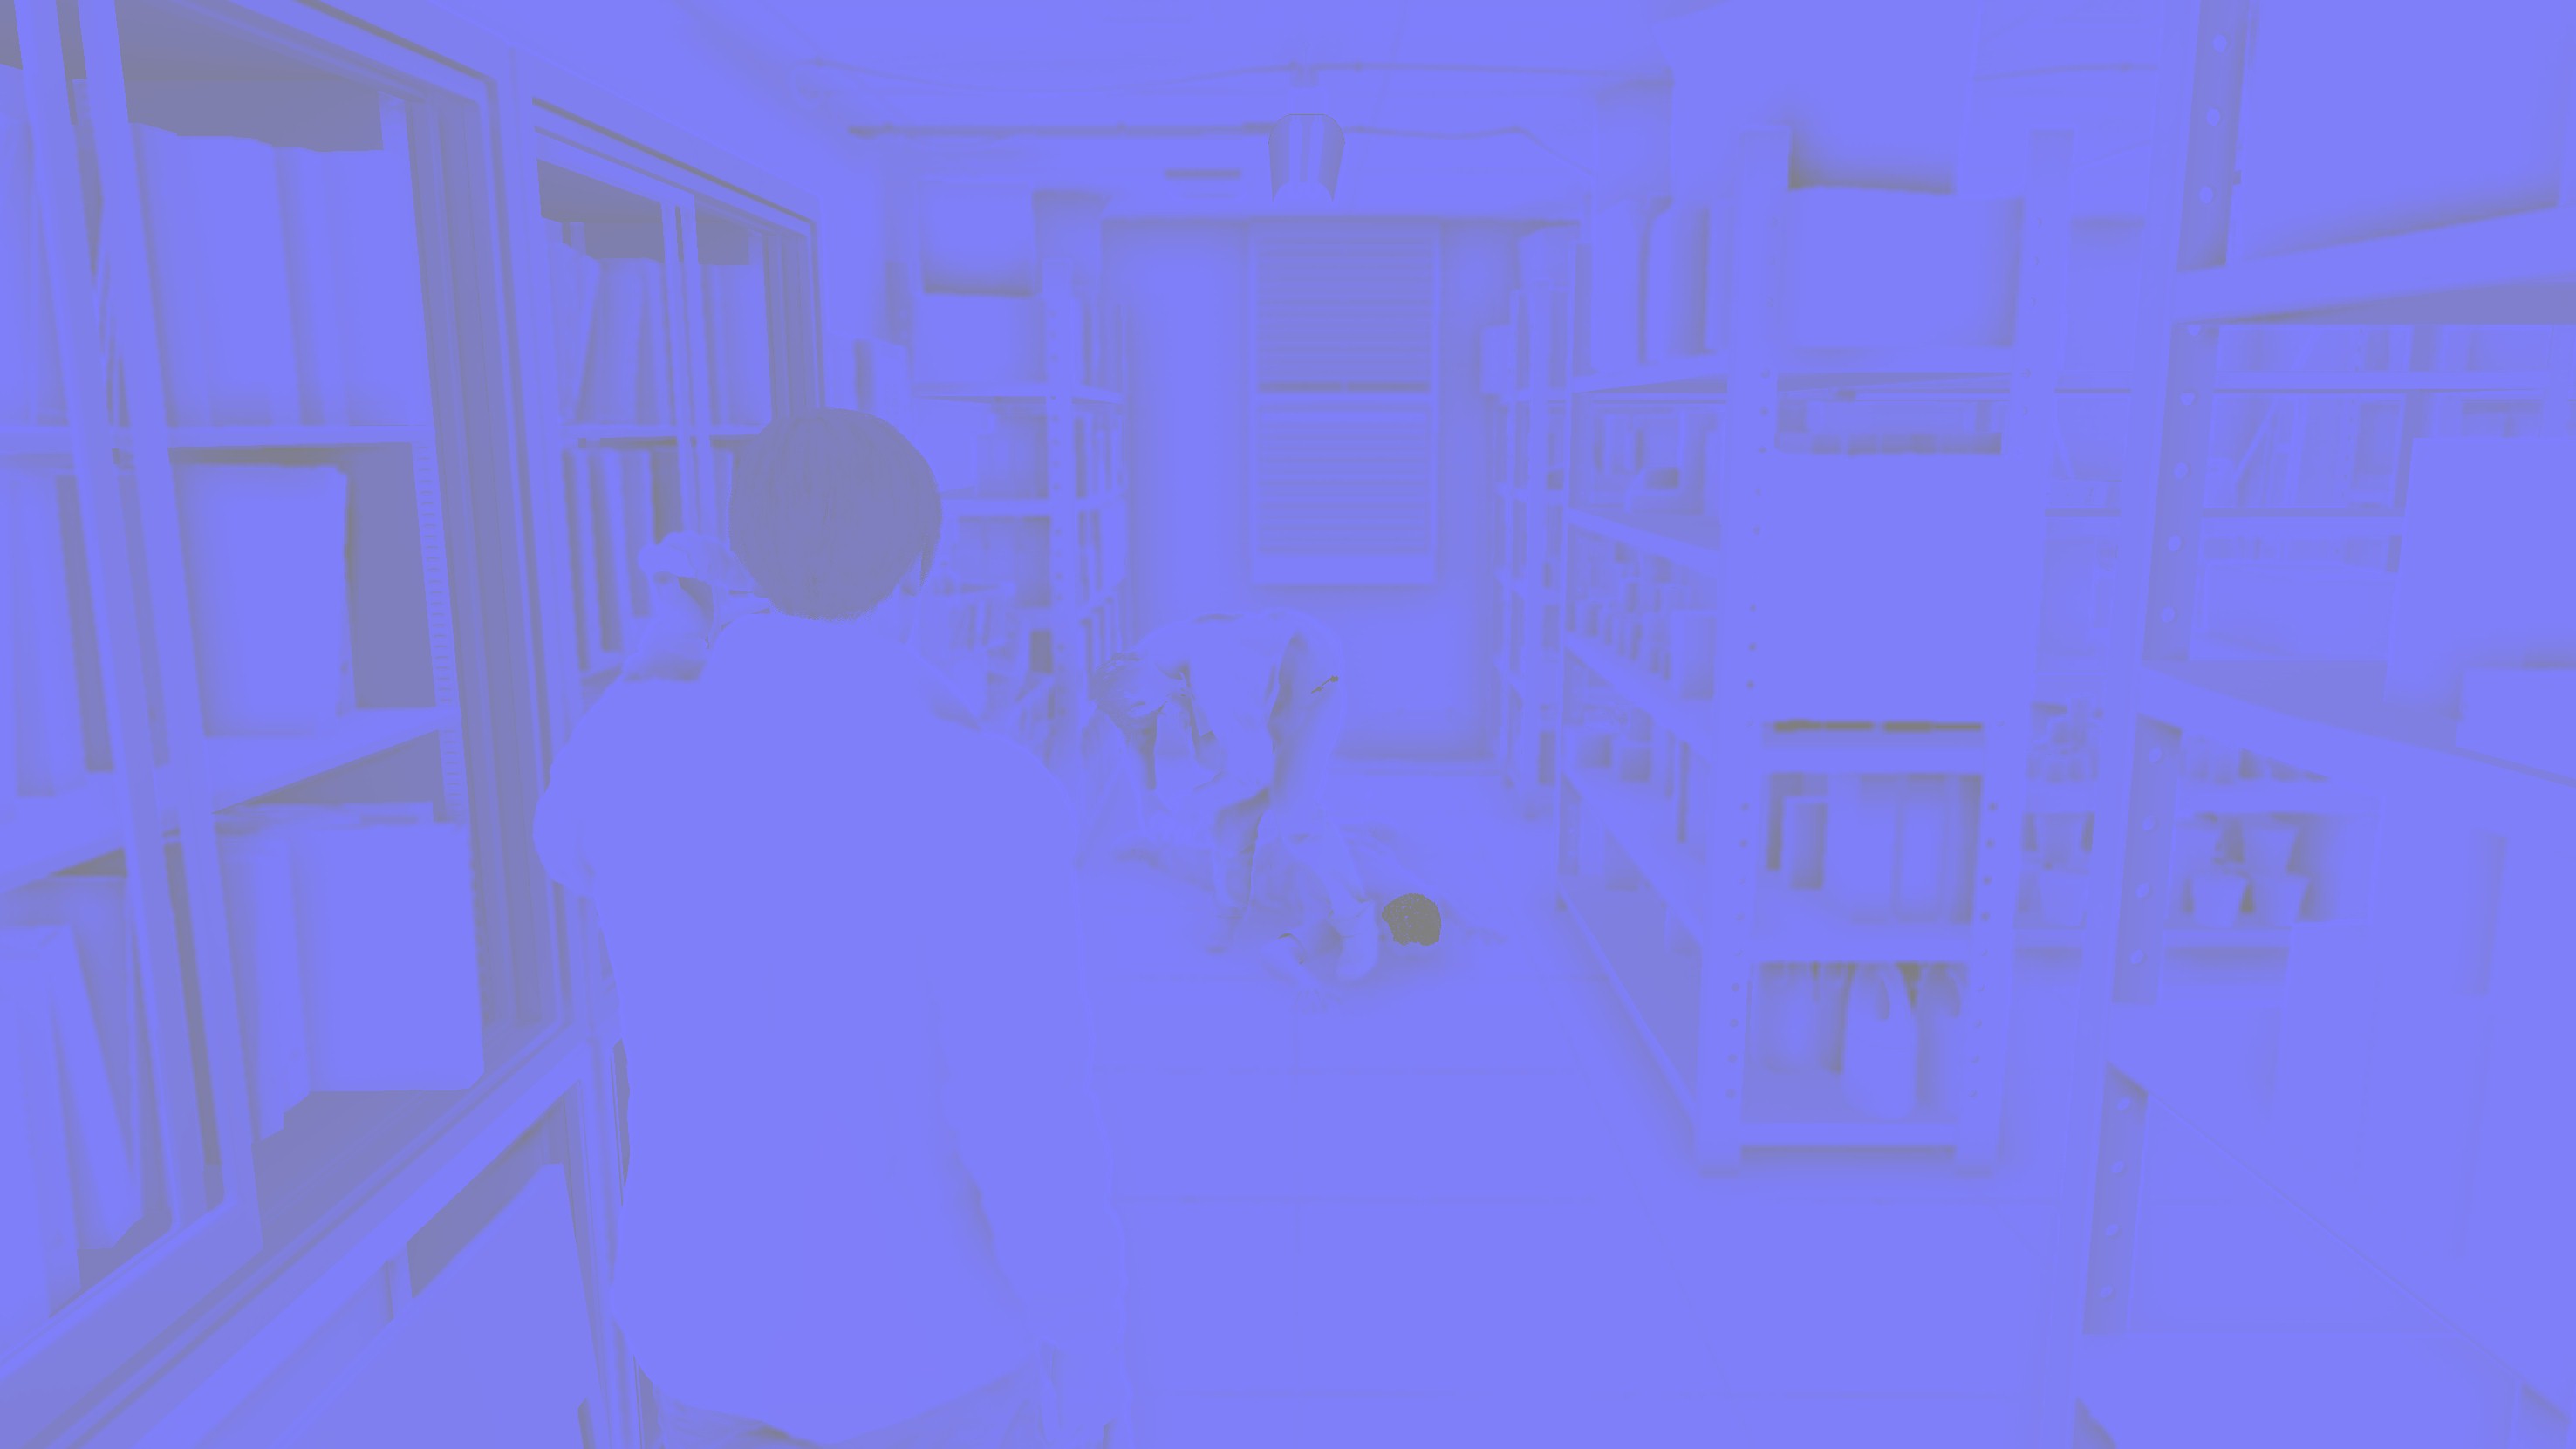
The one output i called VxyAoSss, is basically VelocityXY (R & G channesl) + AO (B channel) + SSS mask (A channel). Because that frame above doesn’t’ have much movement, in fact it have almost none, here is the breakdown of that rendertarget from a more dynamic frame


The Modified GBuffer render target is just brilliant! It tracks between prev & current frame, and possible ignore lighting some pixels..possibly.


The well utilization for rendertargets is not GBuffer only, just keep that note in mind…Pretty much every single and every channel is well occupied! You’ll notice that frequently!
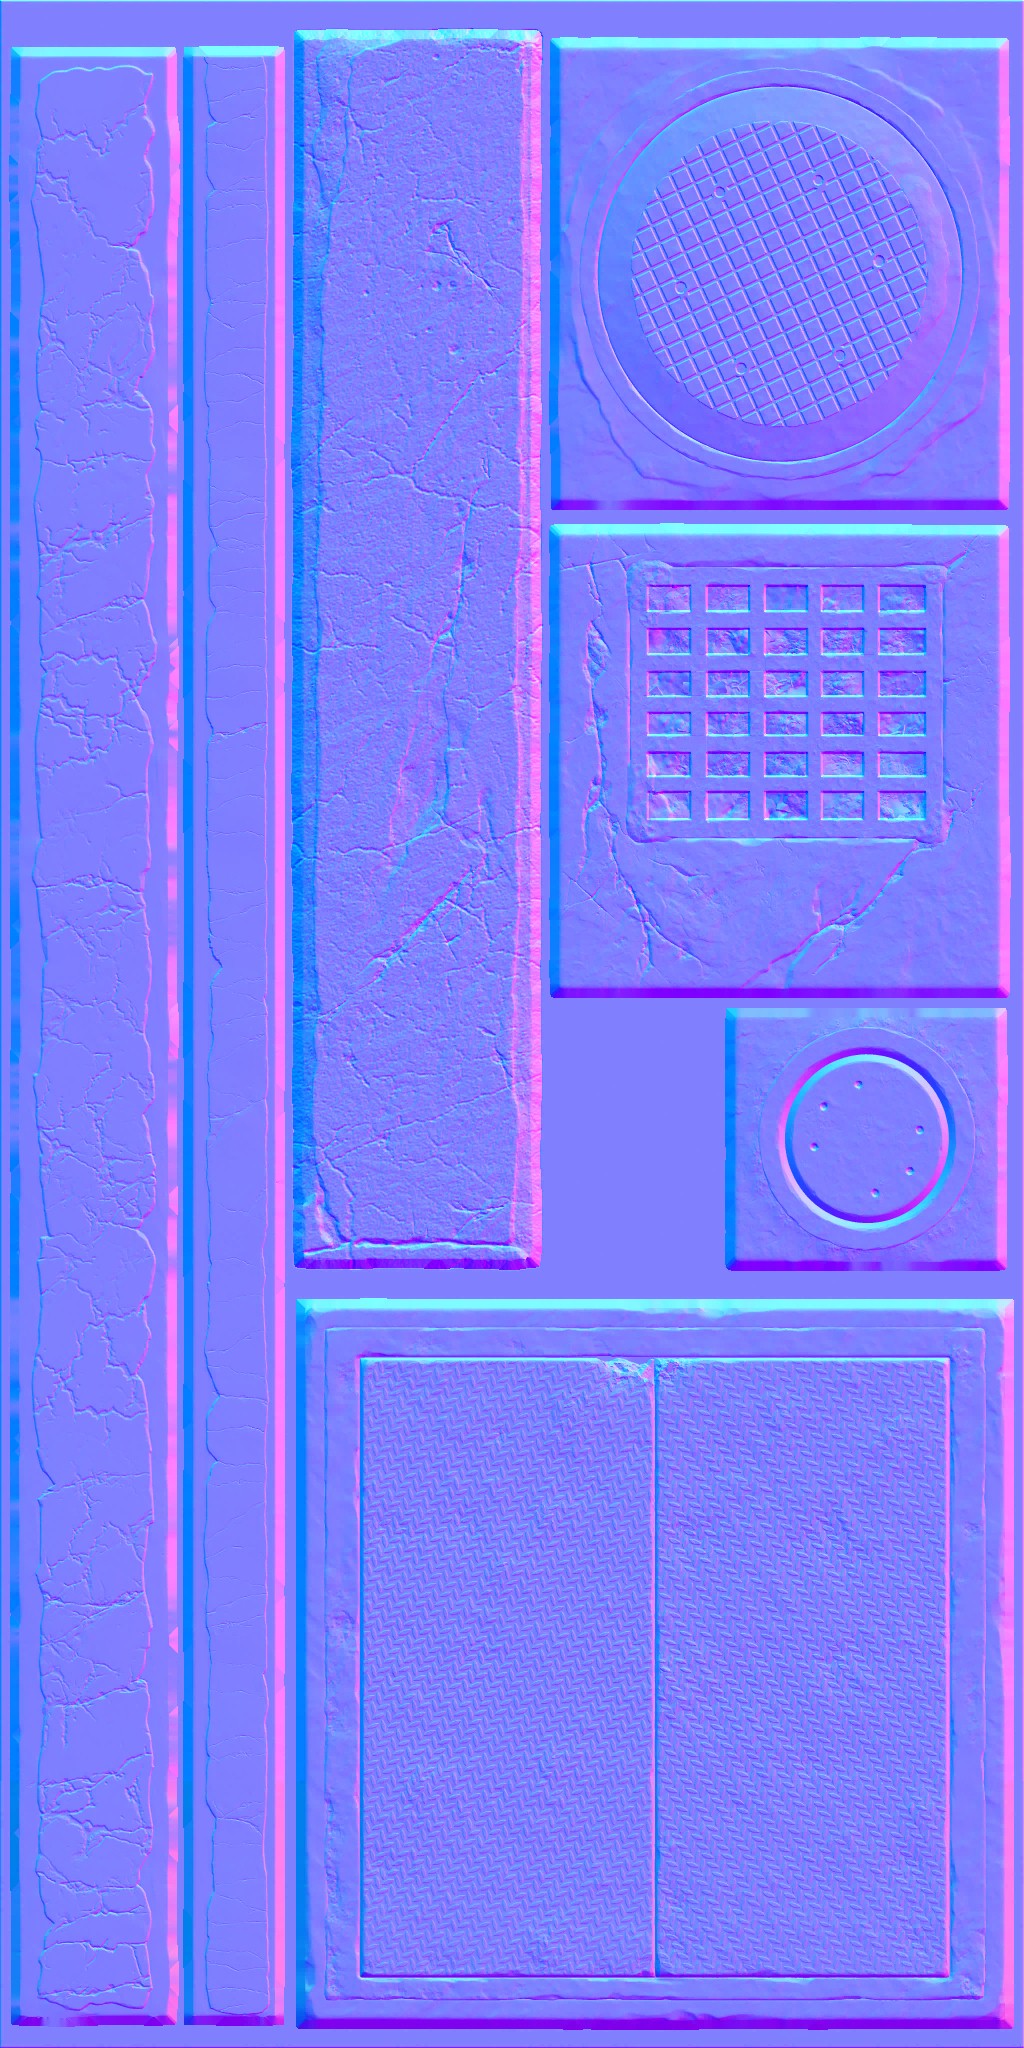
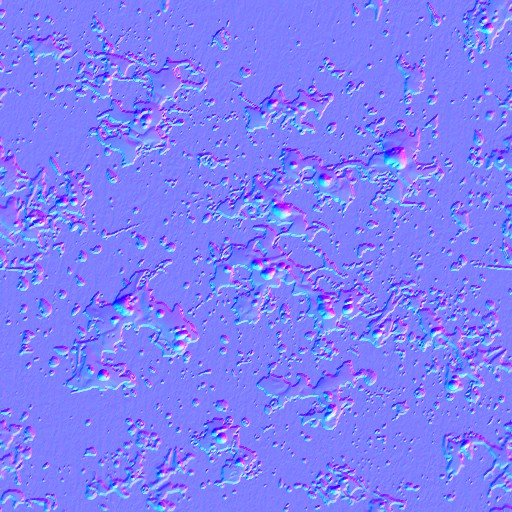
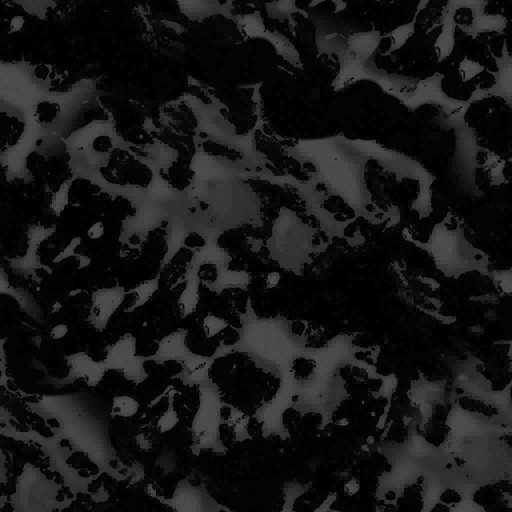
Drawing for the deferred GBuffer taking very few inputs per object, only Color, normal & attributes/properties. In addition to a BlueNoise16 most of the time to be used for dithering when needed.


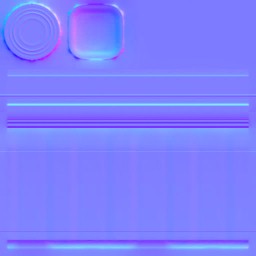


And of course, almost pretty much everything draws into the GBuffer, is drawn with “wetness” in consideration.
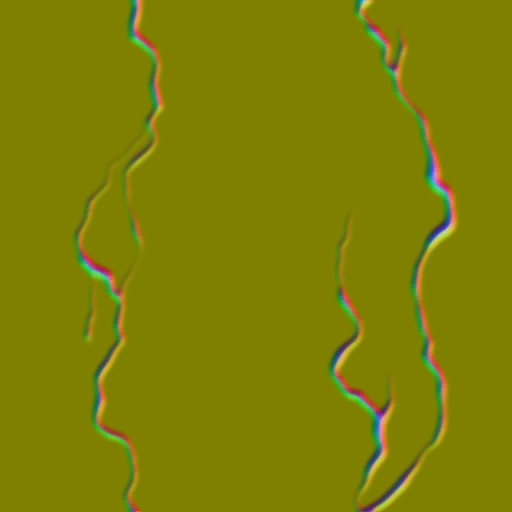

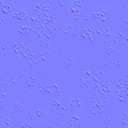
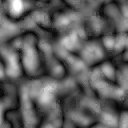
That later normal map (and it ‘s alpha) is animated through texture slices, so 32 slices makes 32 frames of animation, so wetness can be dynamic when needed.

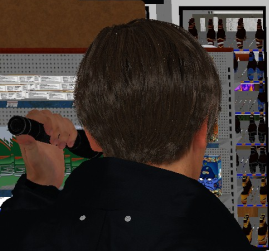
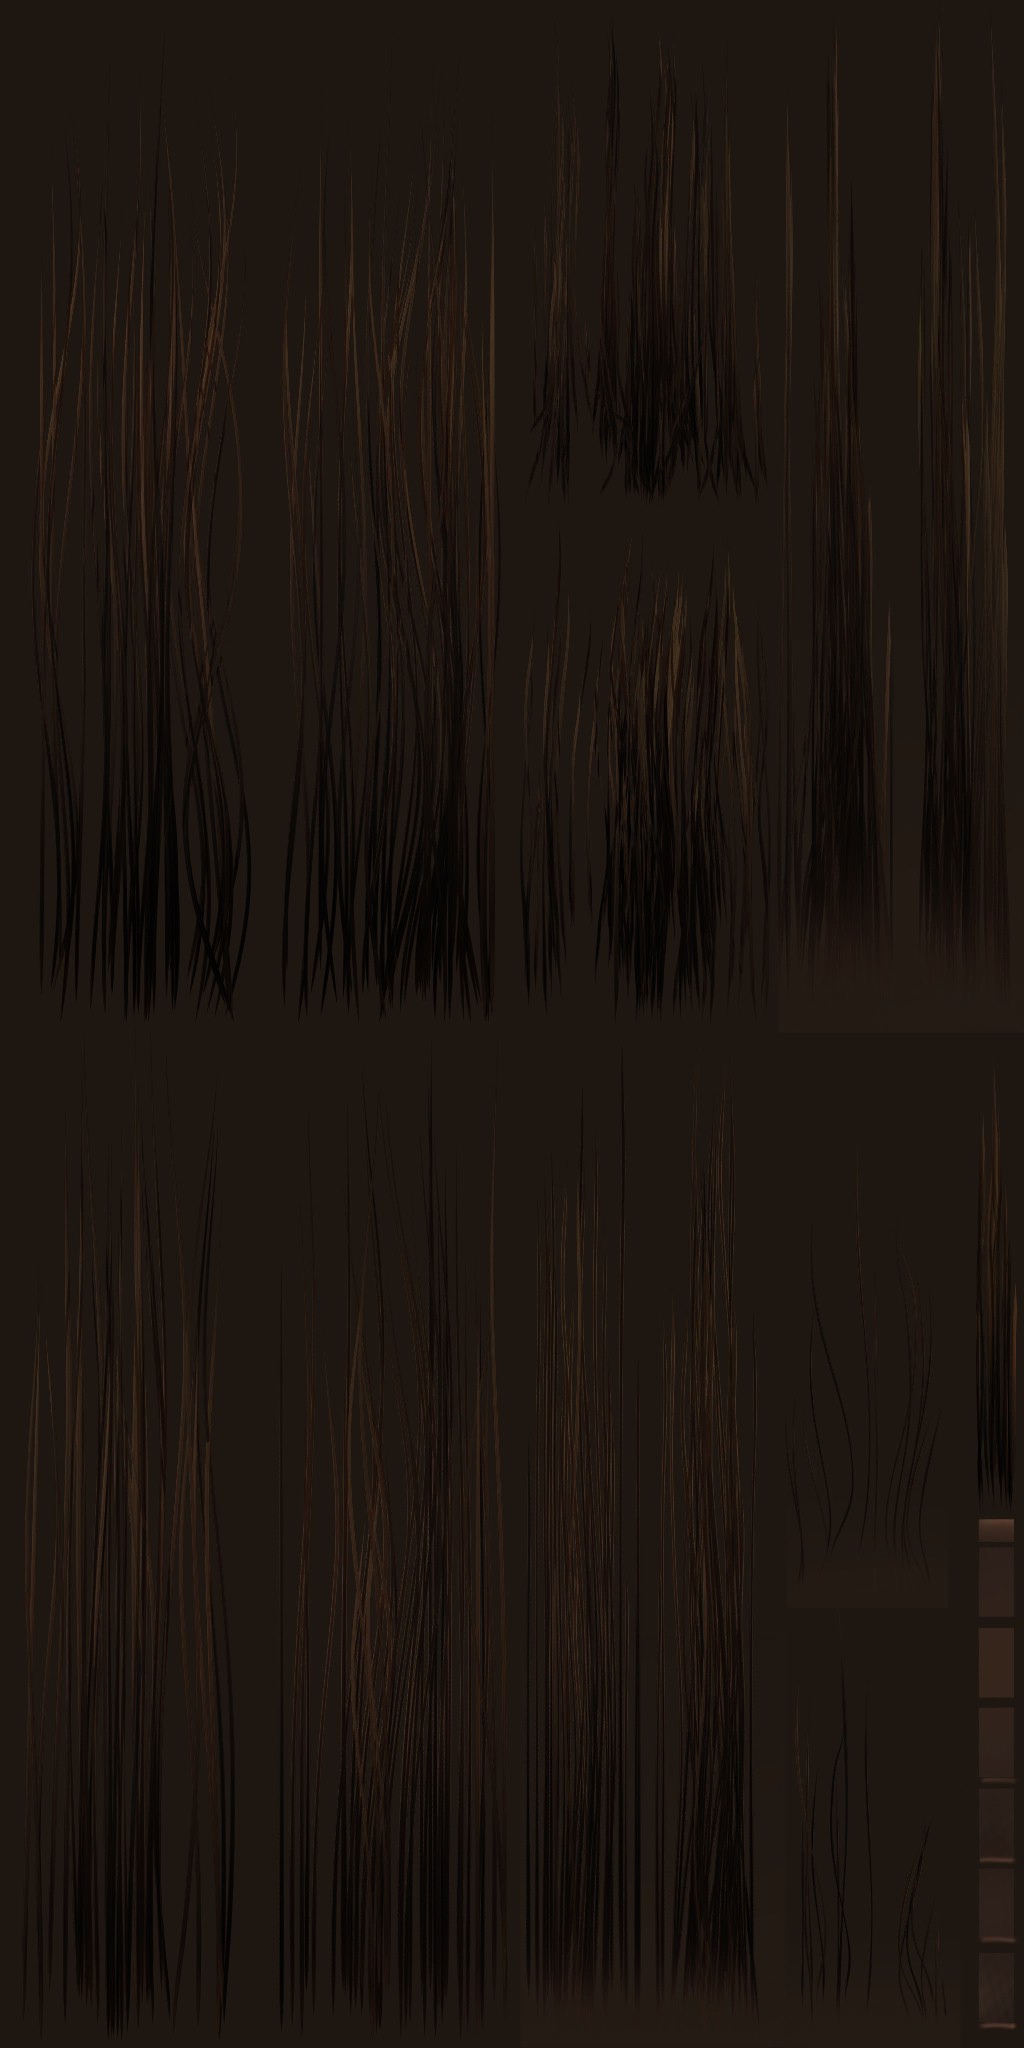
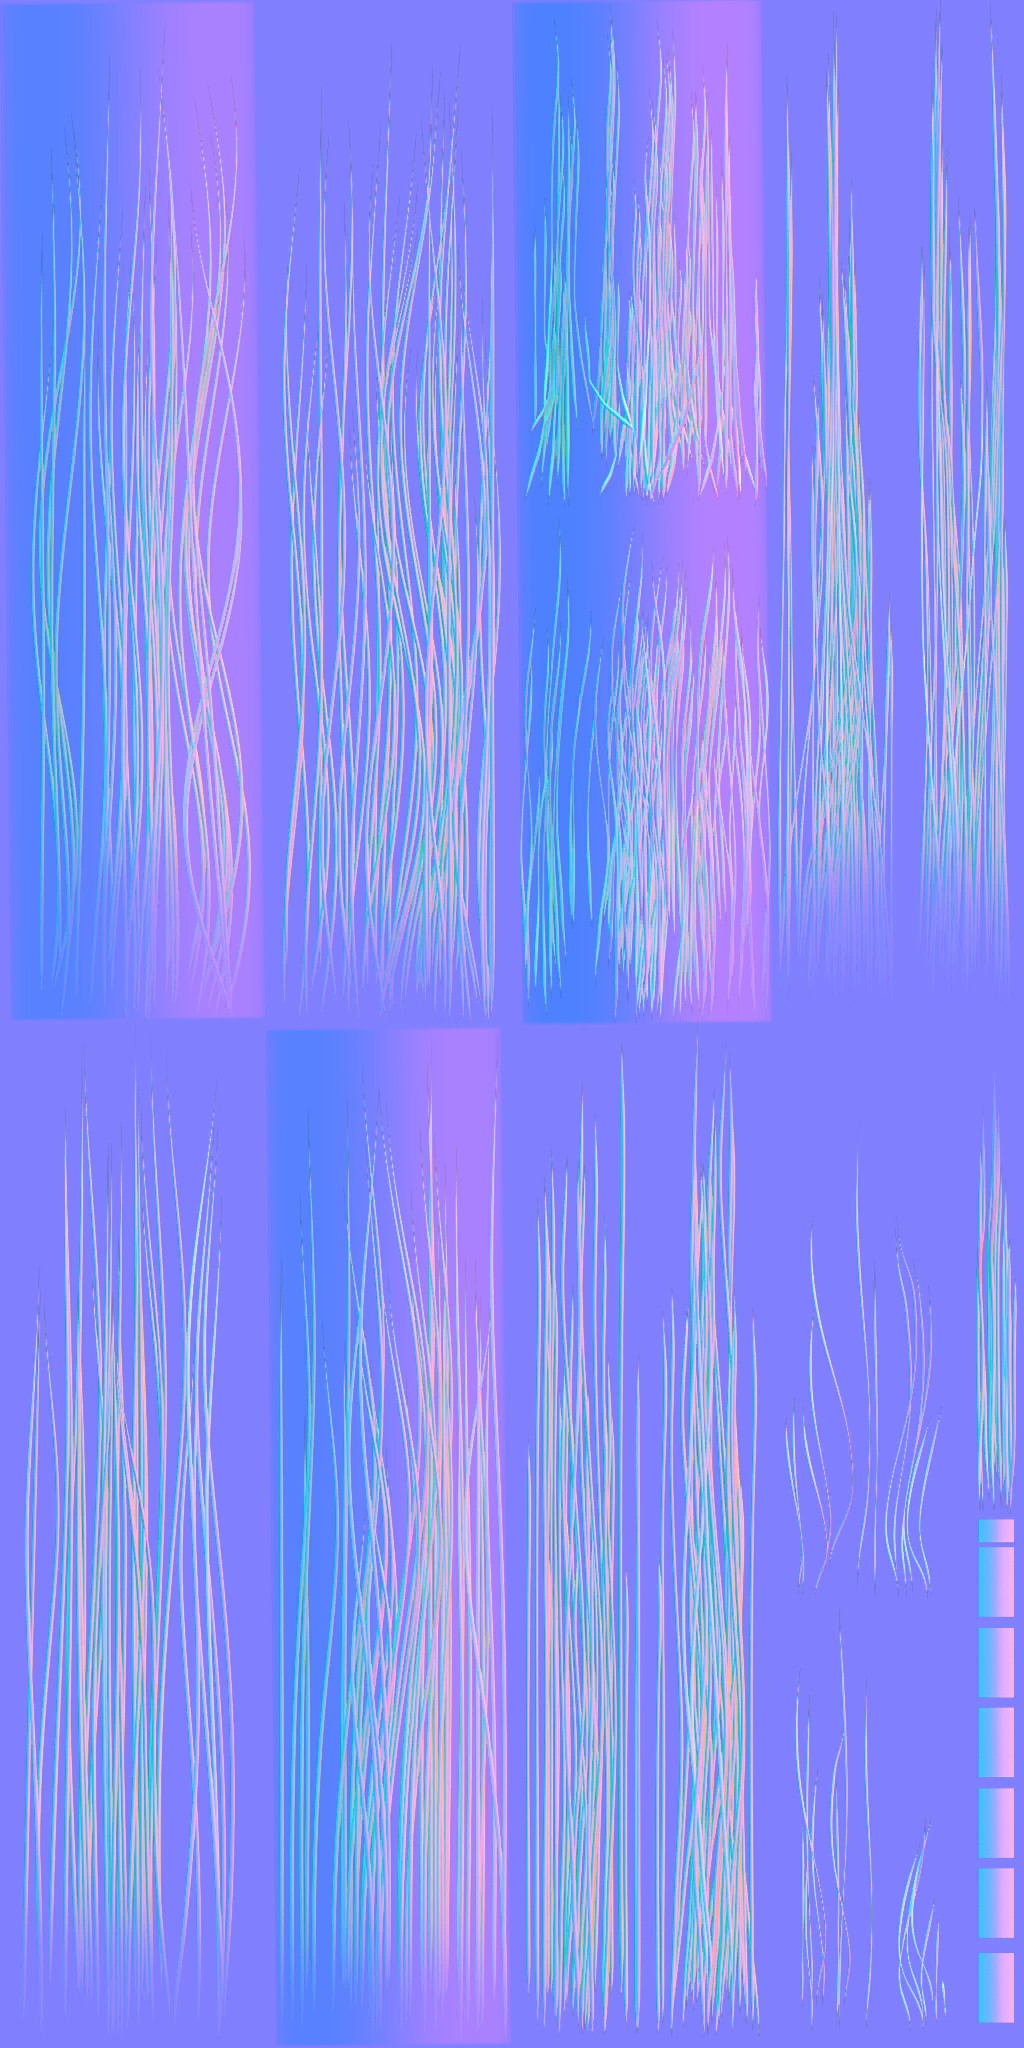
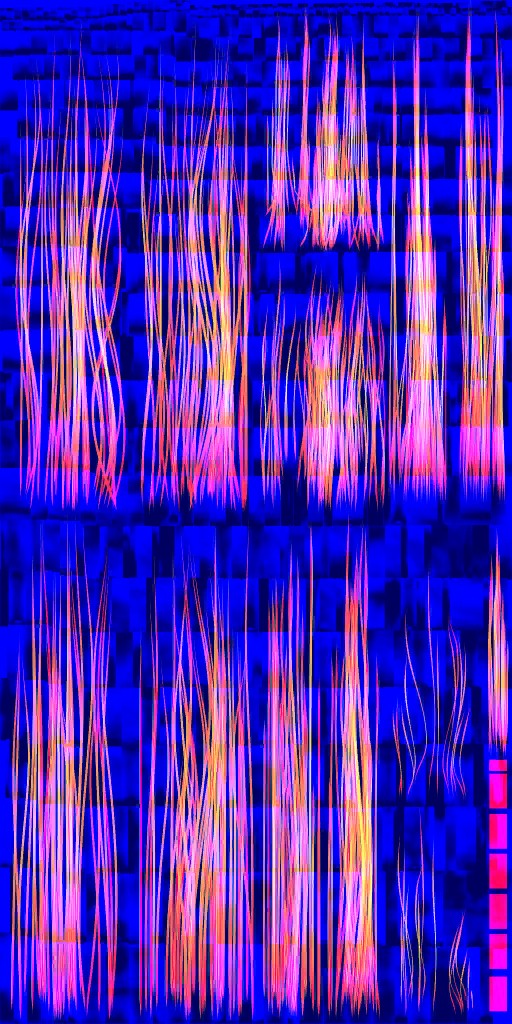
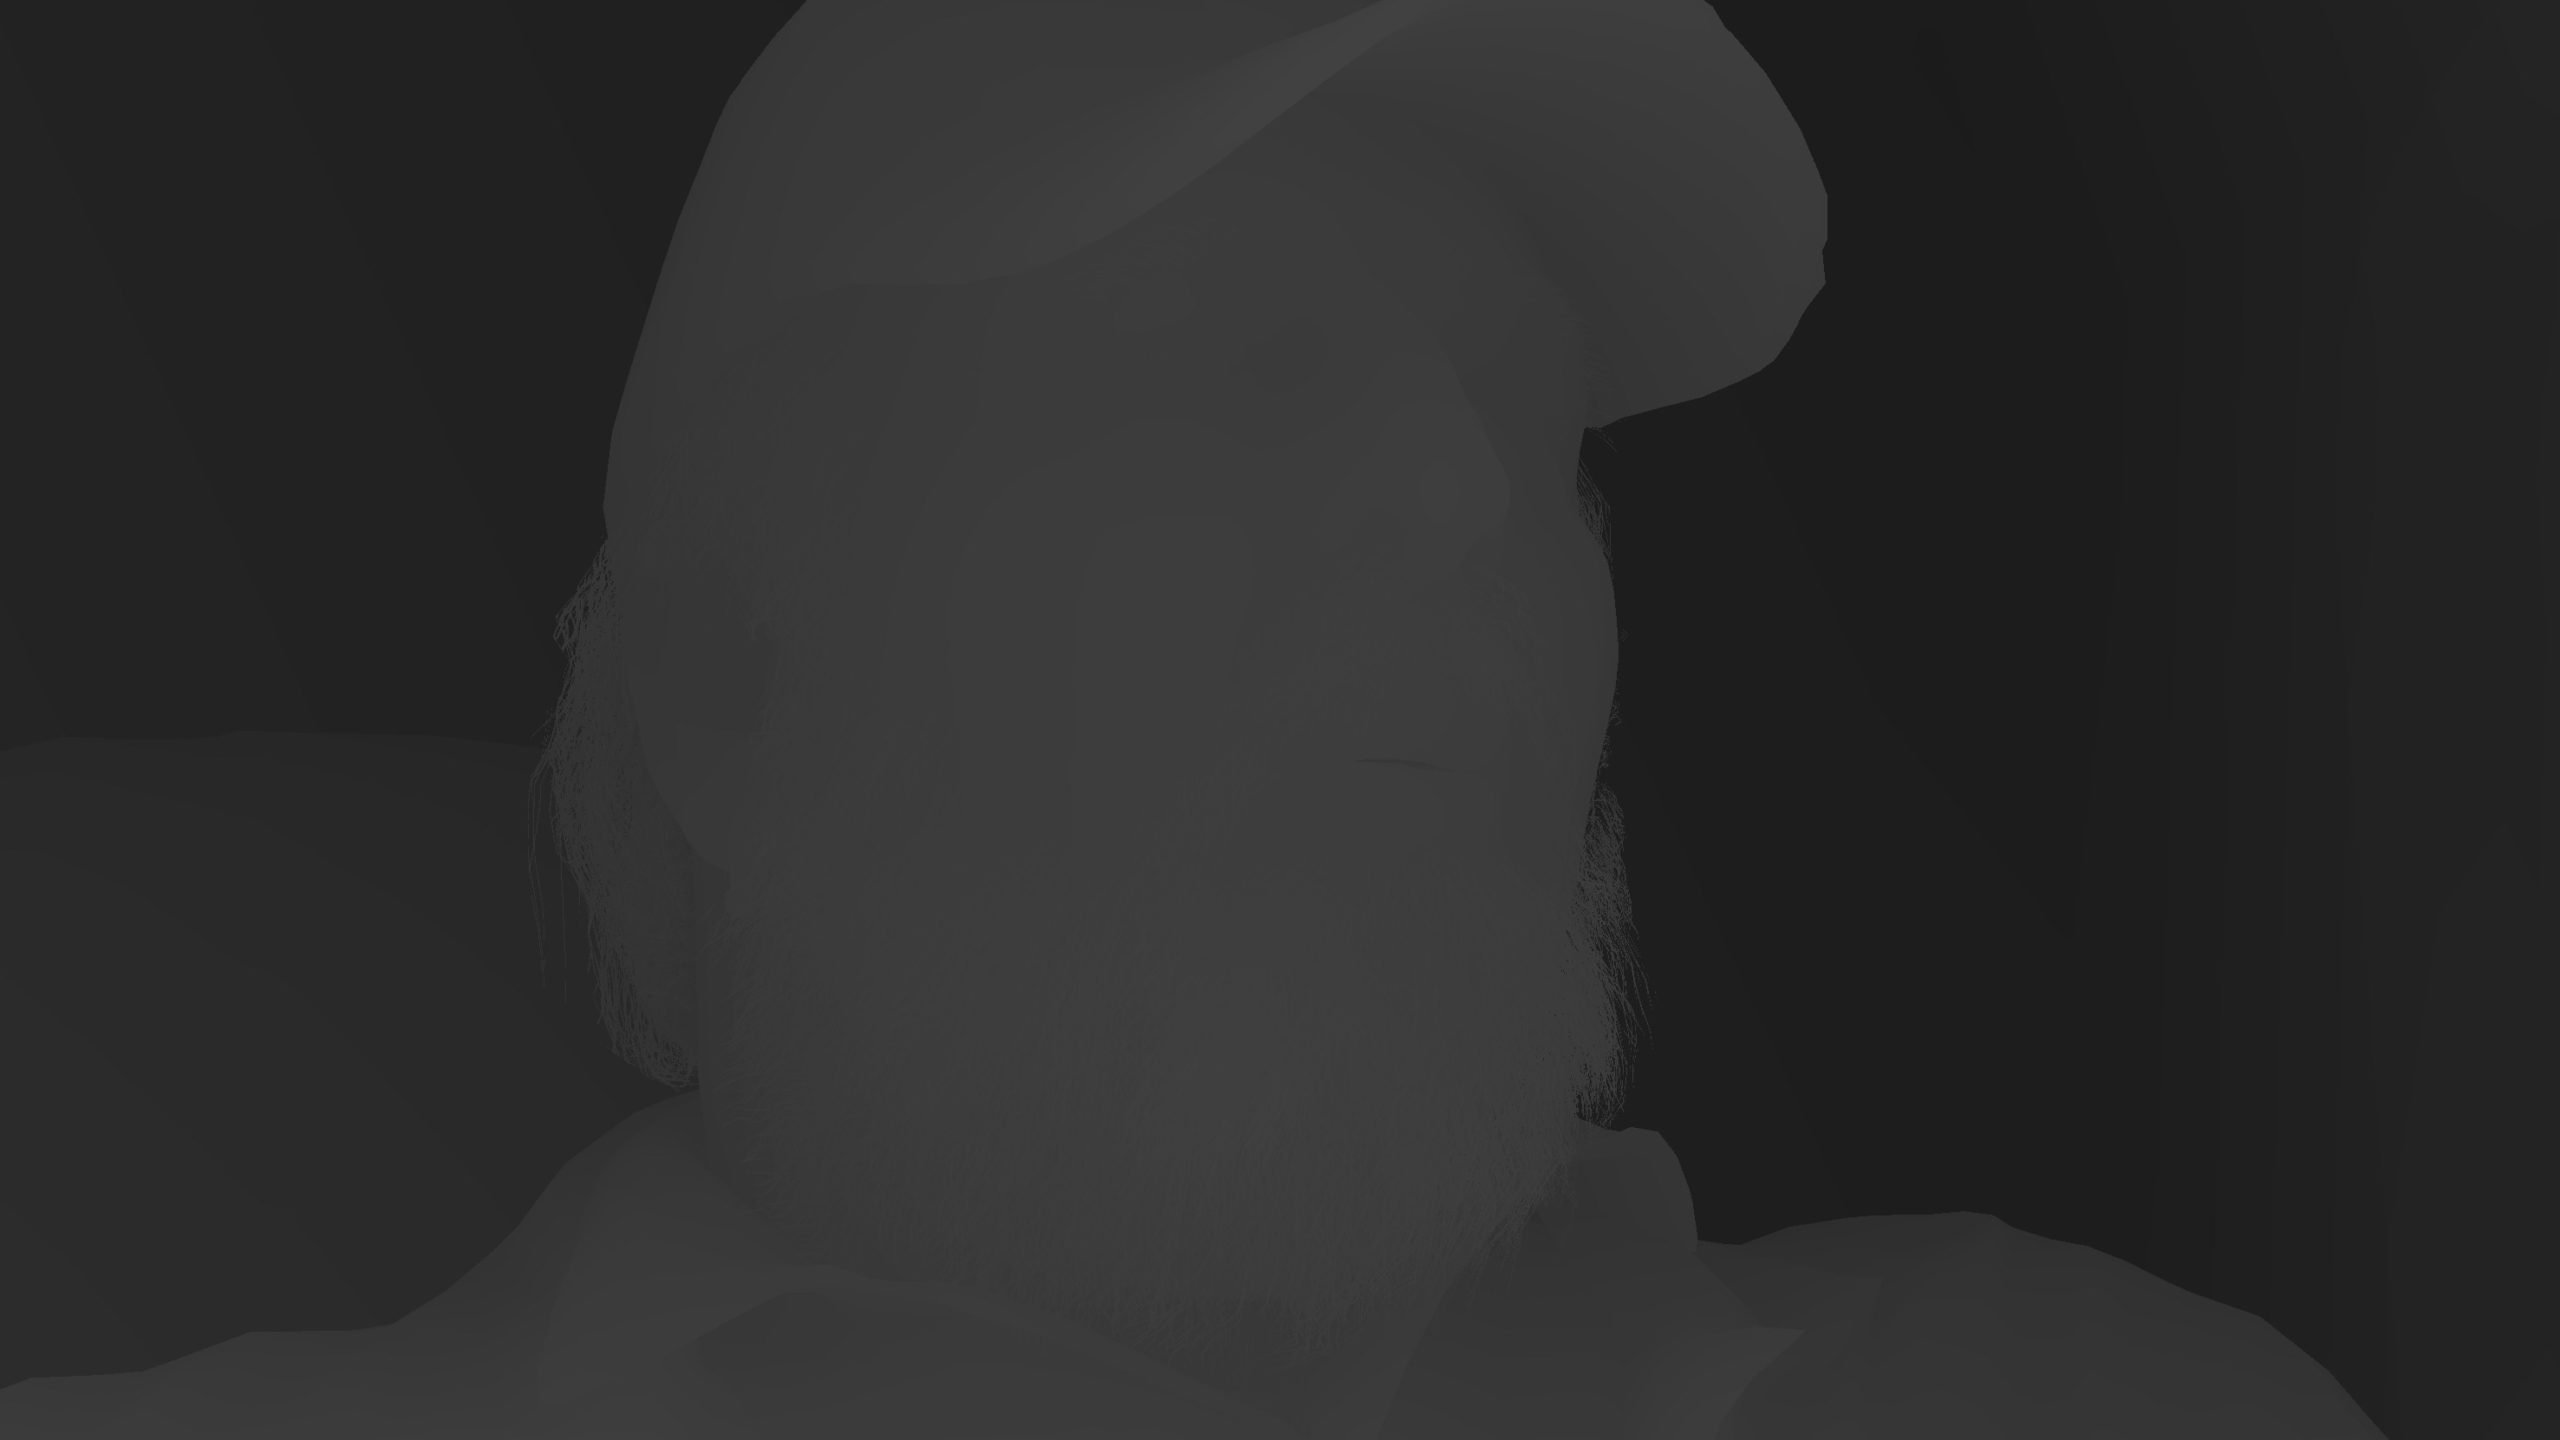
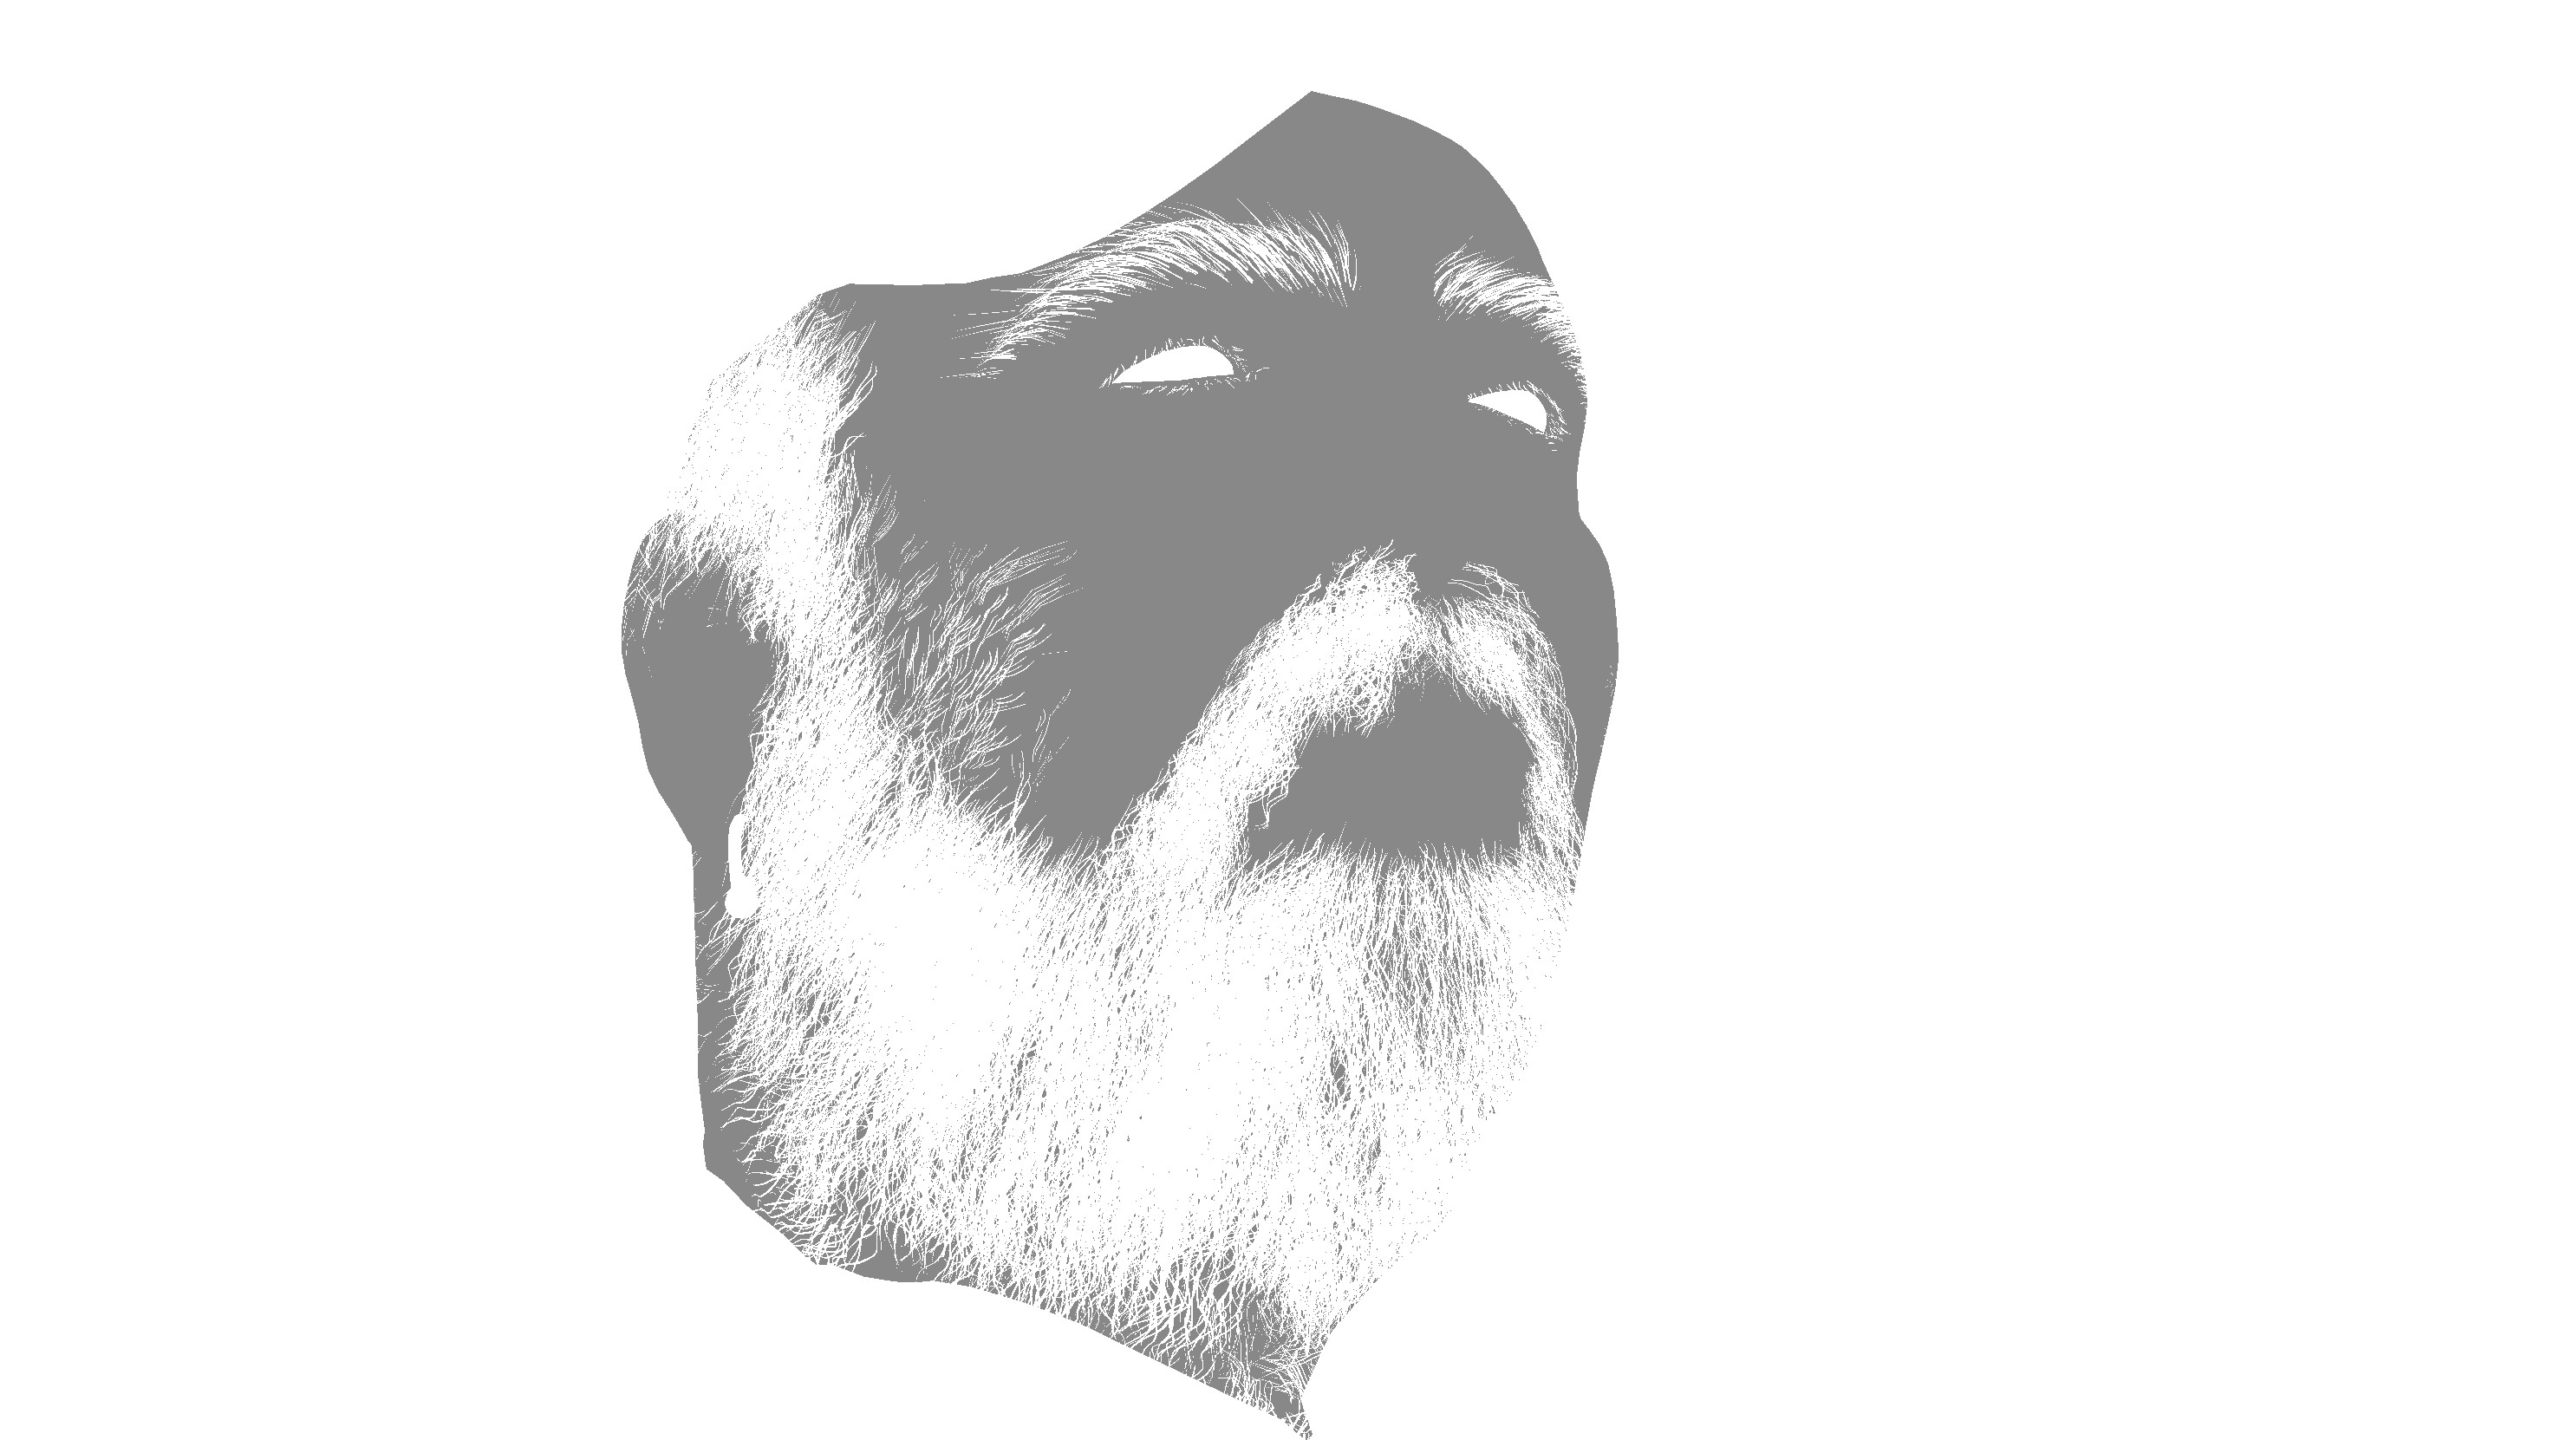
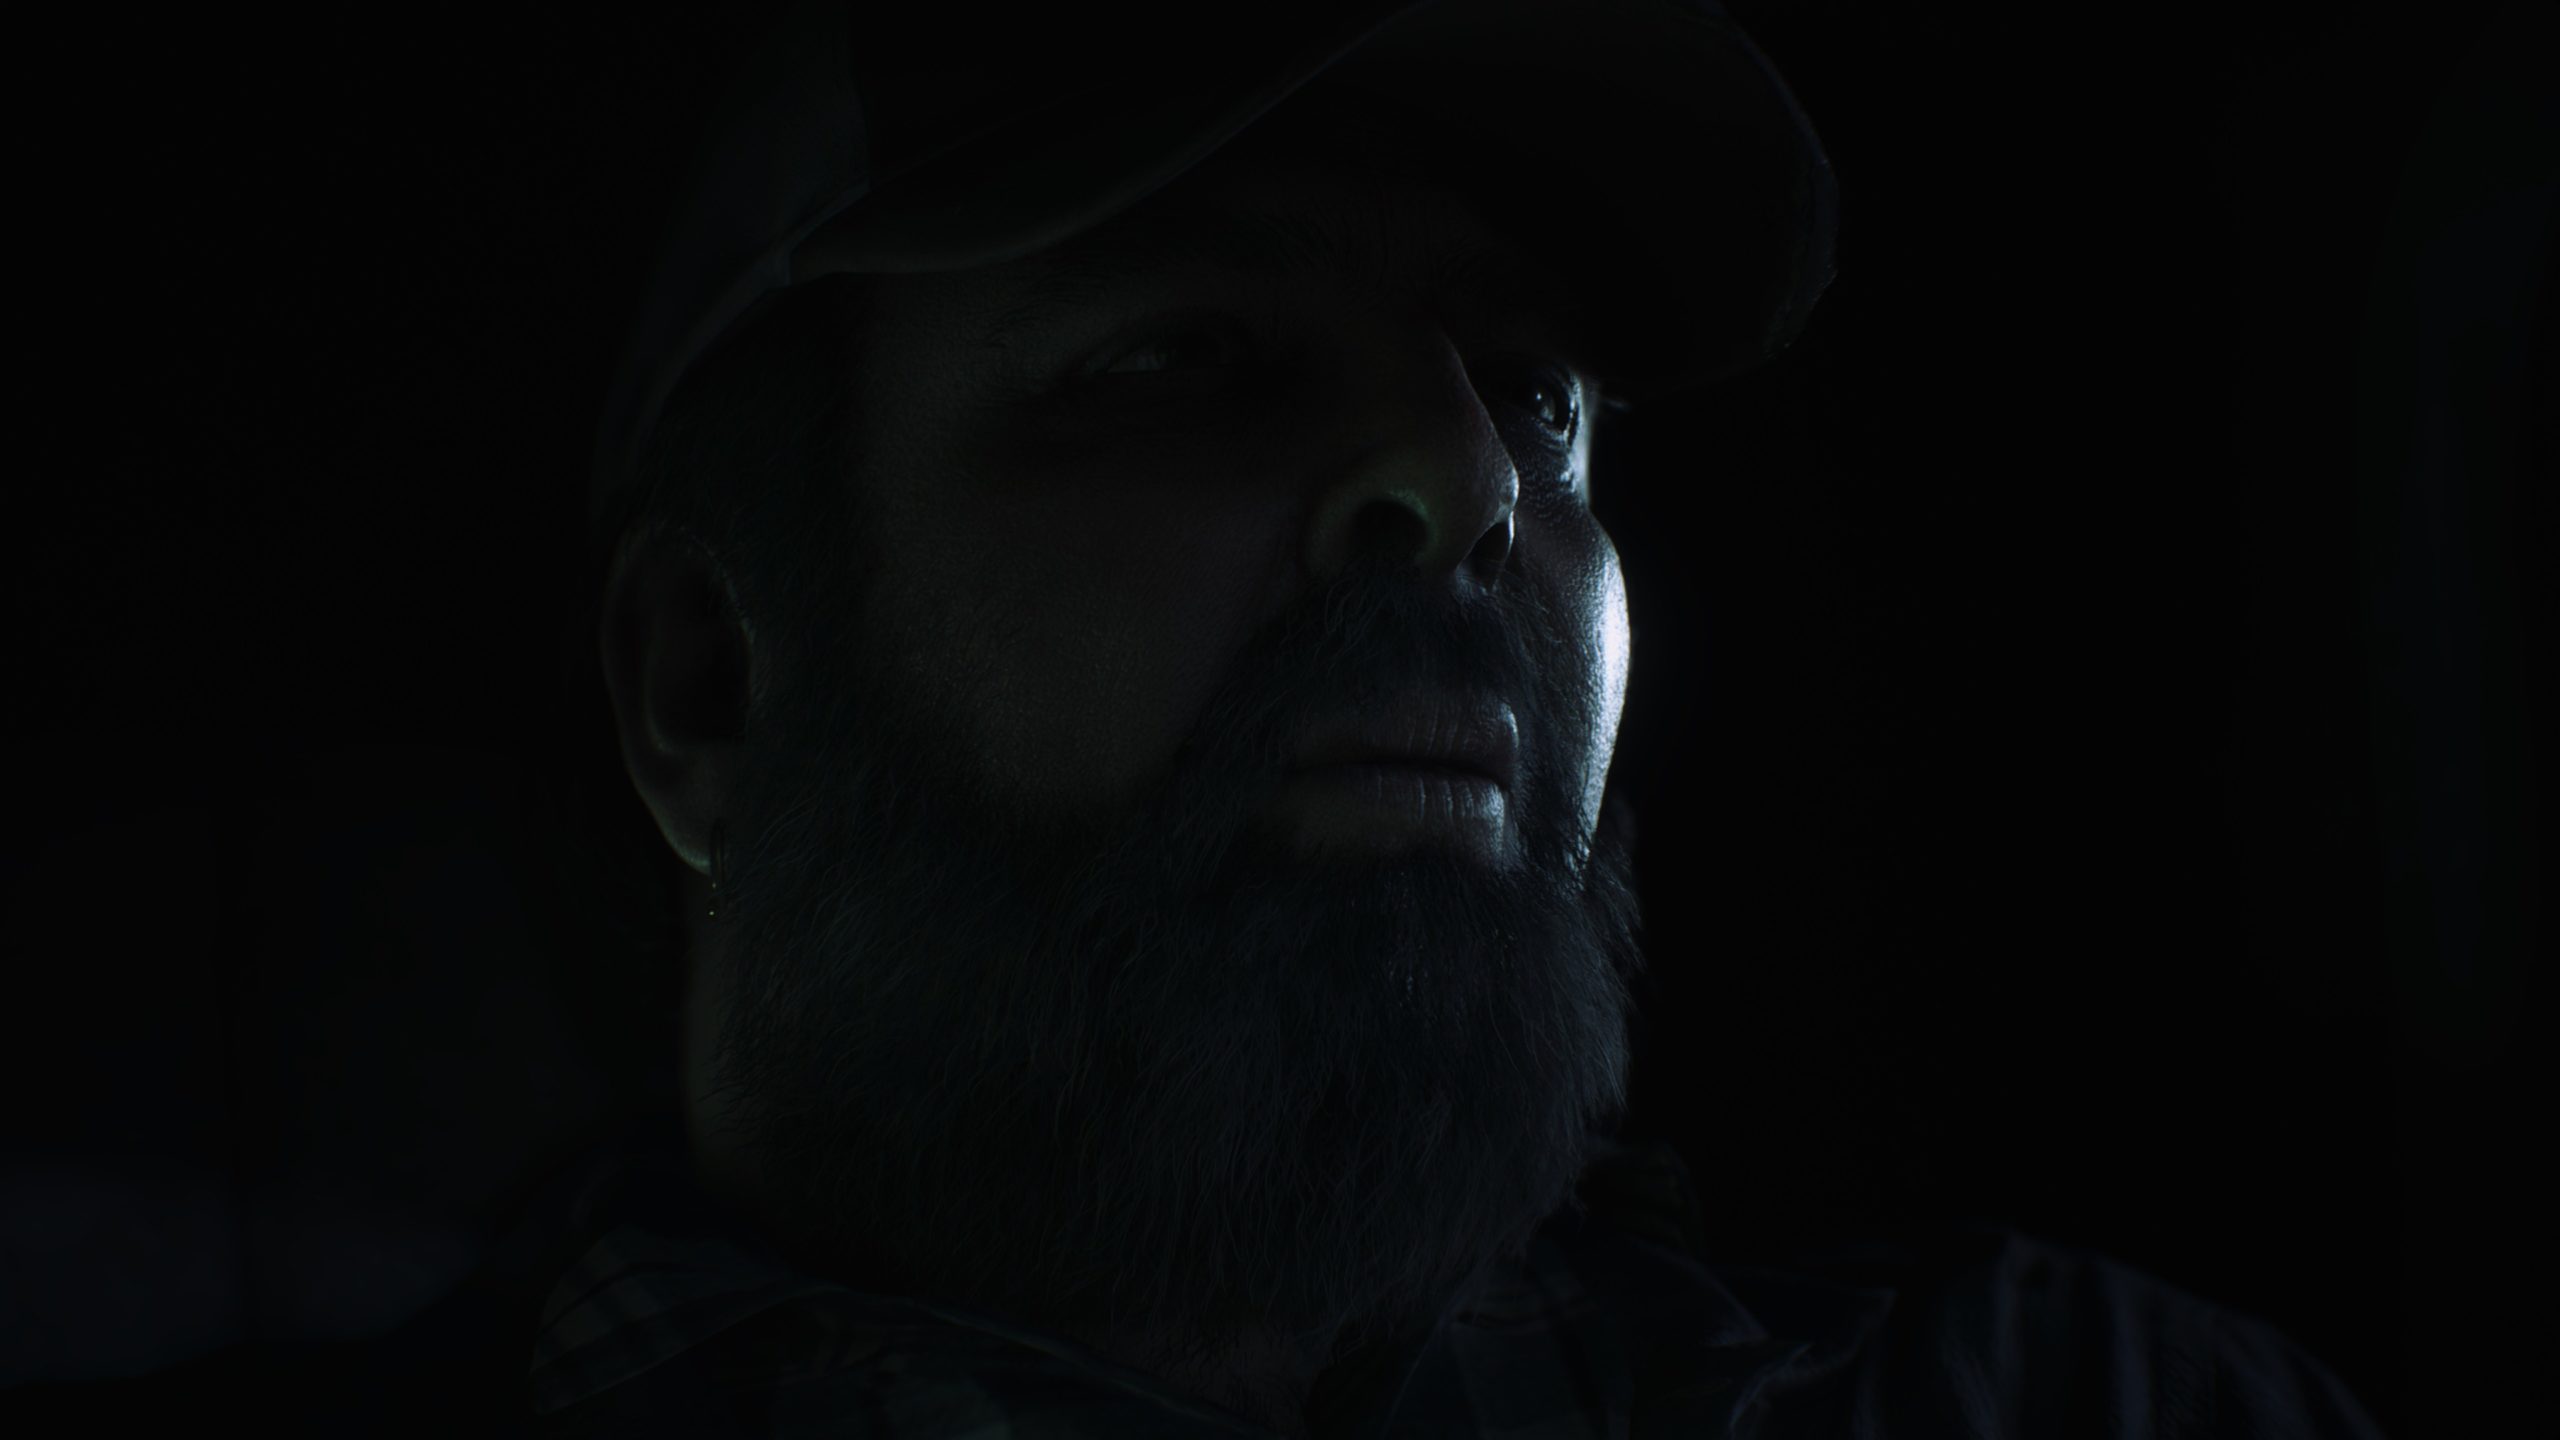
Hair
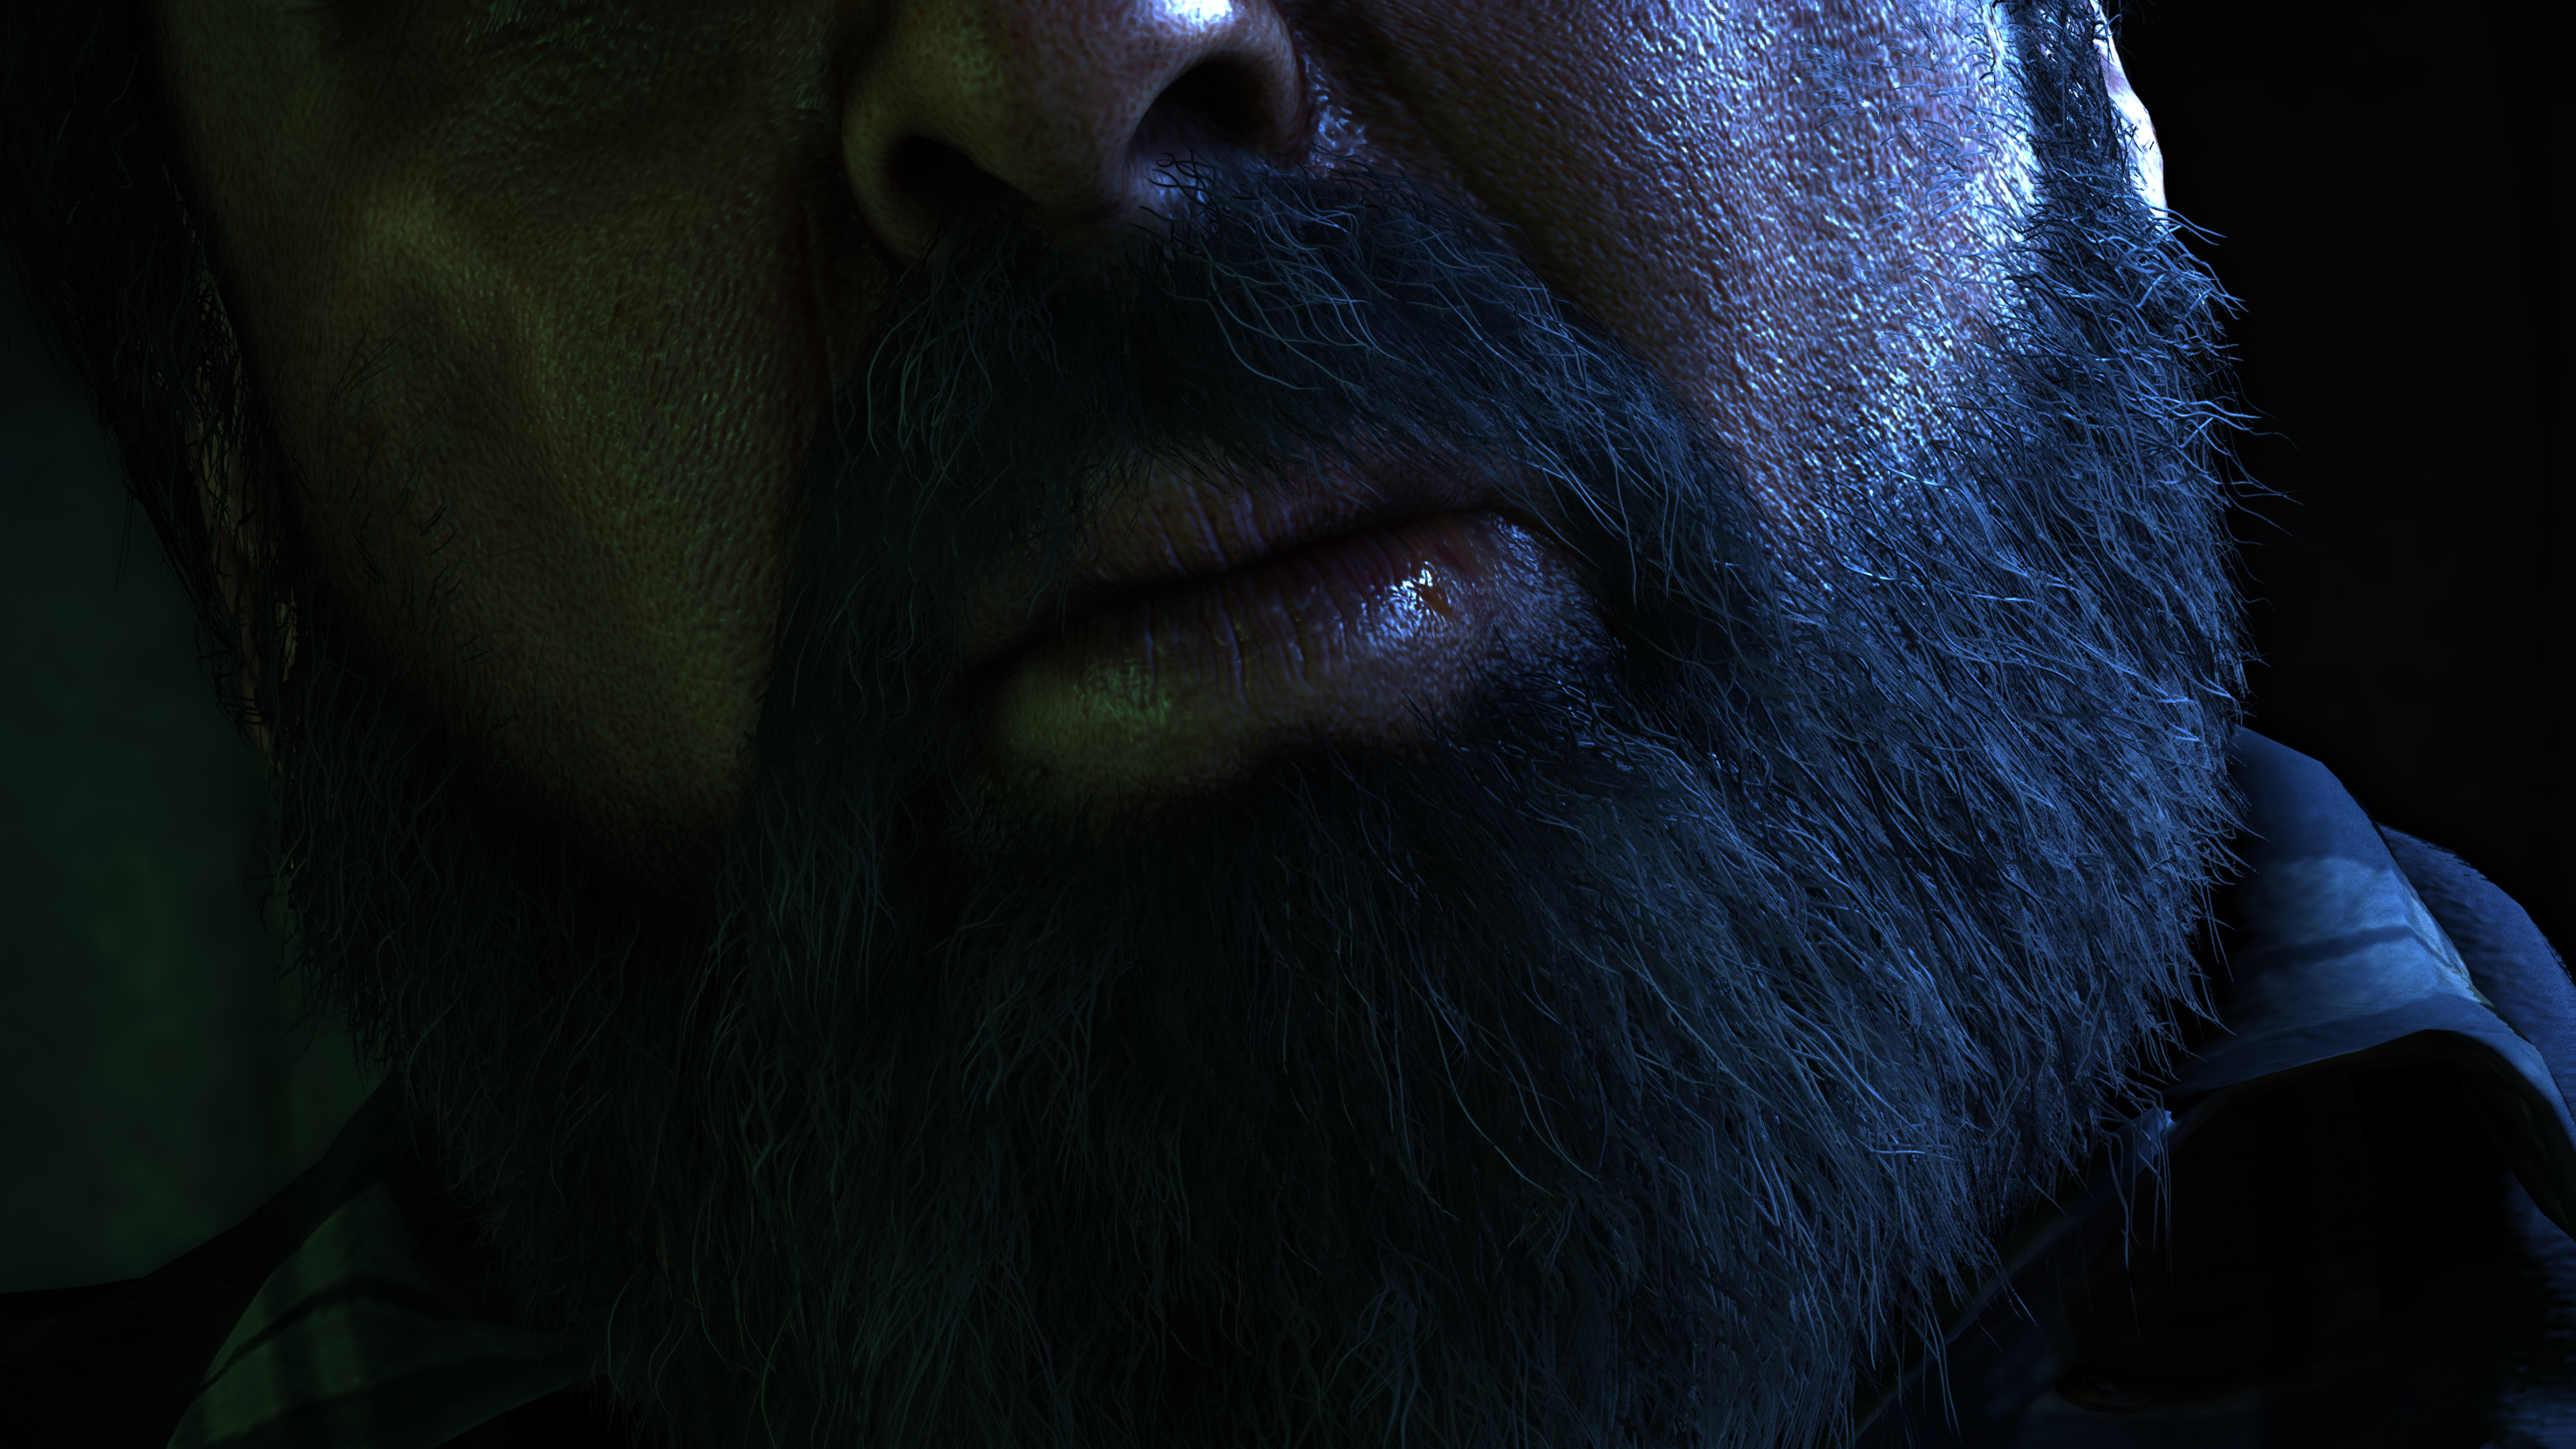
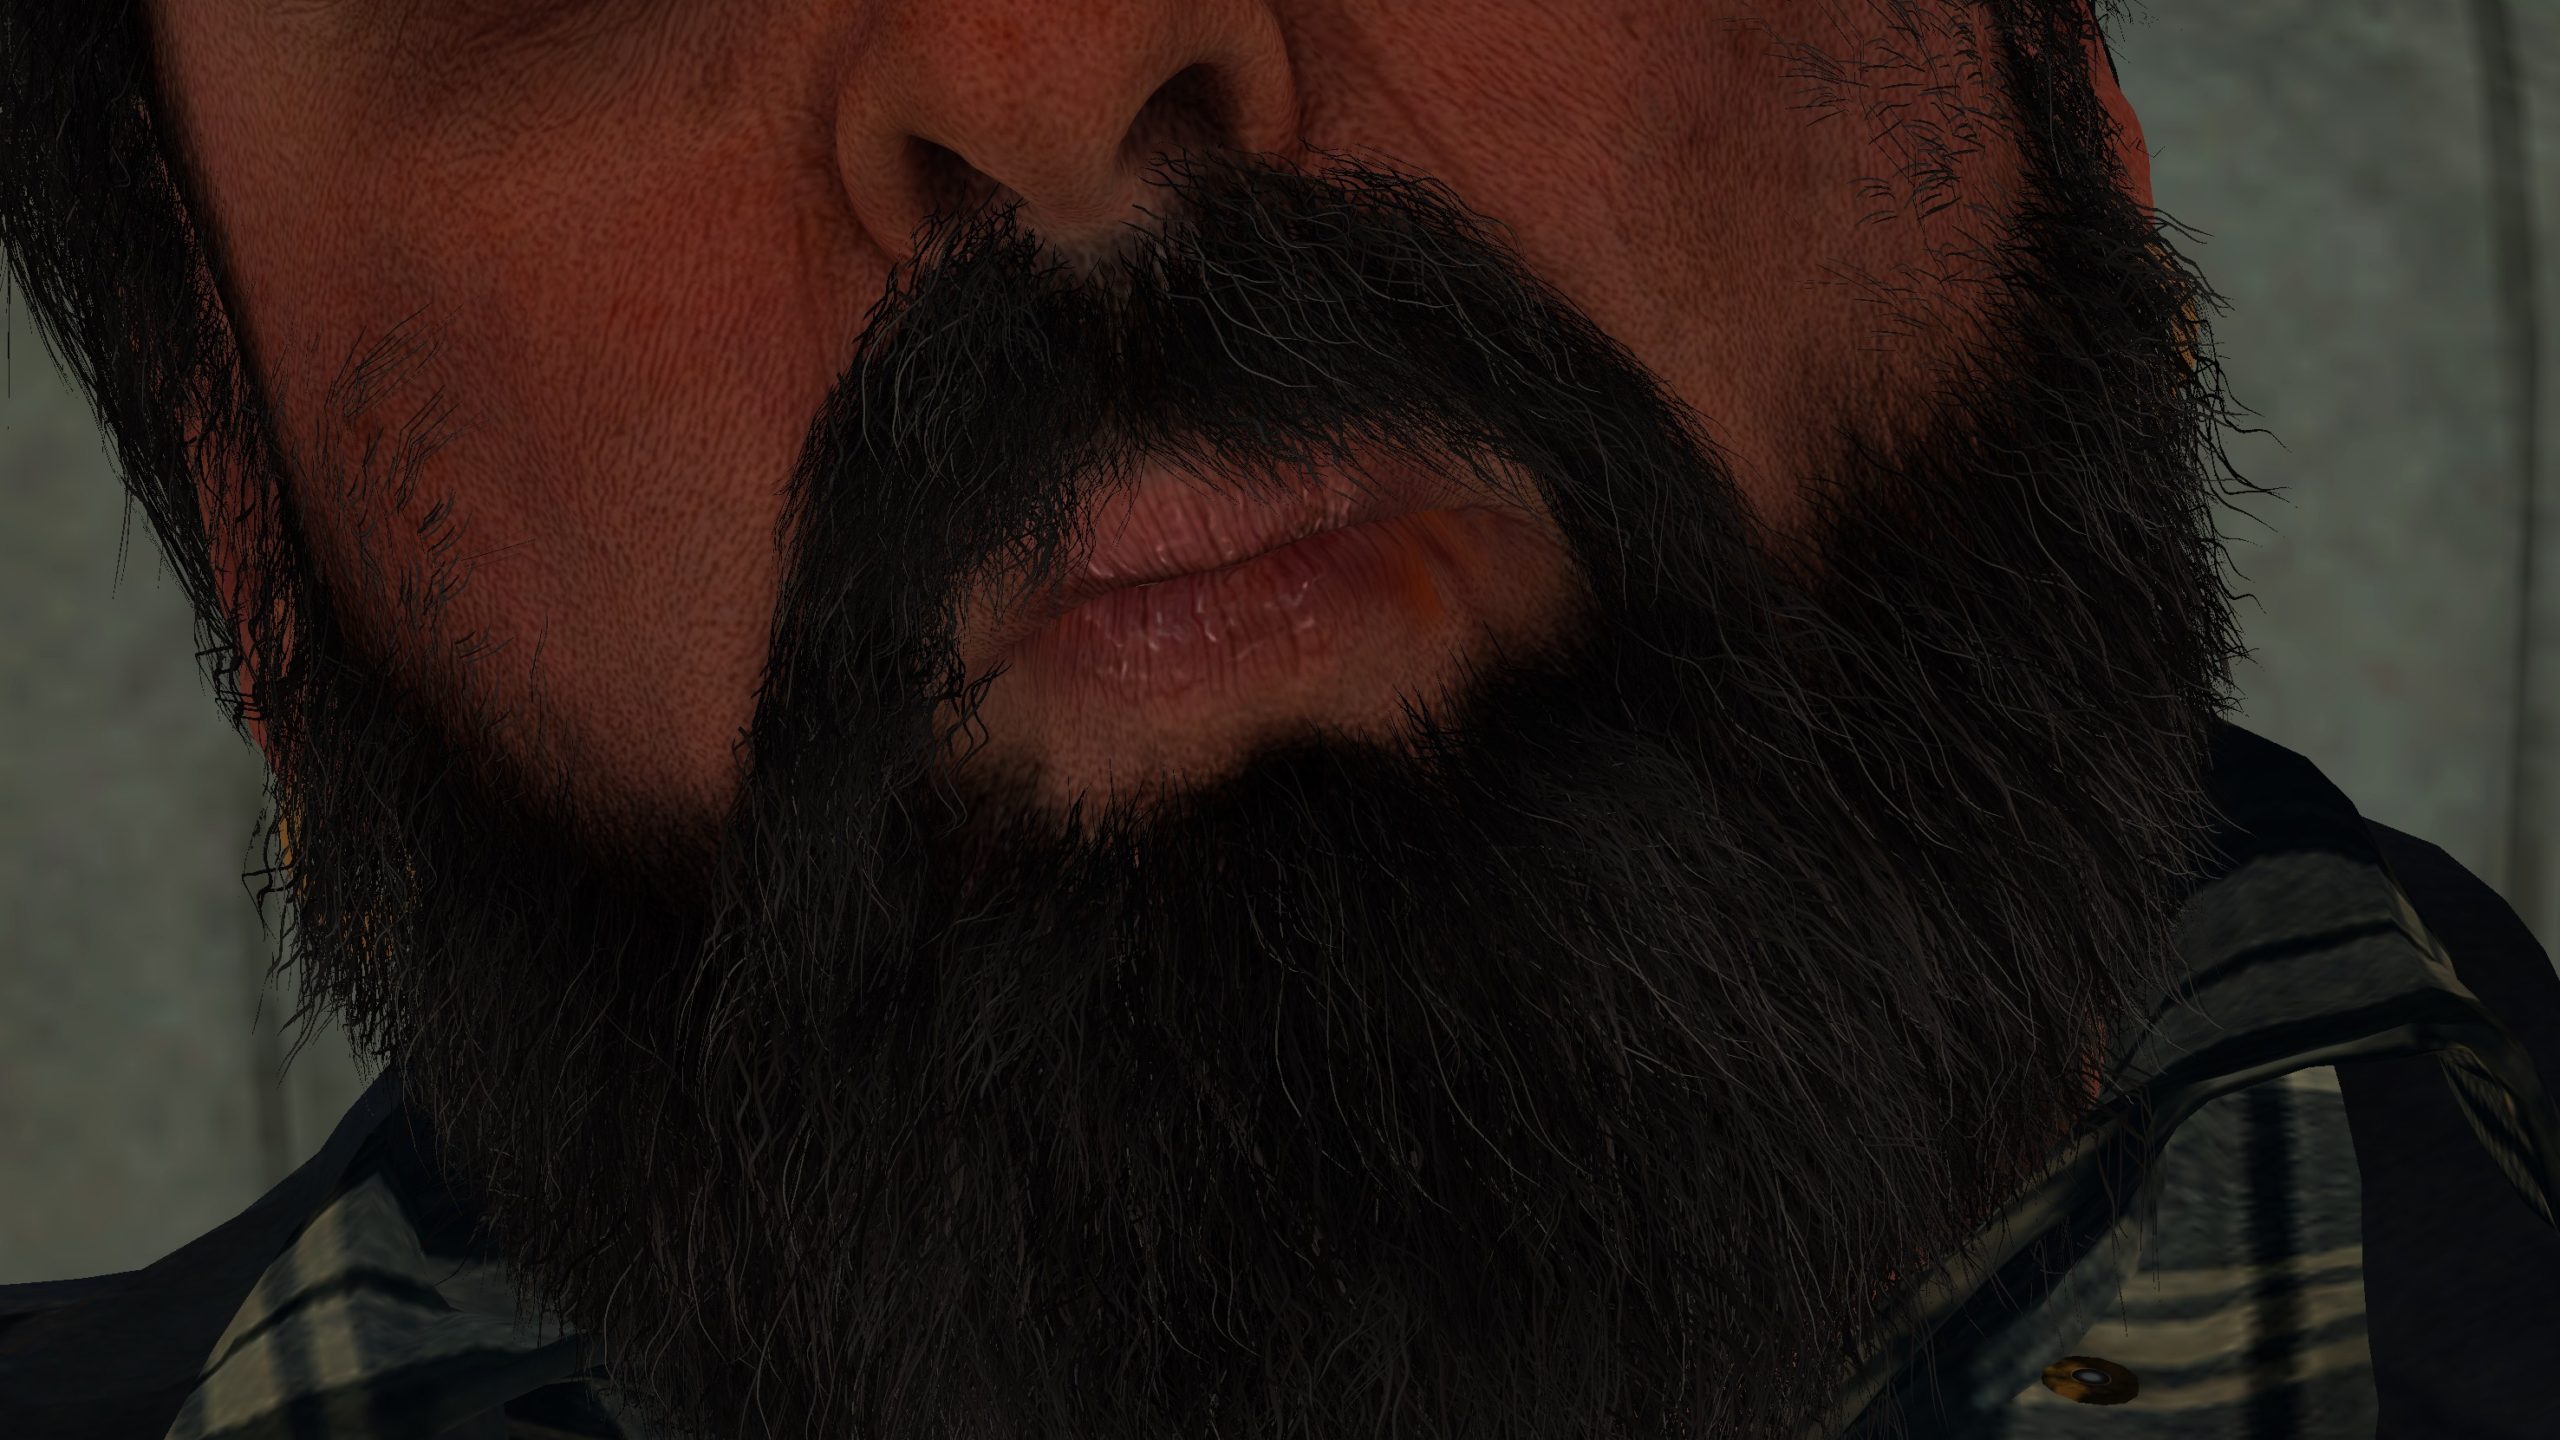
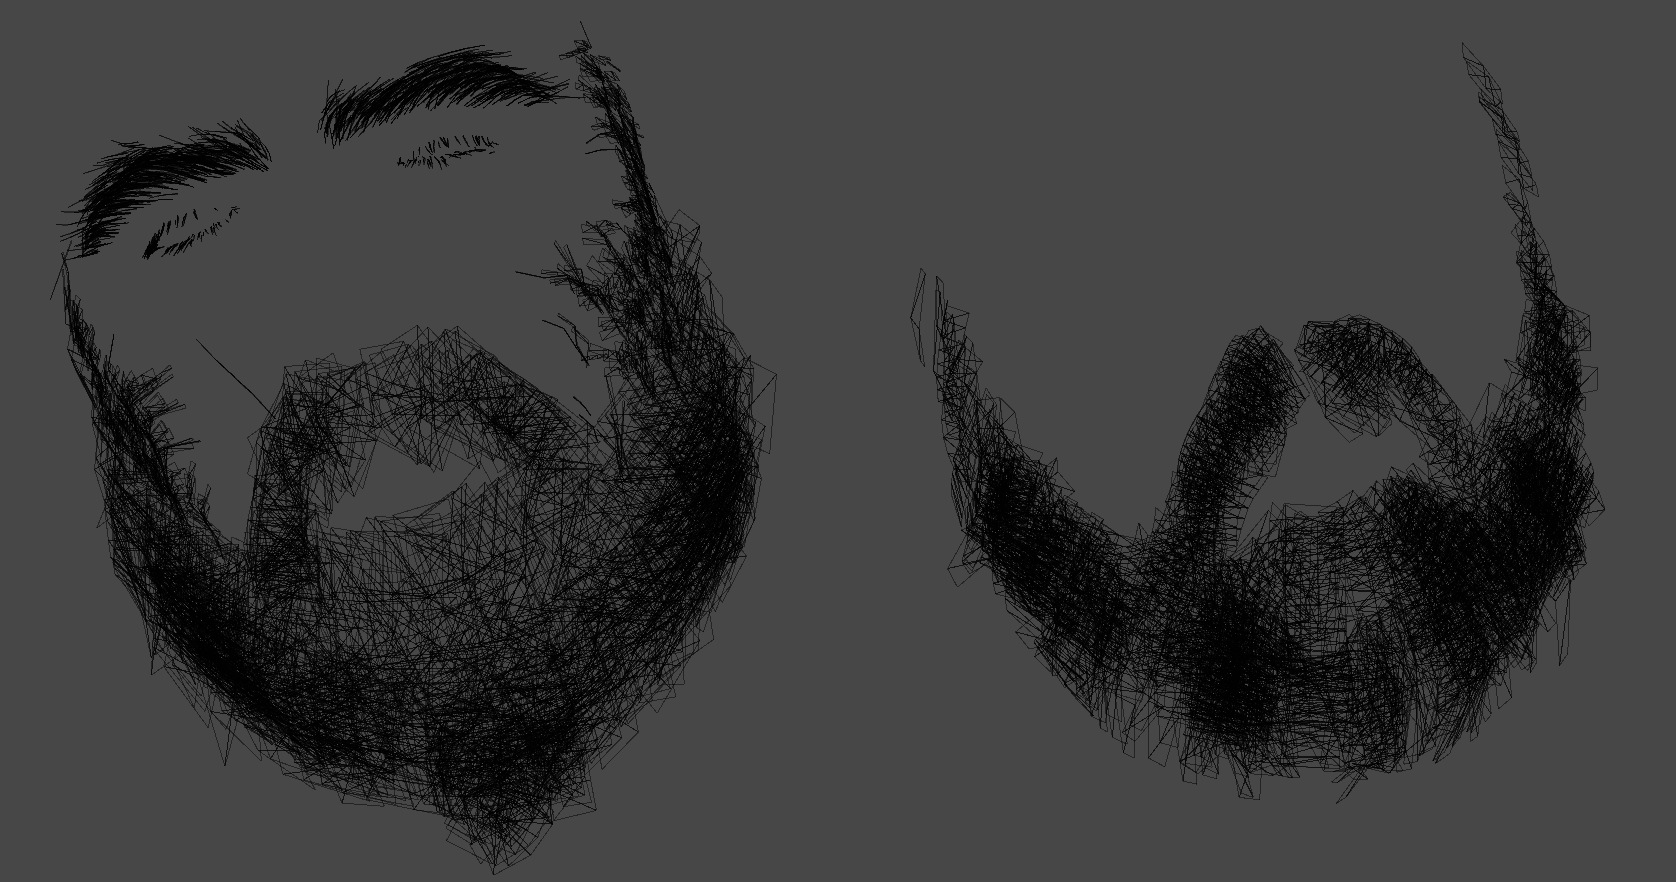
Hair drawing usually comes as the last step of the deferred pass (usually, but not always, in fact in the previous Leon’s frame, his hair was drawn at the very start of the frame before most of the supermarket items, where his body drawn at the far end of the frame). And to be honest, i’m having hard time to believe that this EPIC BEARD is just made of couple of layers of hair cards… the amount of details and the individual strands looks outstanding & unique!!!


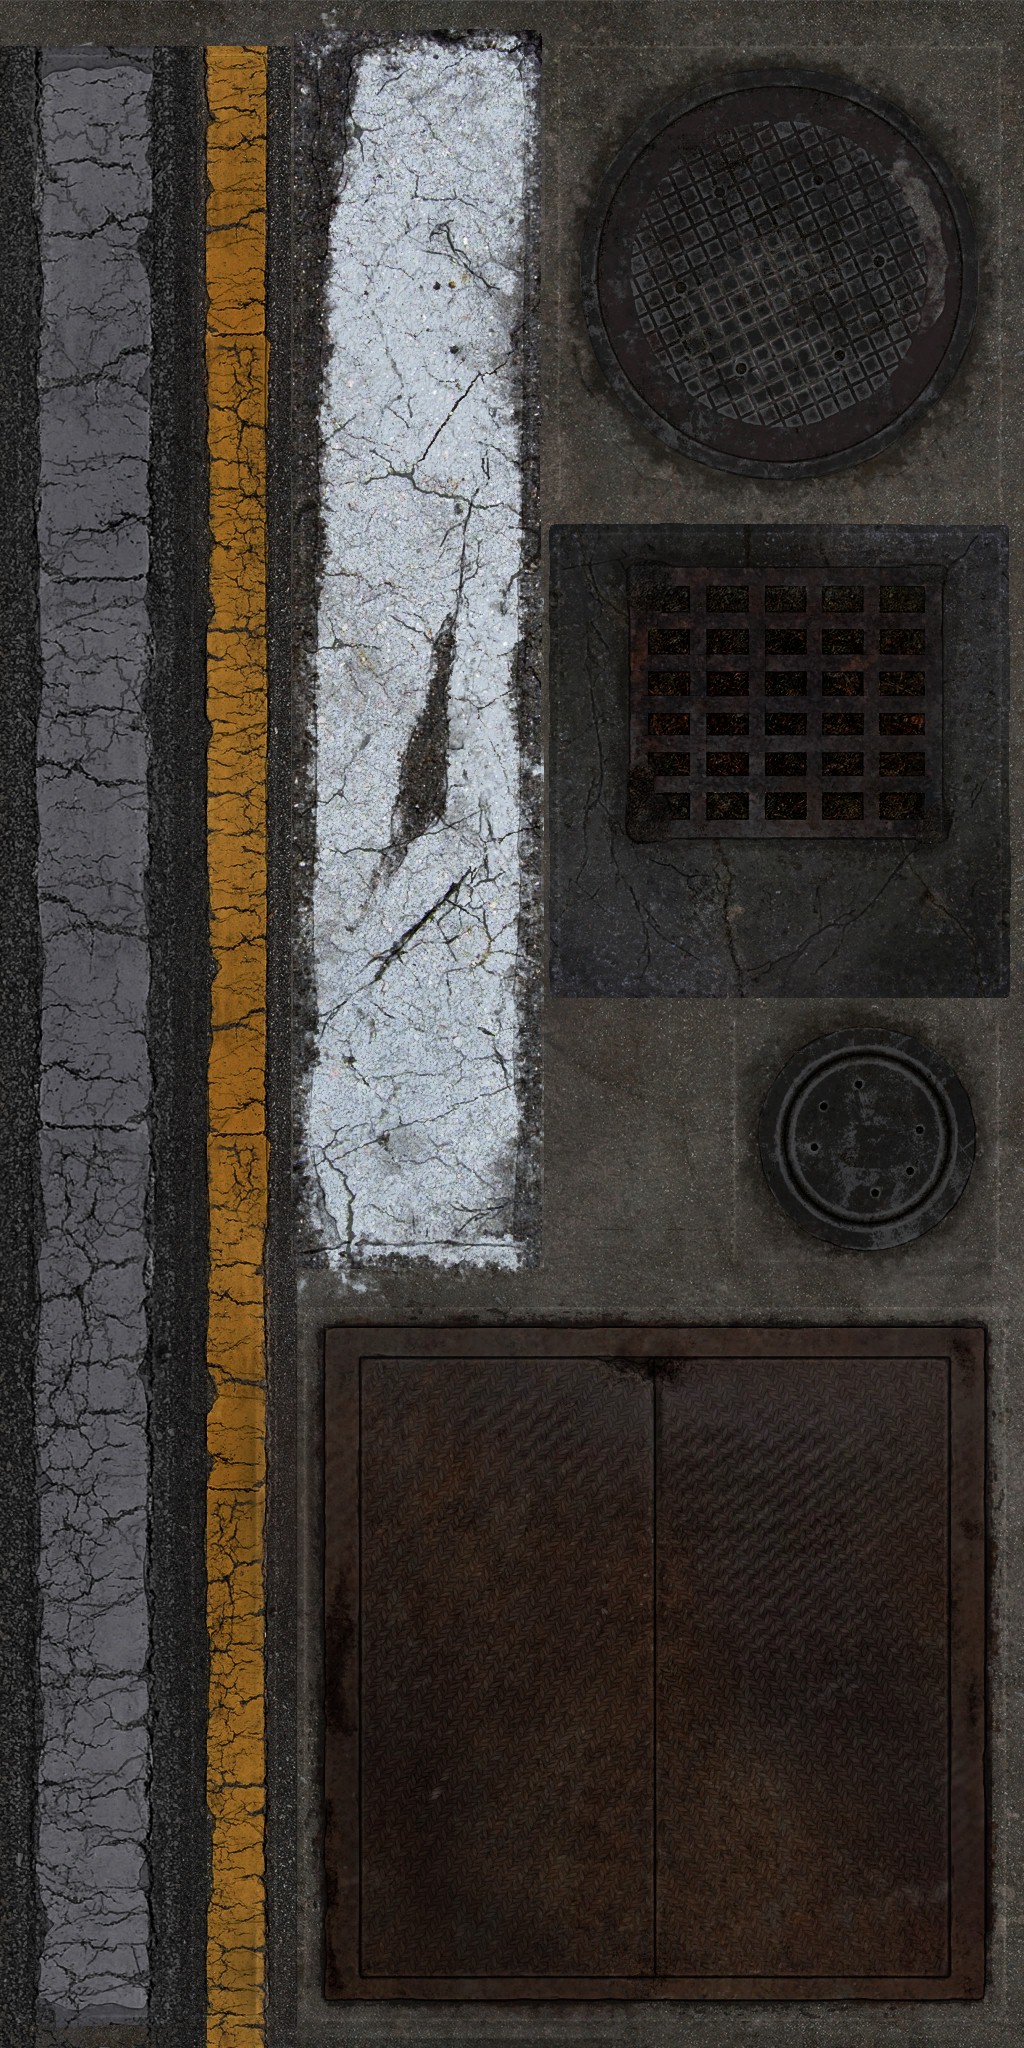
Decals
Decals is the last thing to draw in the deferred’s GBuffer color pass, step by step using a quad per decal (if not complex). Some of those decal quads are already combined together during the instancing step. So it’s quite popular to find a whole punch of decals show at one draw. Anyways, decals are in two different fashions
GBuffer Decals
GBuffer decals comes first, all of them, those are drawn to the GBuffer in a form of flat planes (all instanced already)
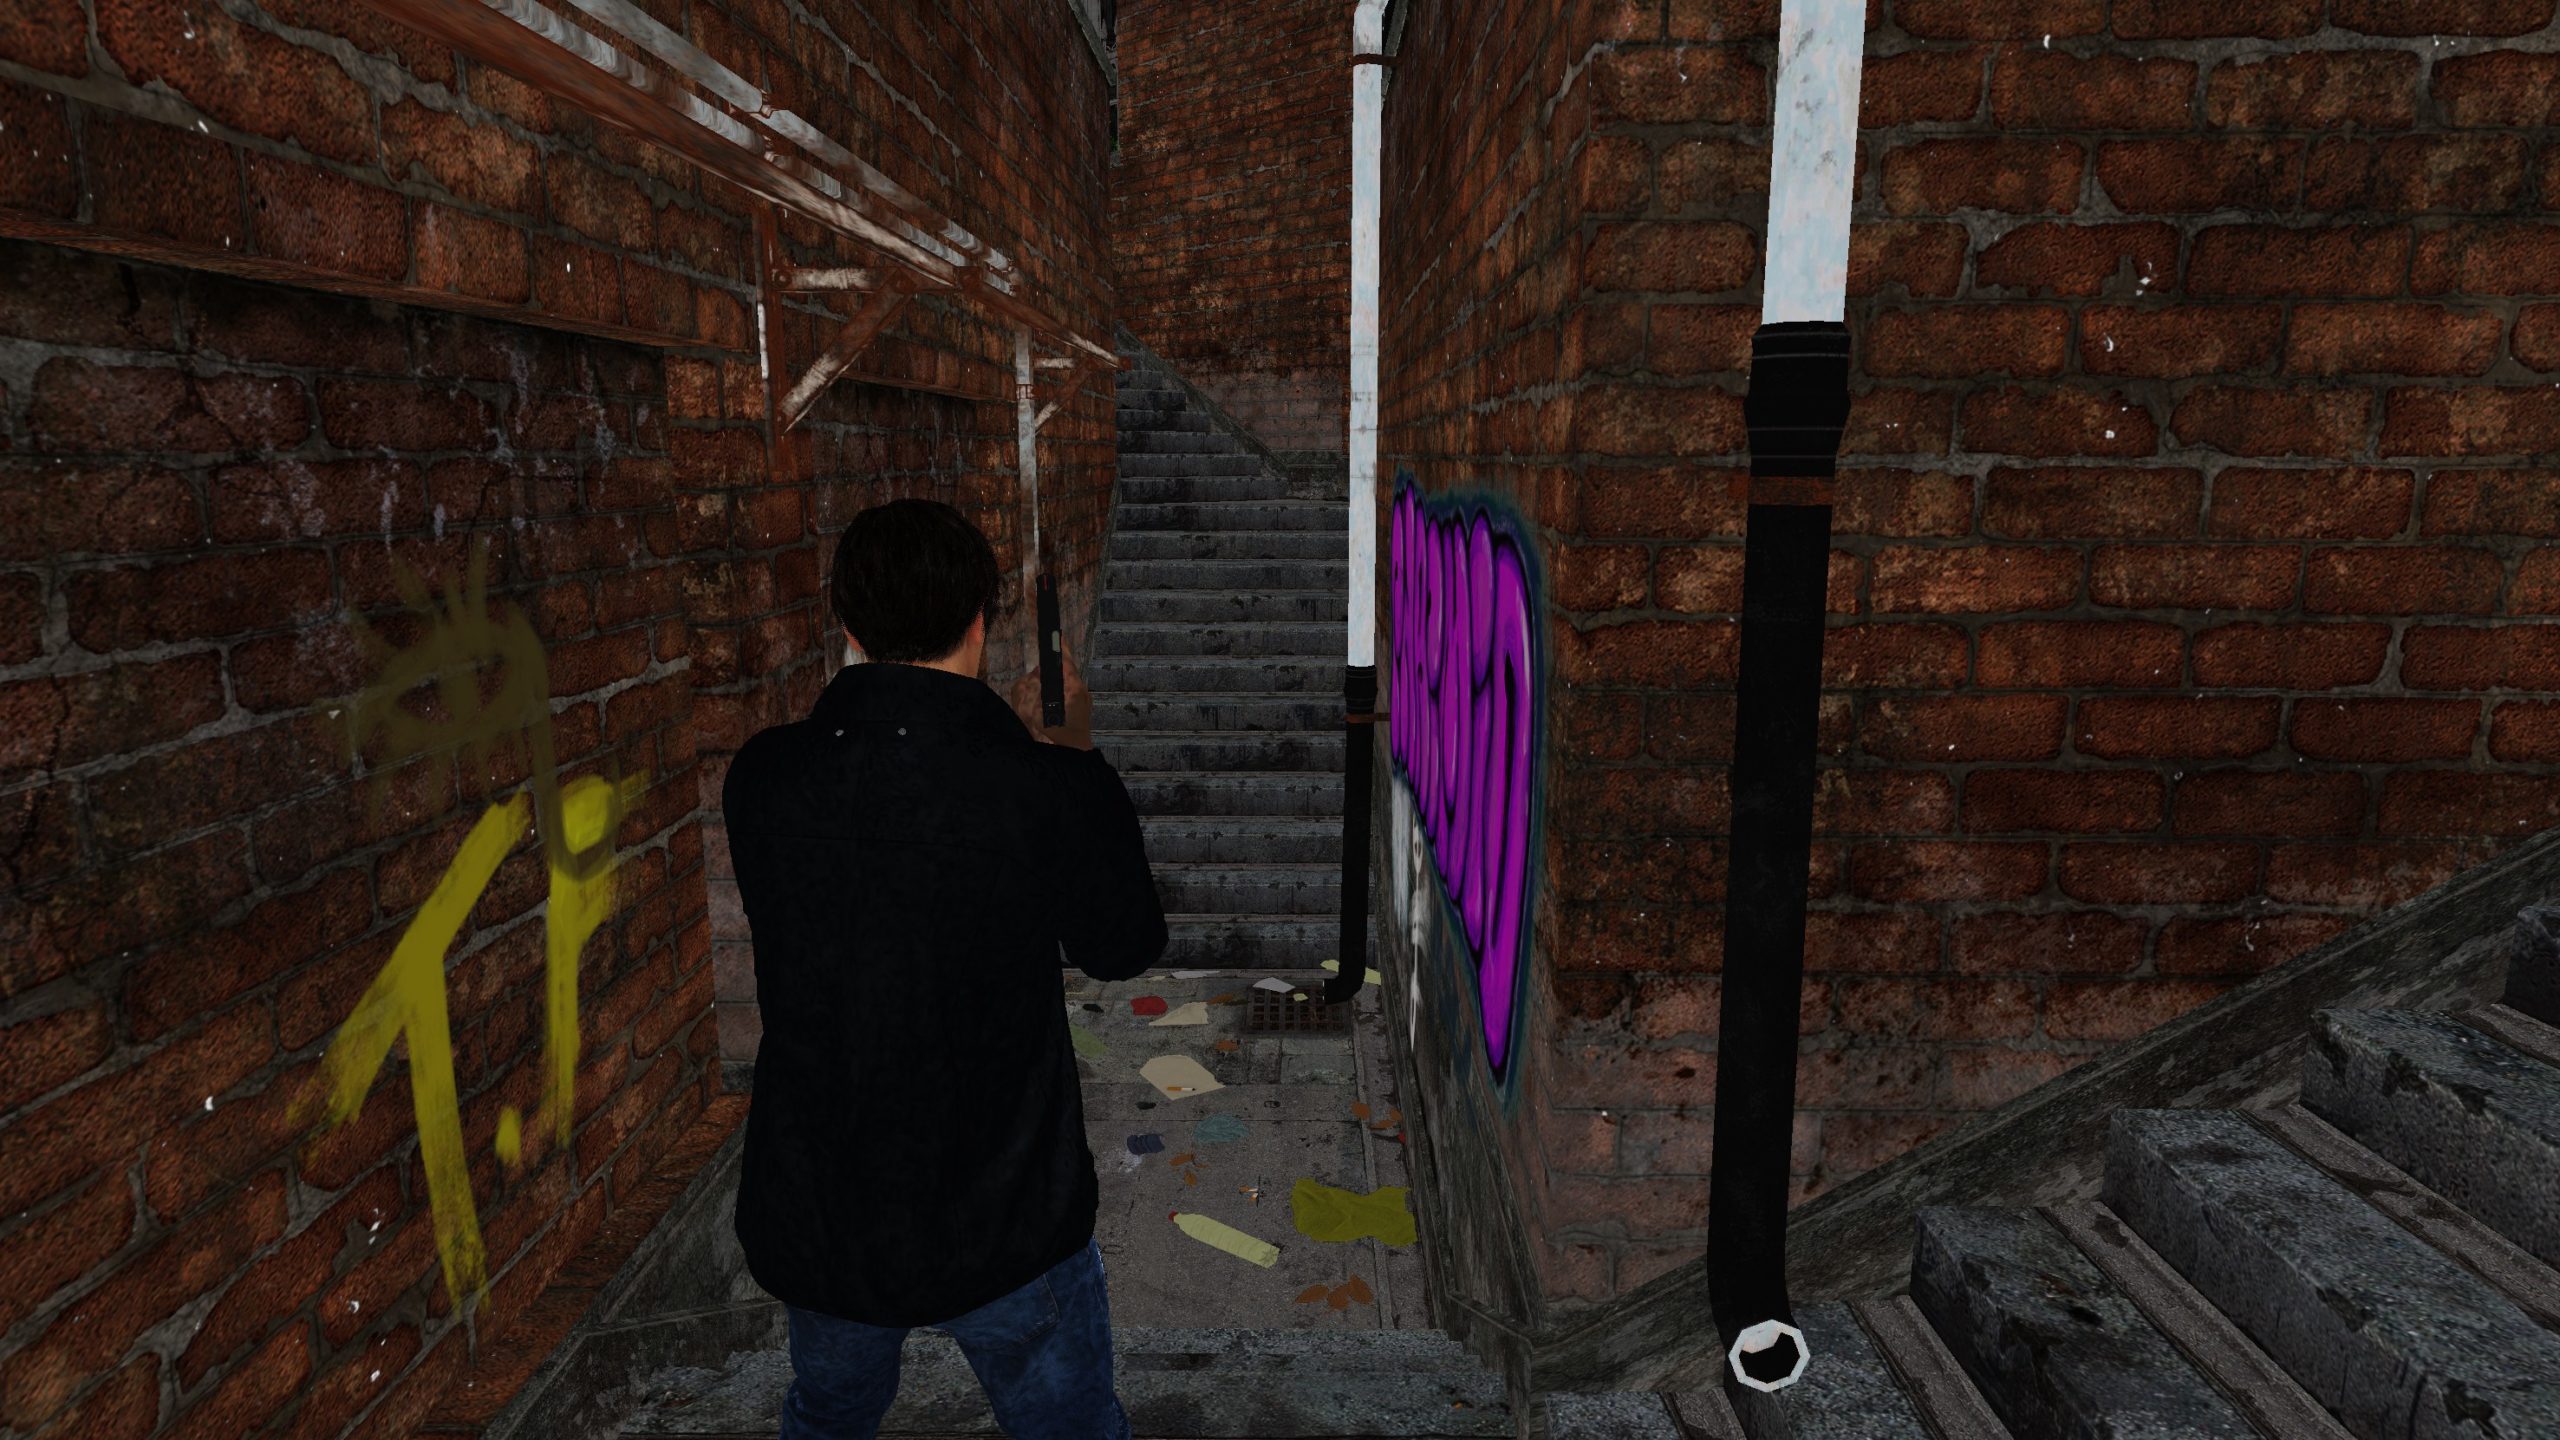

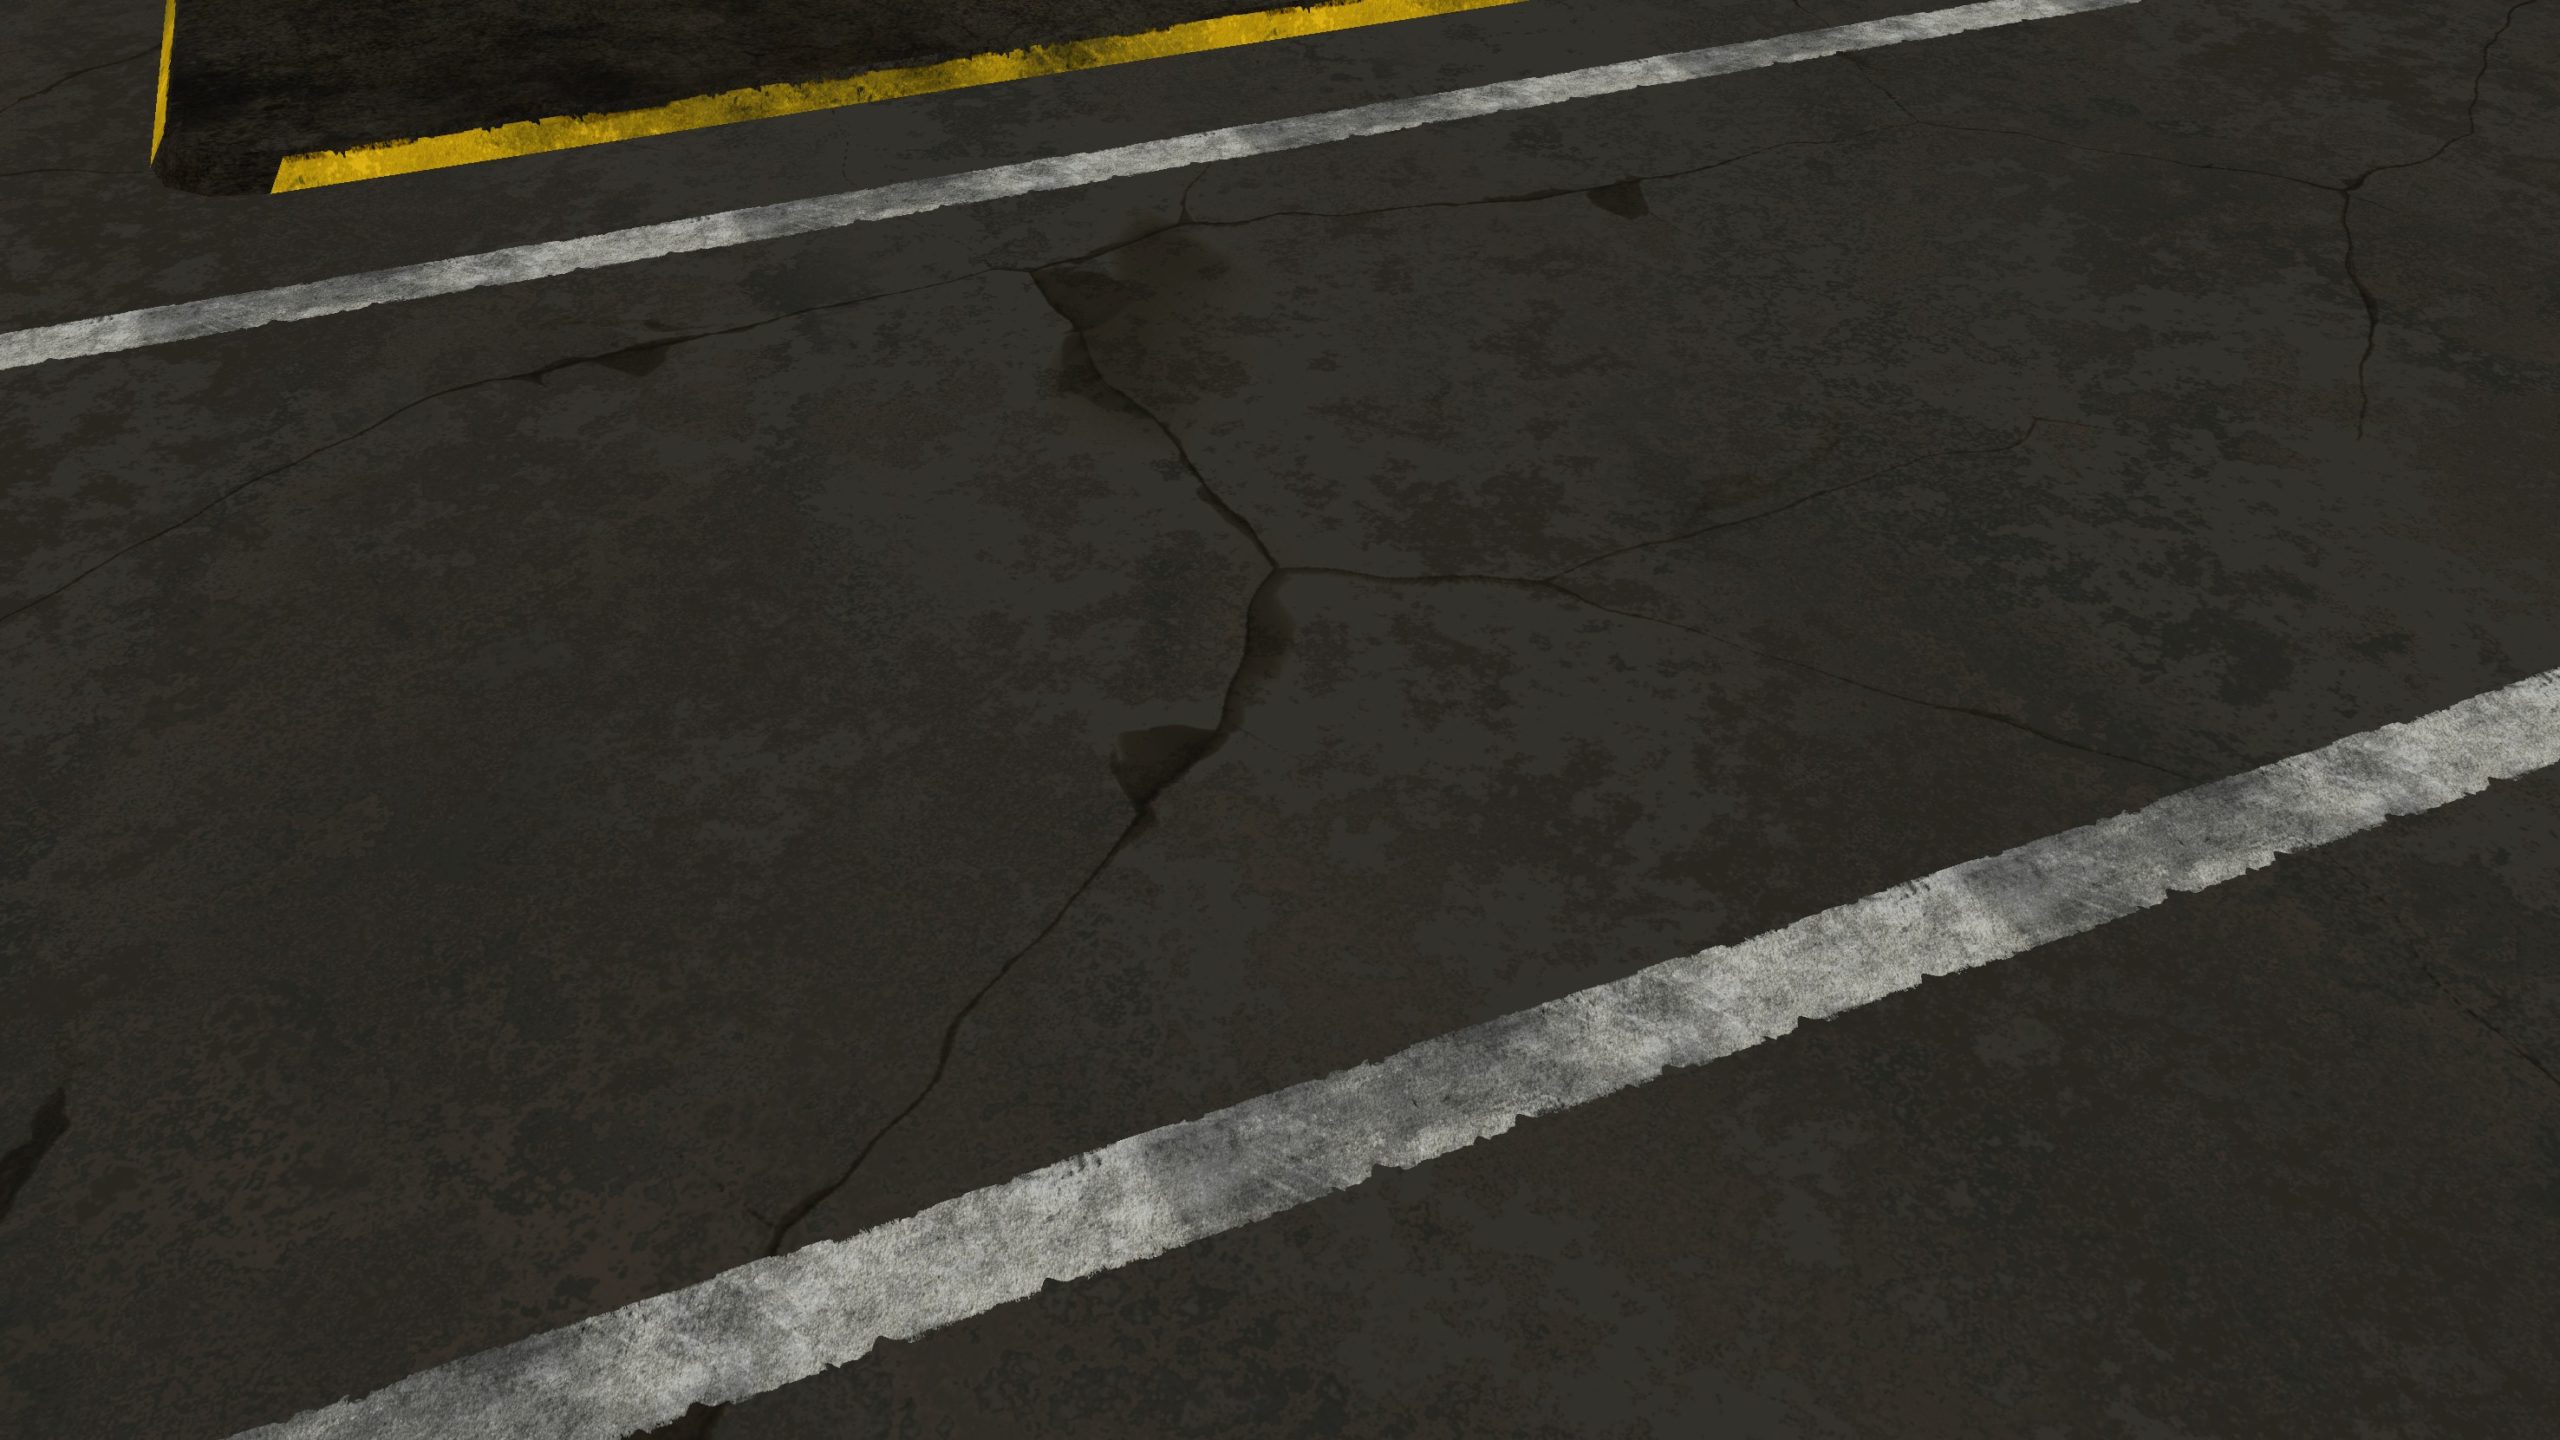
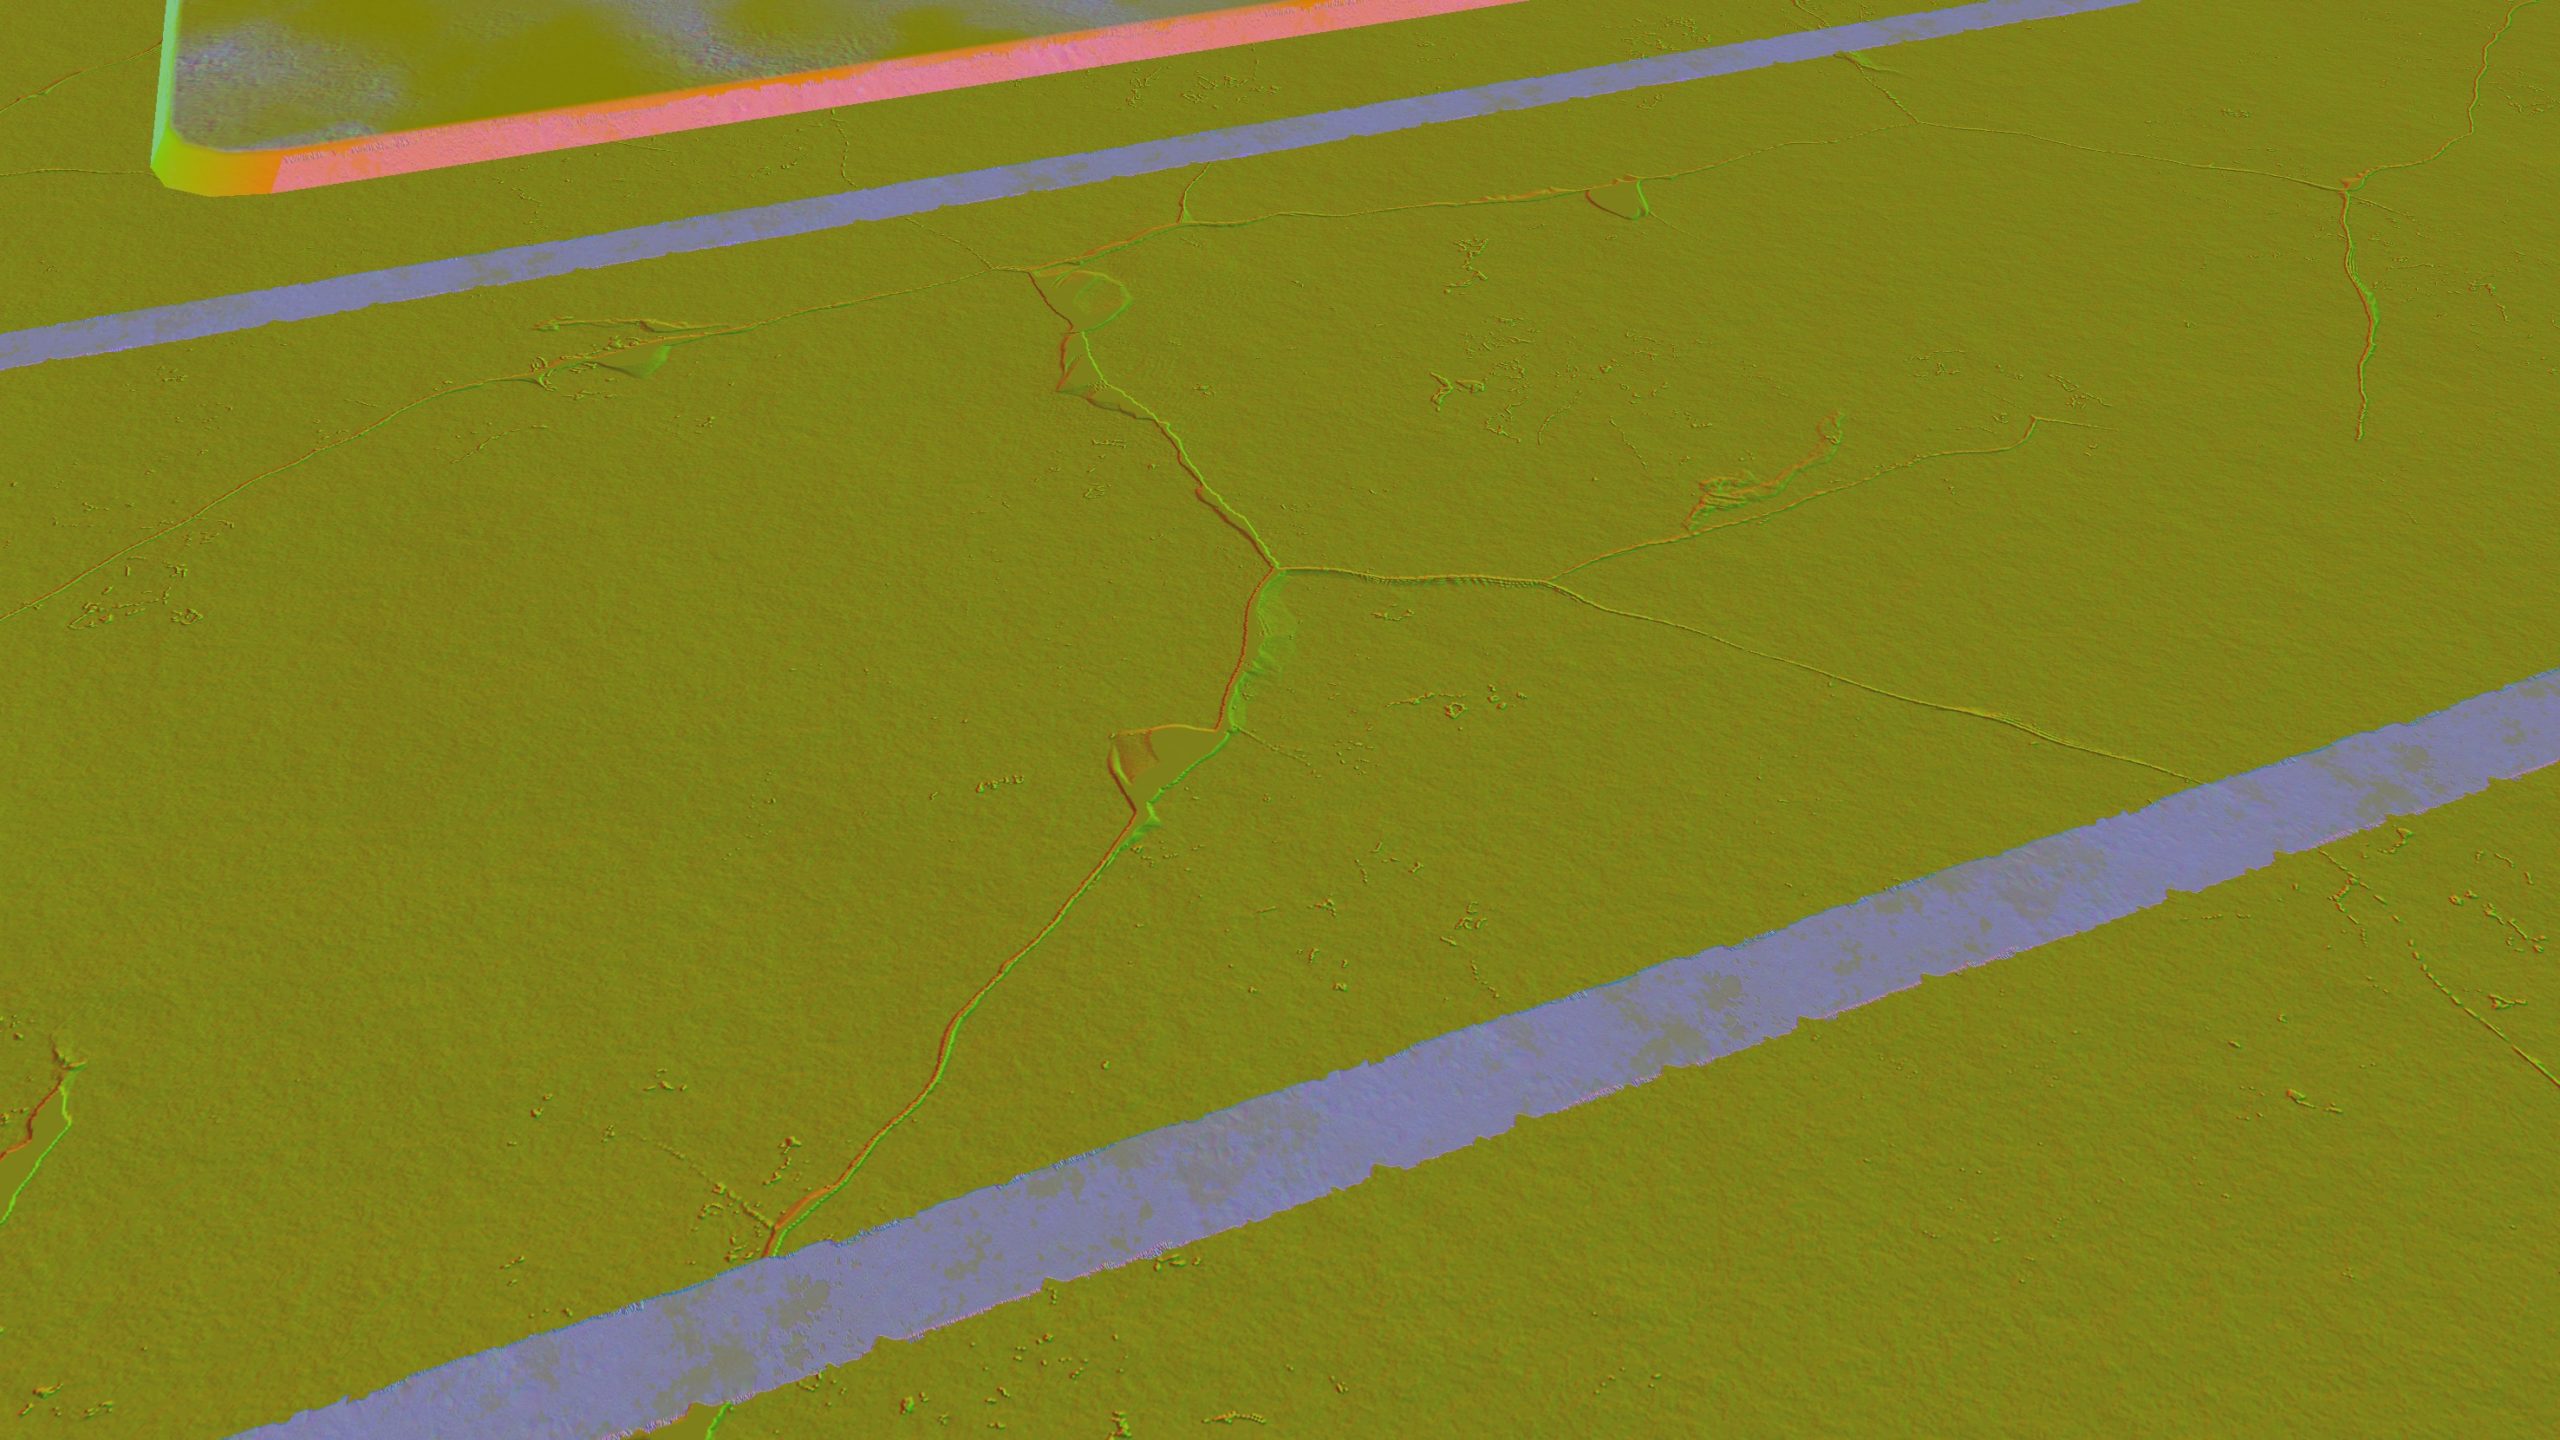
From those few draws of dirt on walls (perhaps hard to spot from this camera view), to graffiti, and even the street gutter. The PBR ready textures below used (color, normal & properties).


And of course, for better way to spot the deferred decals painting, a step by step is always better!


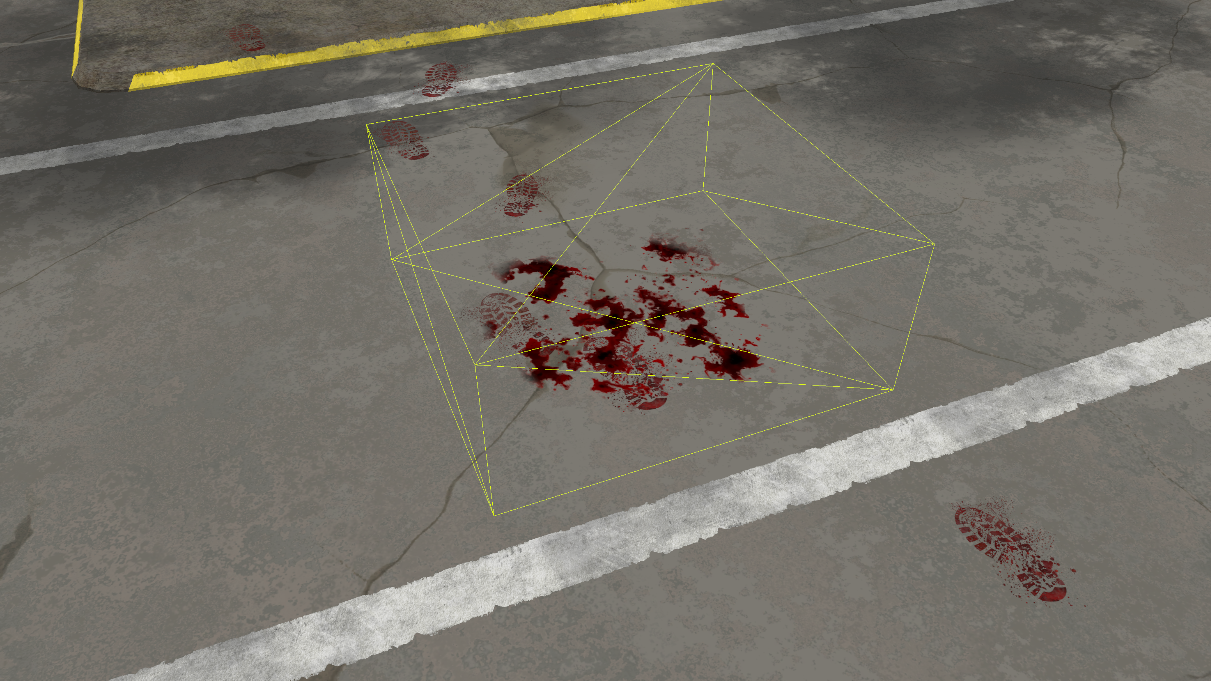
Volume Decals
Let’s take another example, that frame below
This example frame includes actually the previous type of decals (GBuffer Decals), as well as the “Volume Decals”. The Volume Decals are projected using a volume as the name implies, which is cubes most of the time. So, to better differentiate about the GBuffer Decals and that Volume Decals in that frame, it’s enough to see the mesh being projects
And of course, for such a frame, each type of decals using it’s own texture set
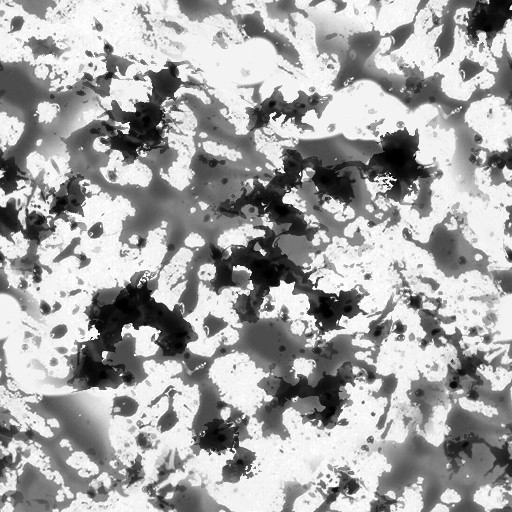
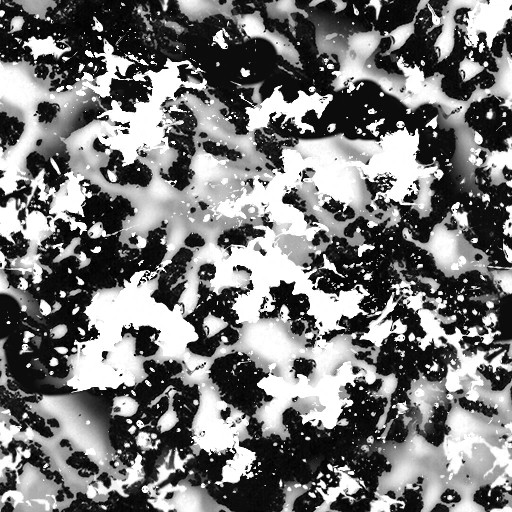
2nd row is what is used with the GBuffer Decals
So, as an example containing both types of decals, this is how decals goes for the frame. Gbuffer first, then the Volume Decals

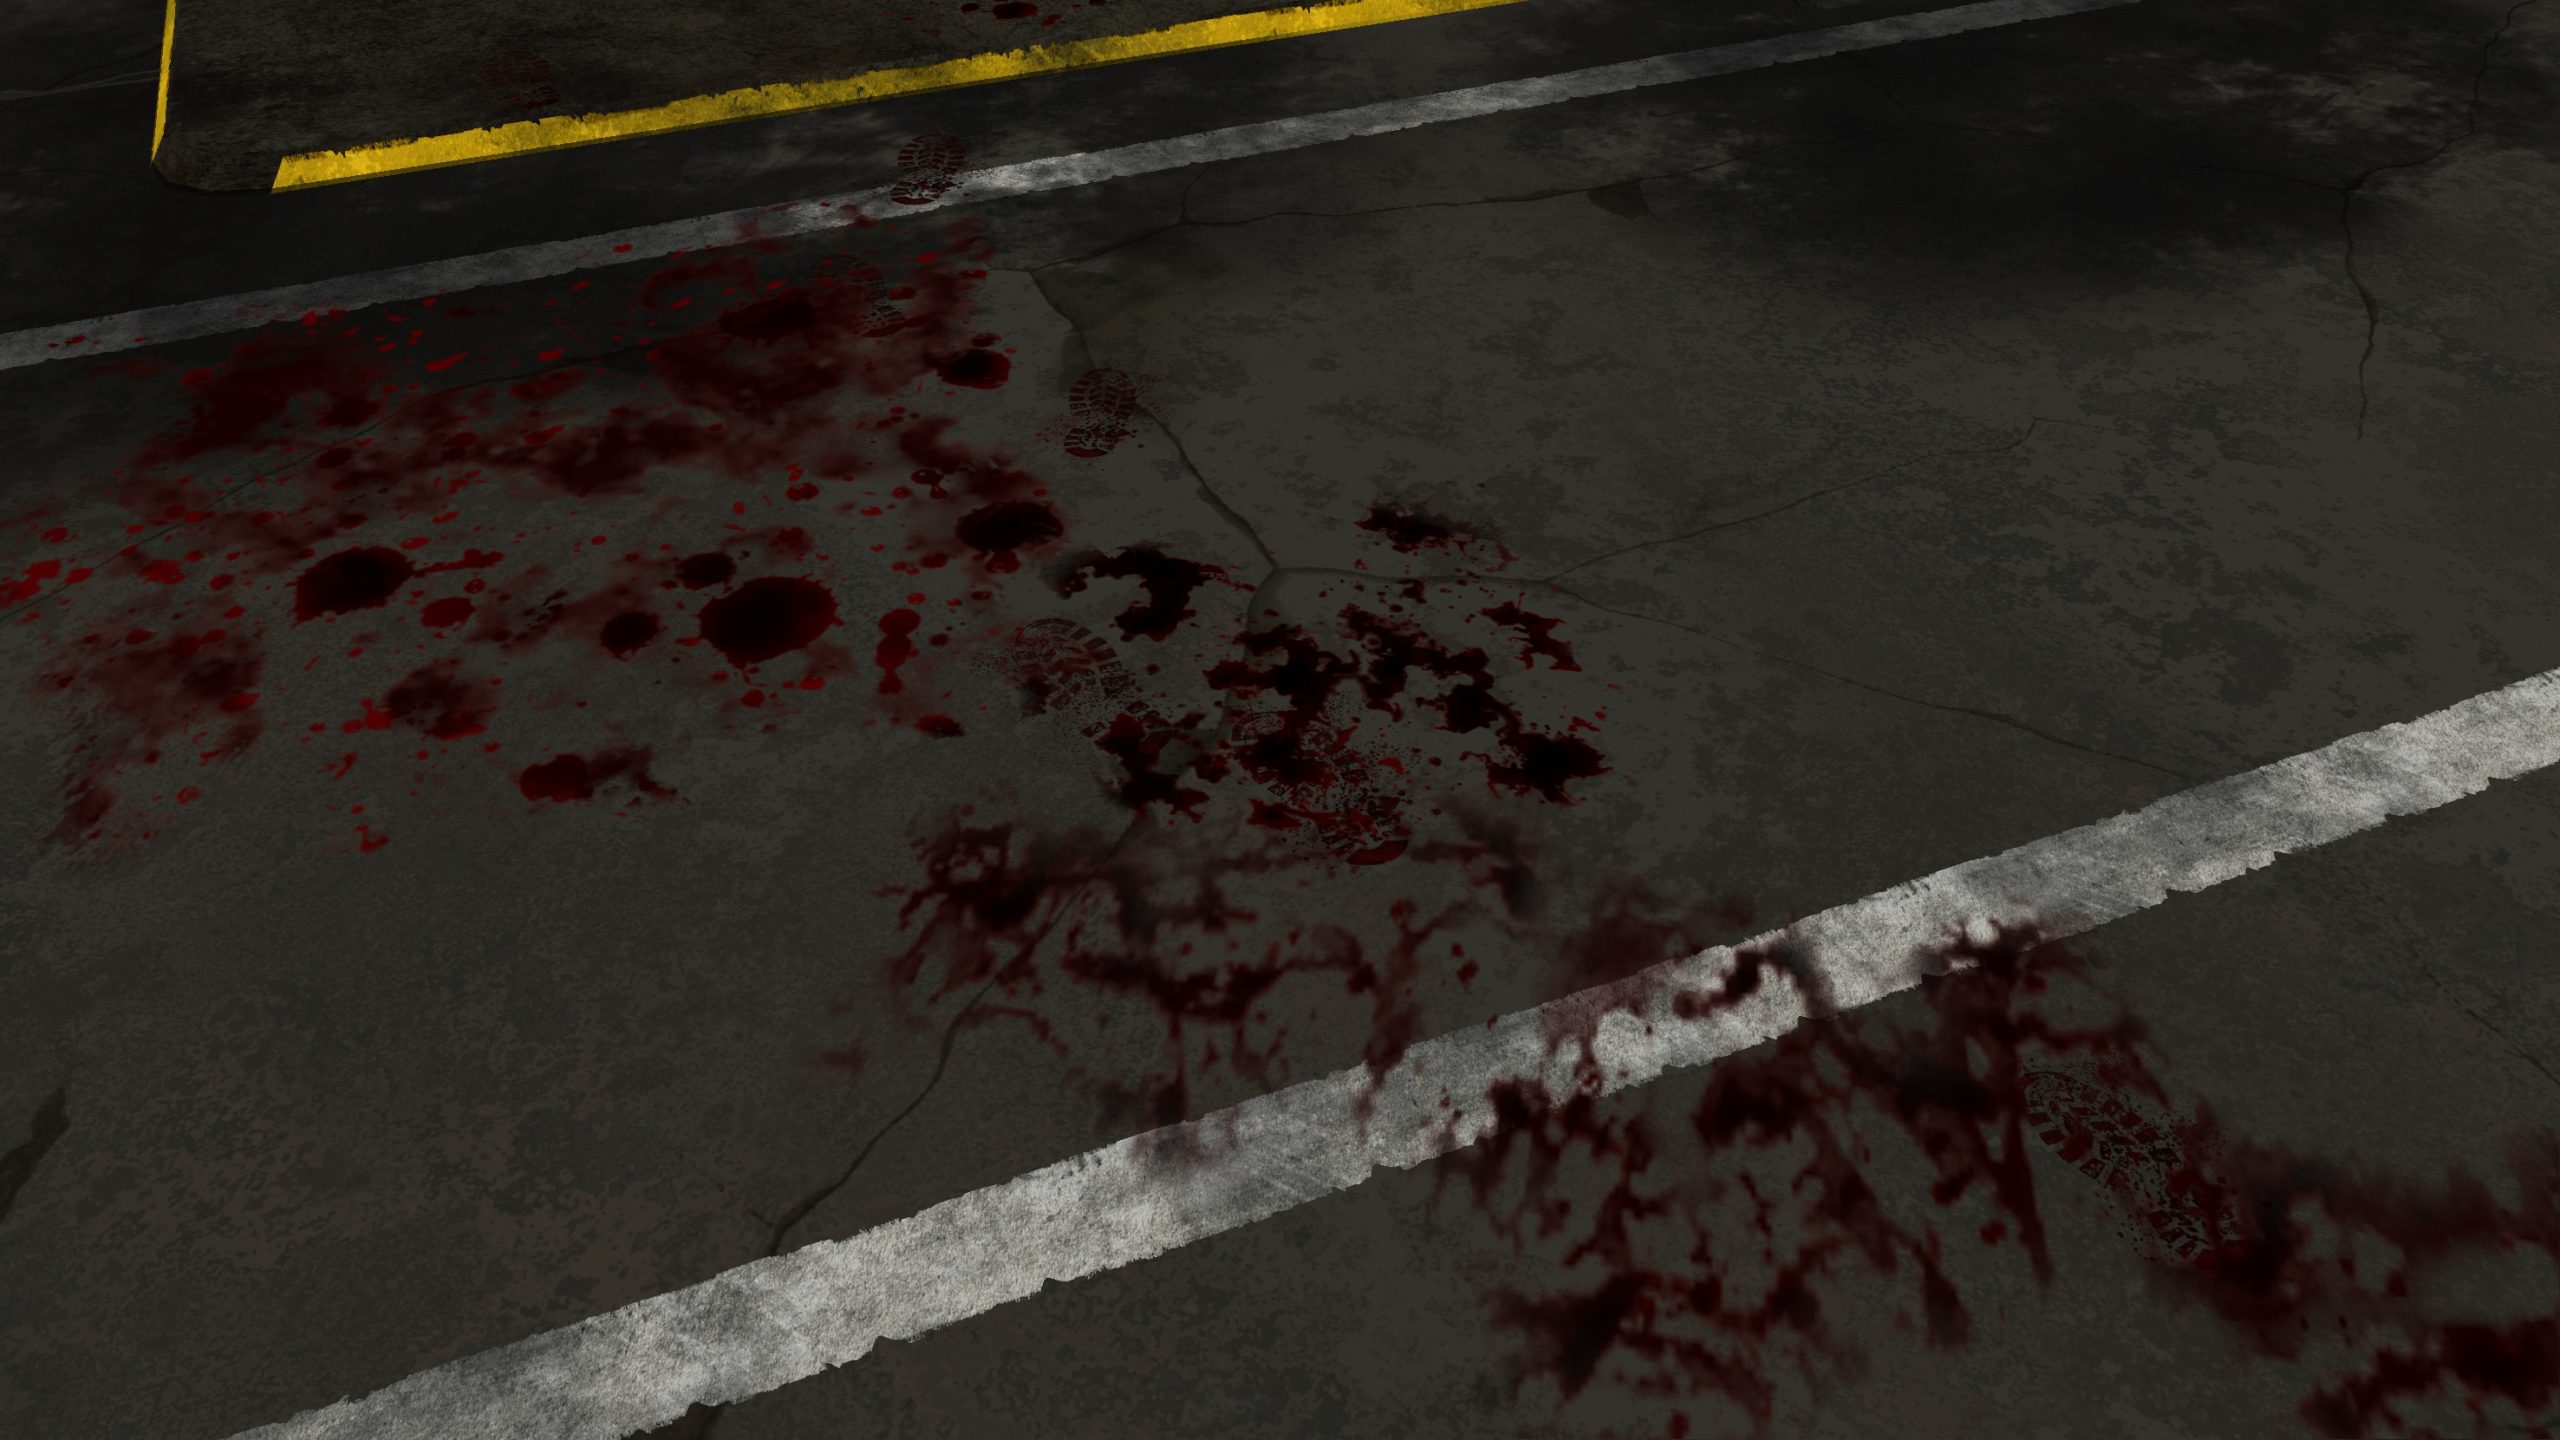
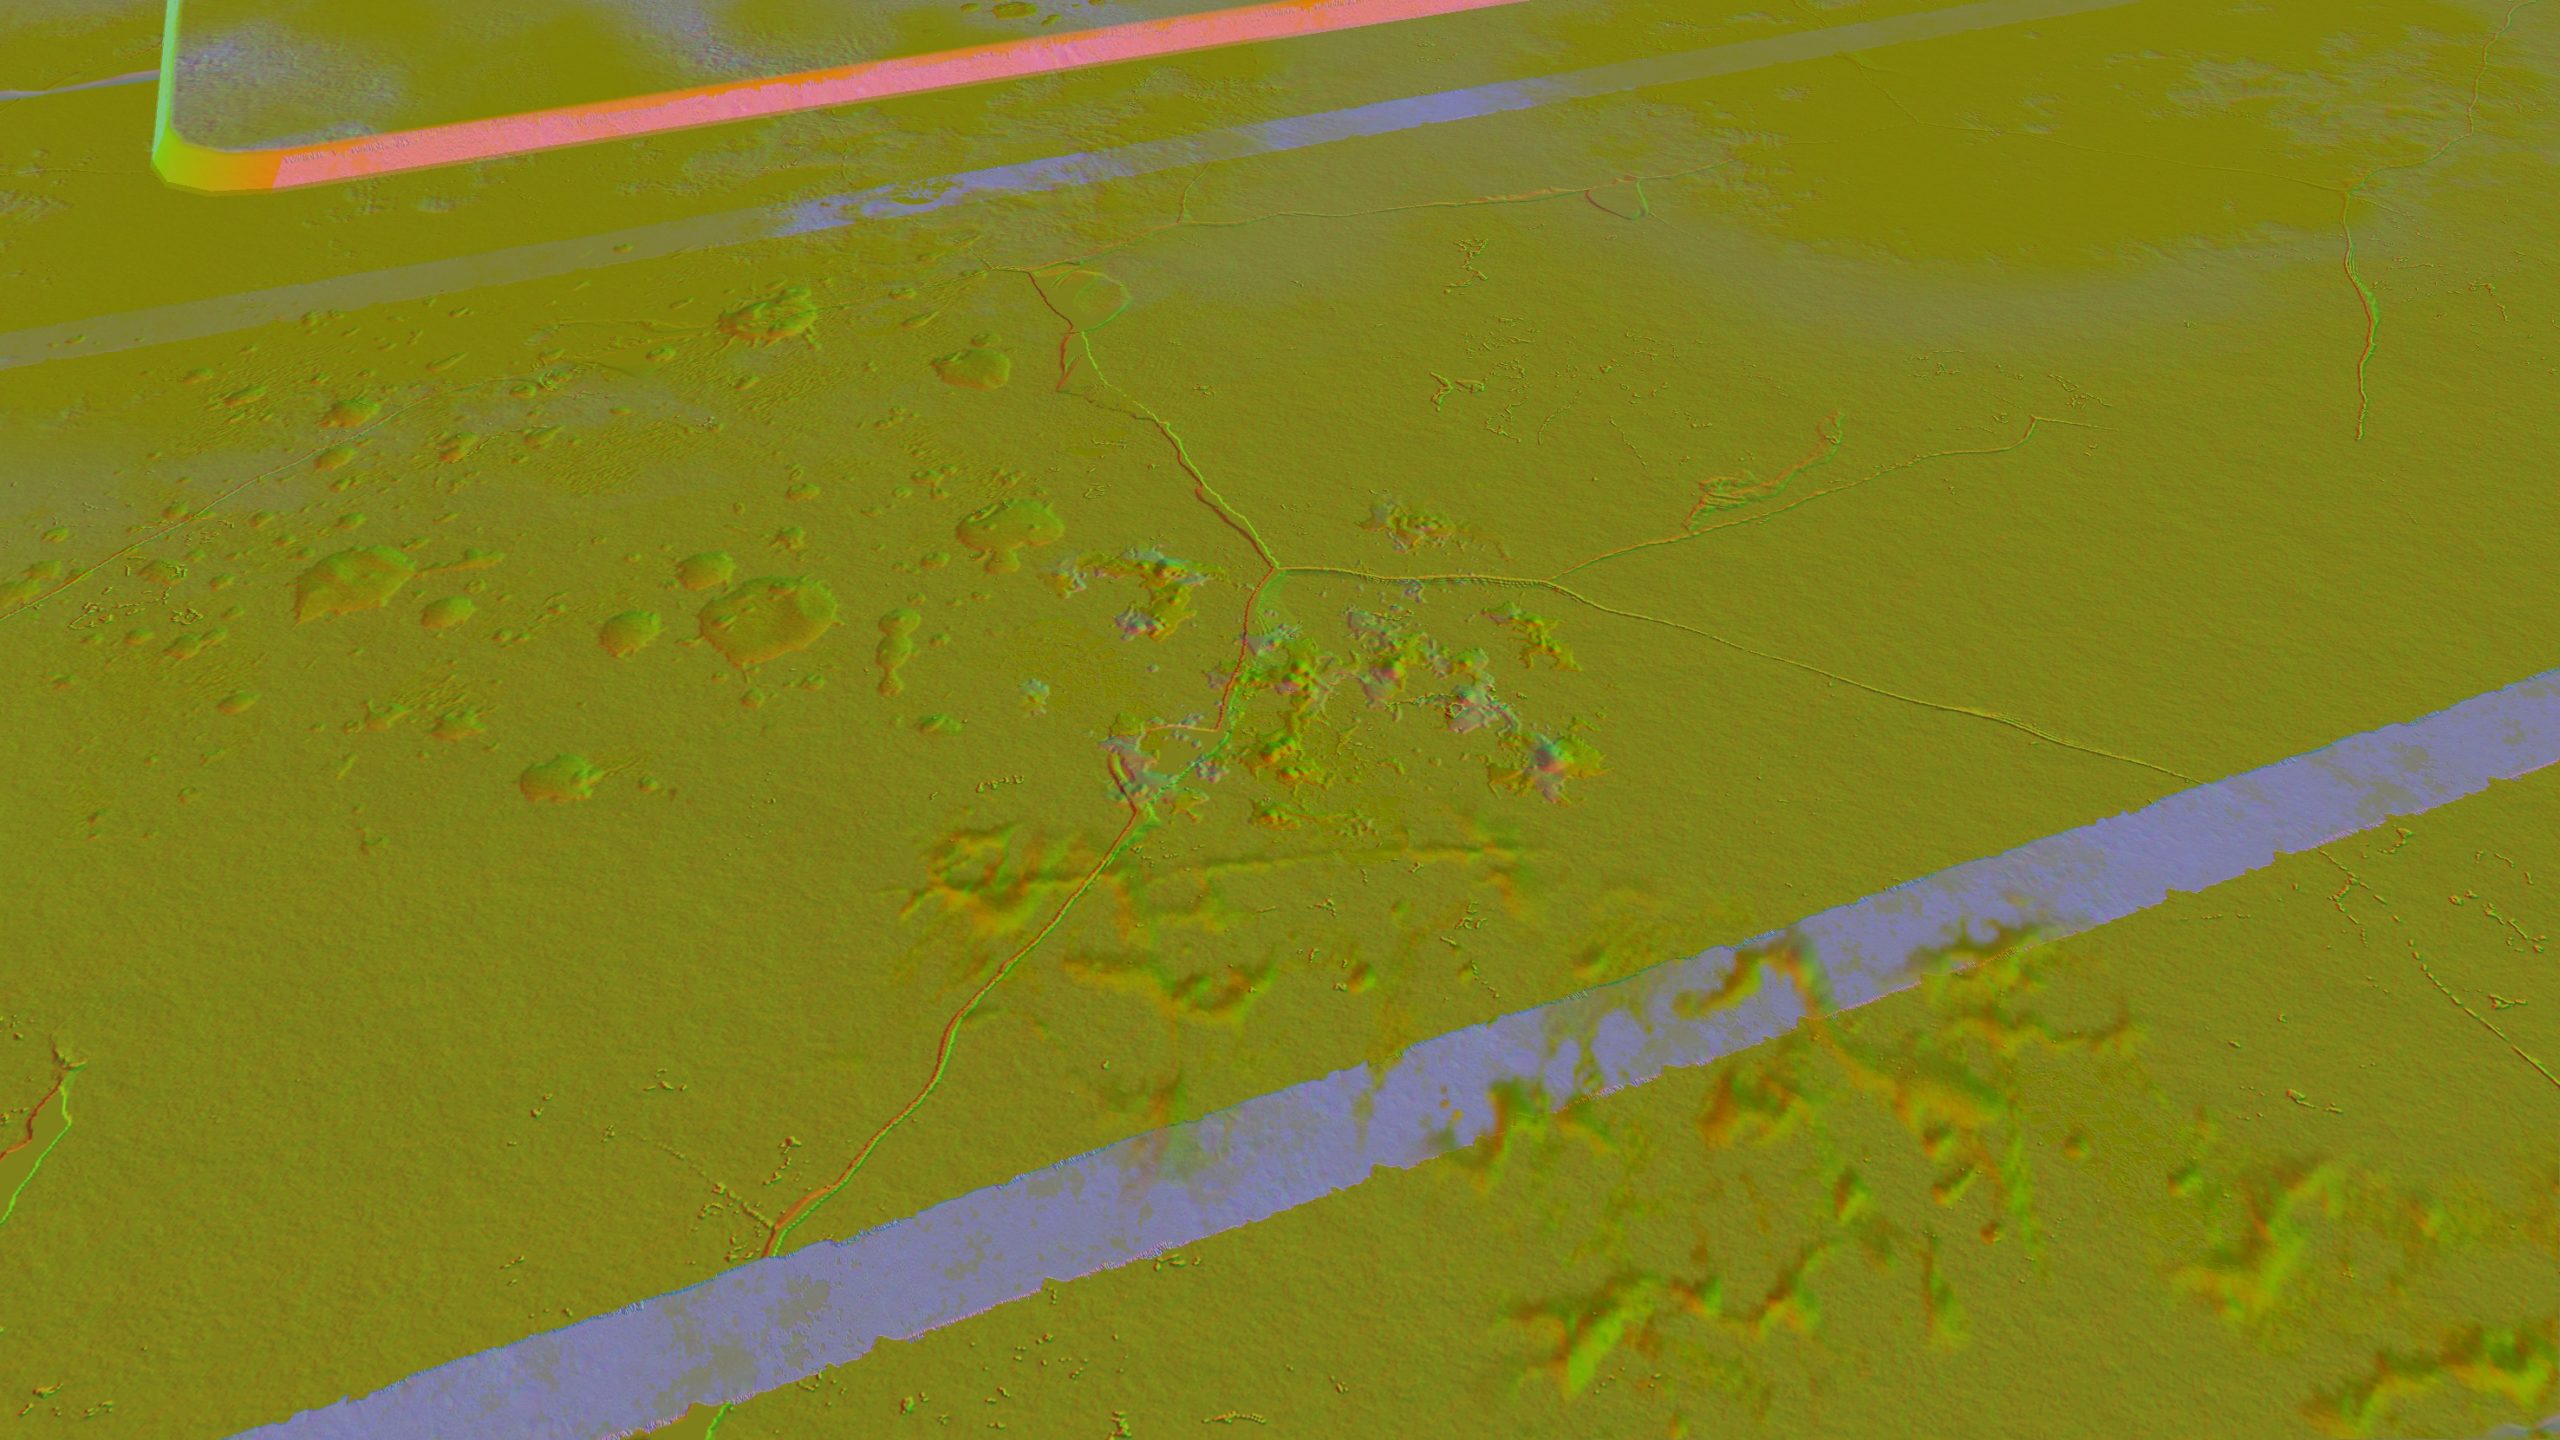
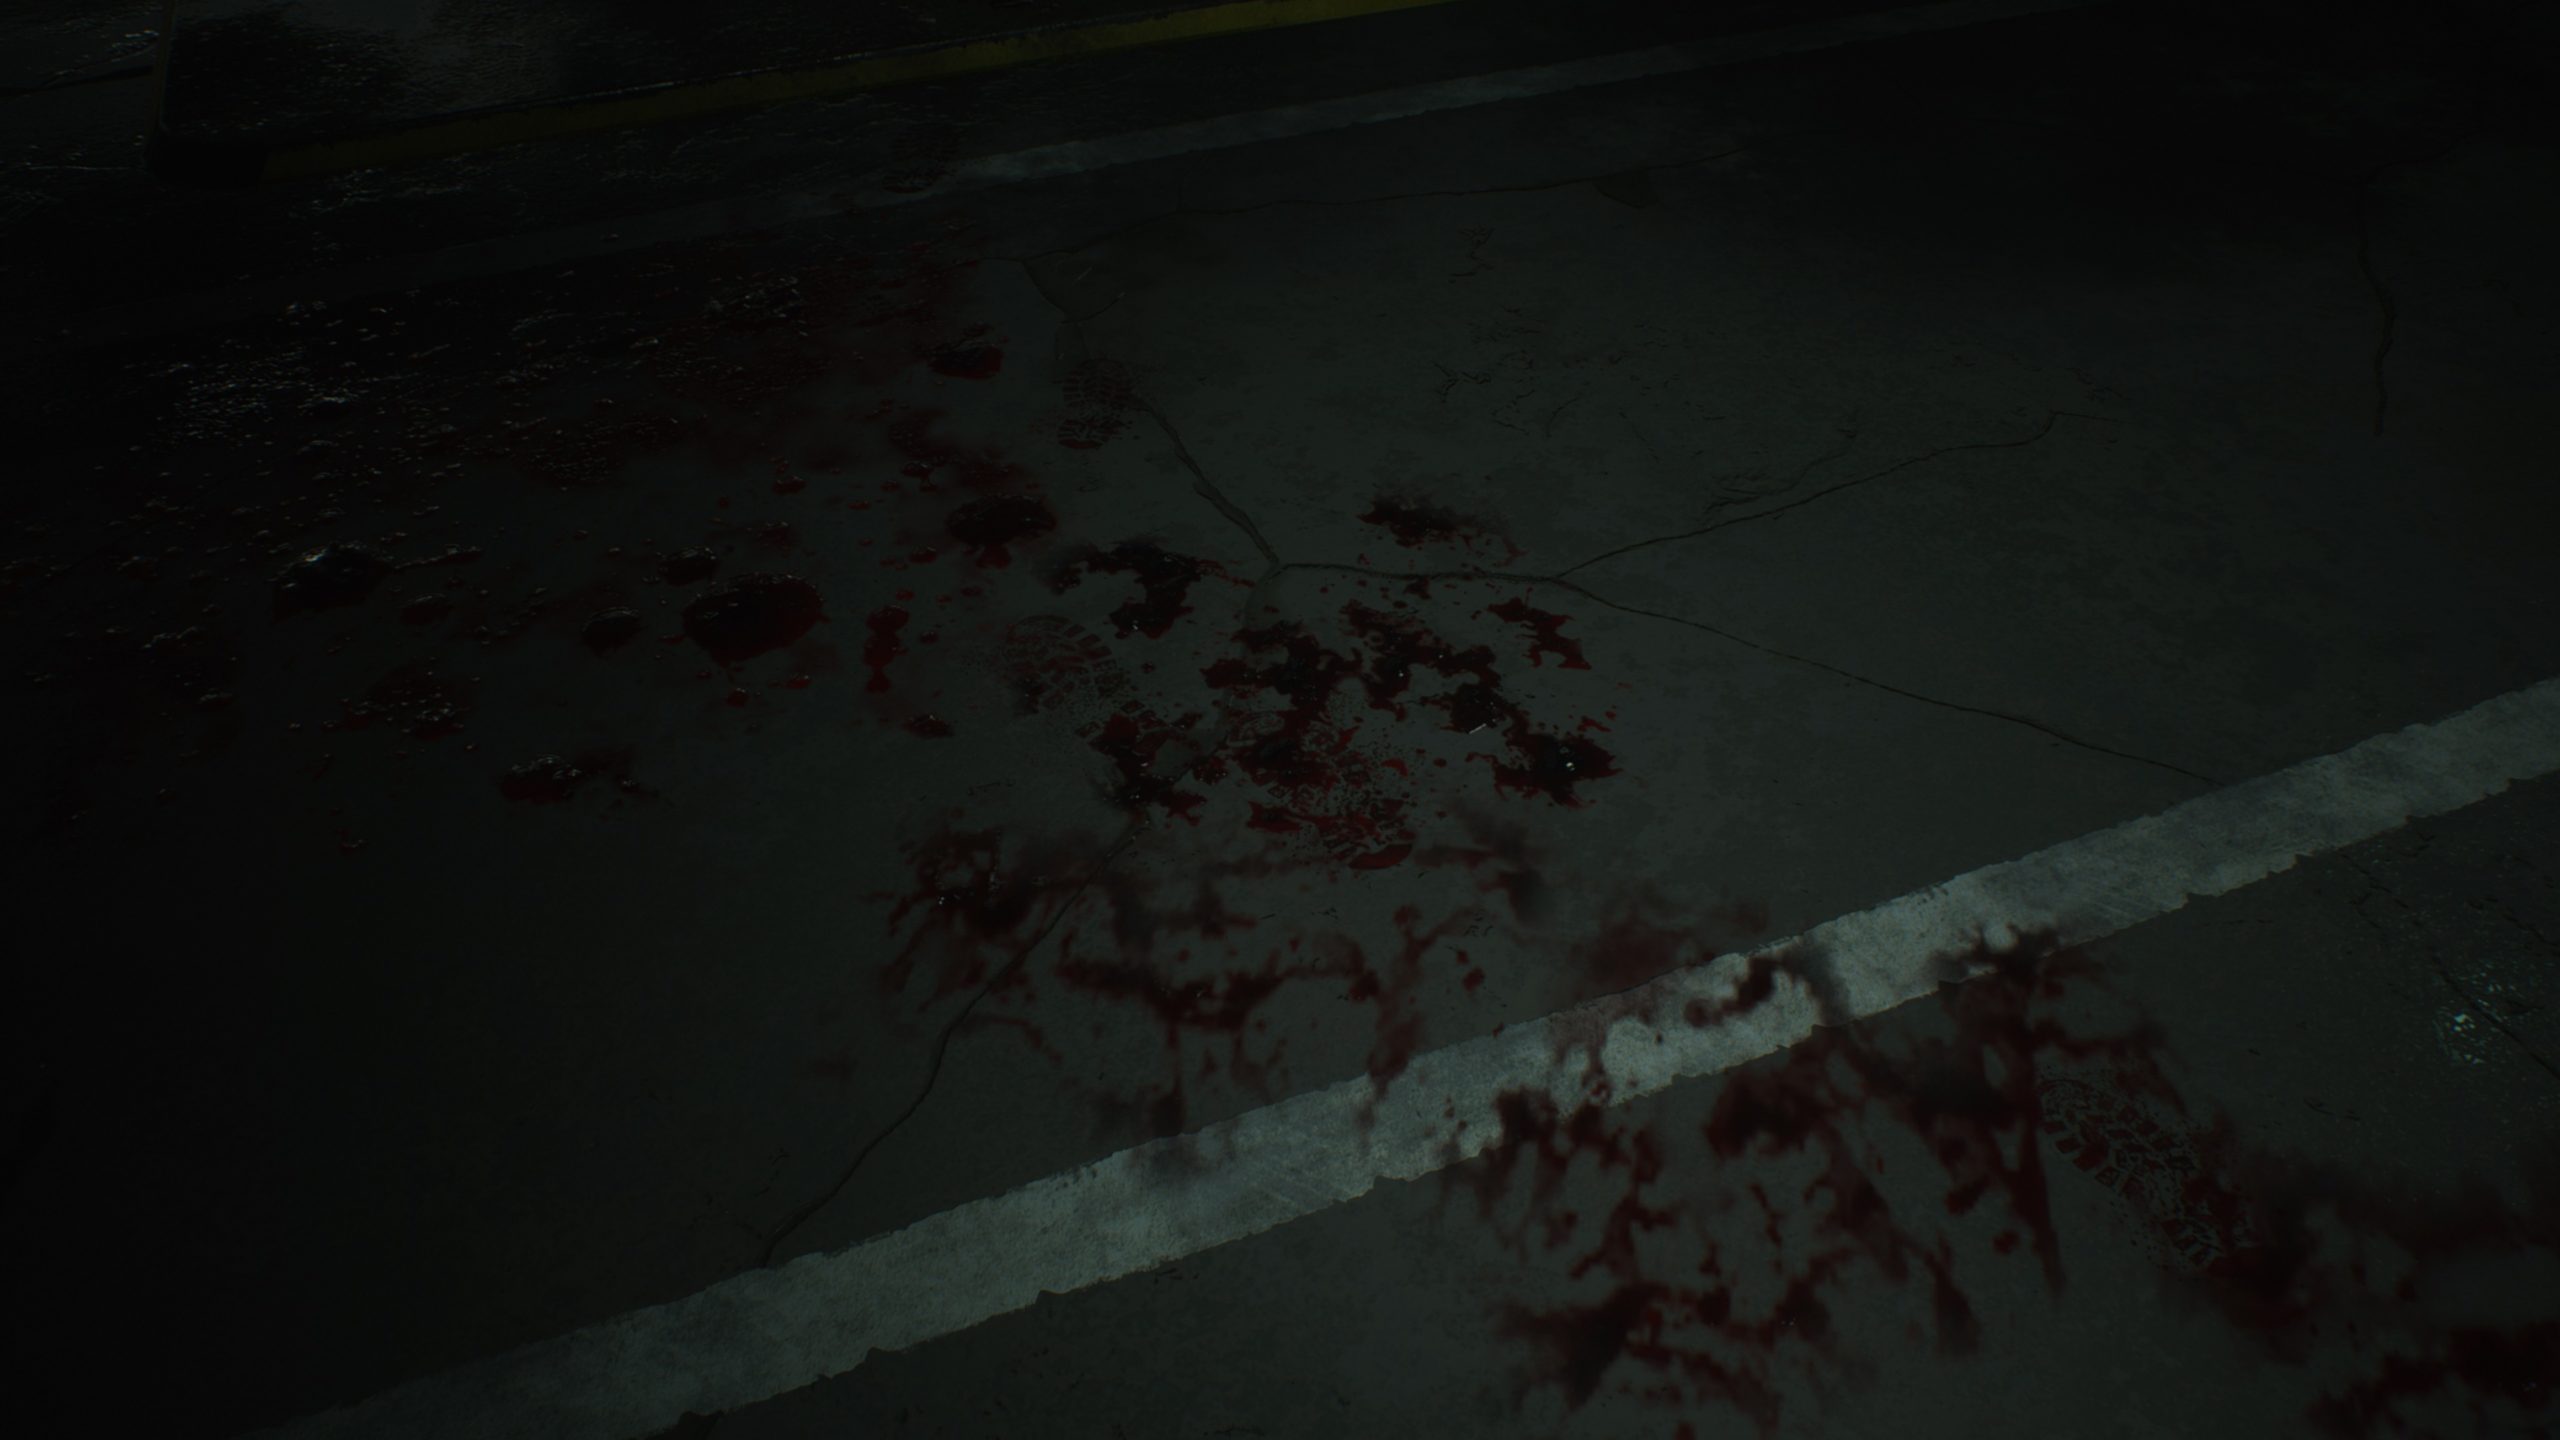
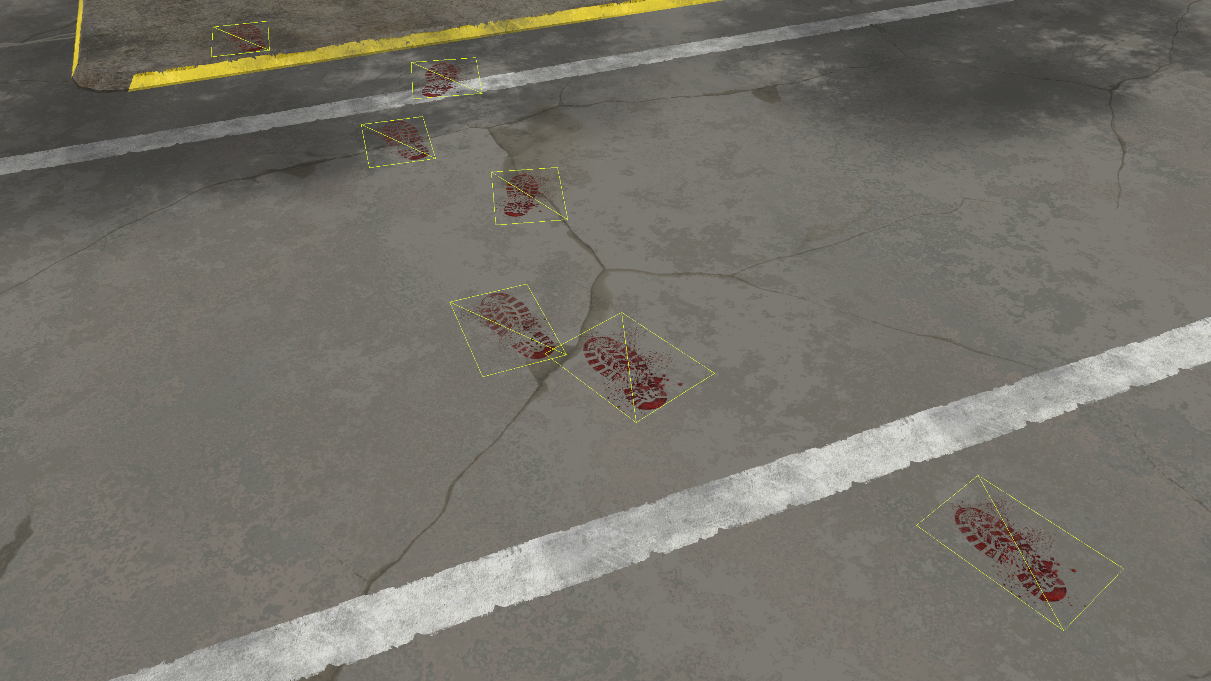
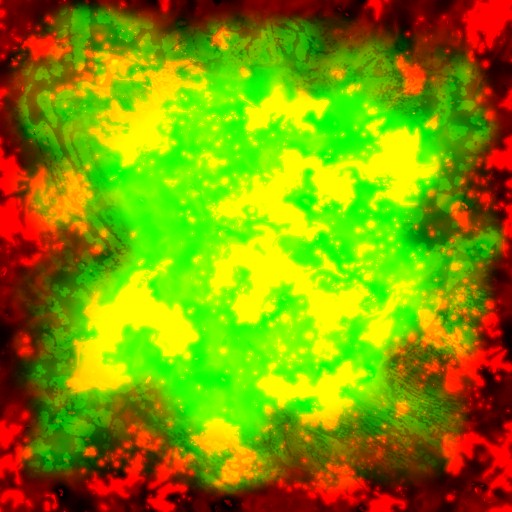
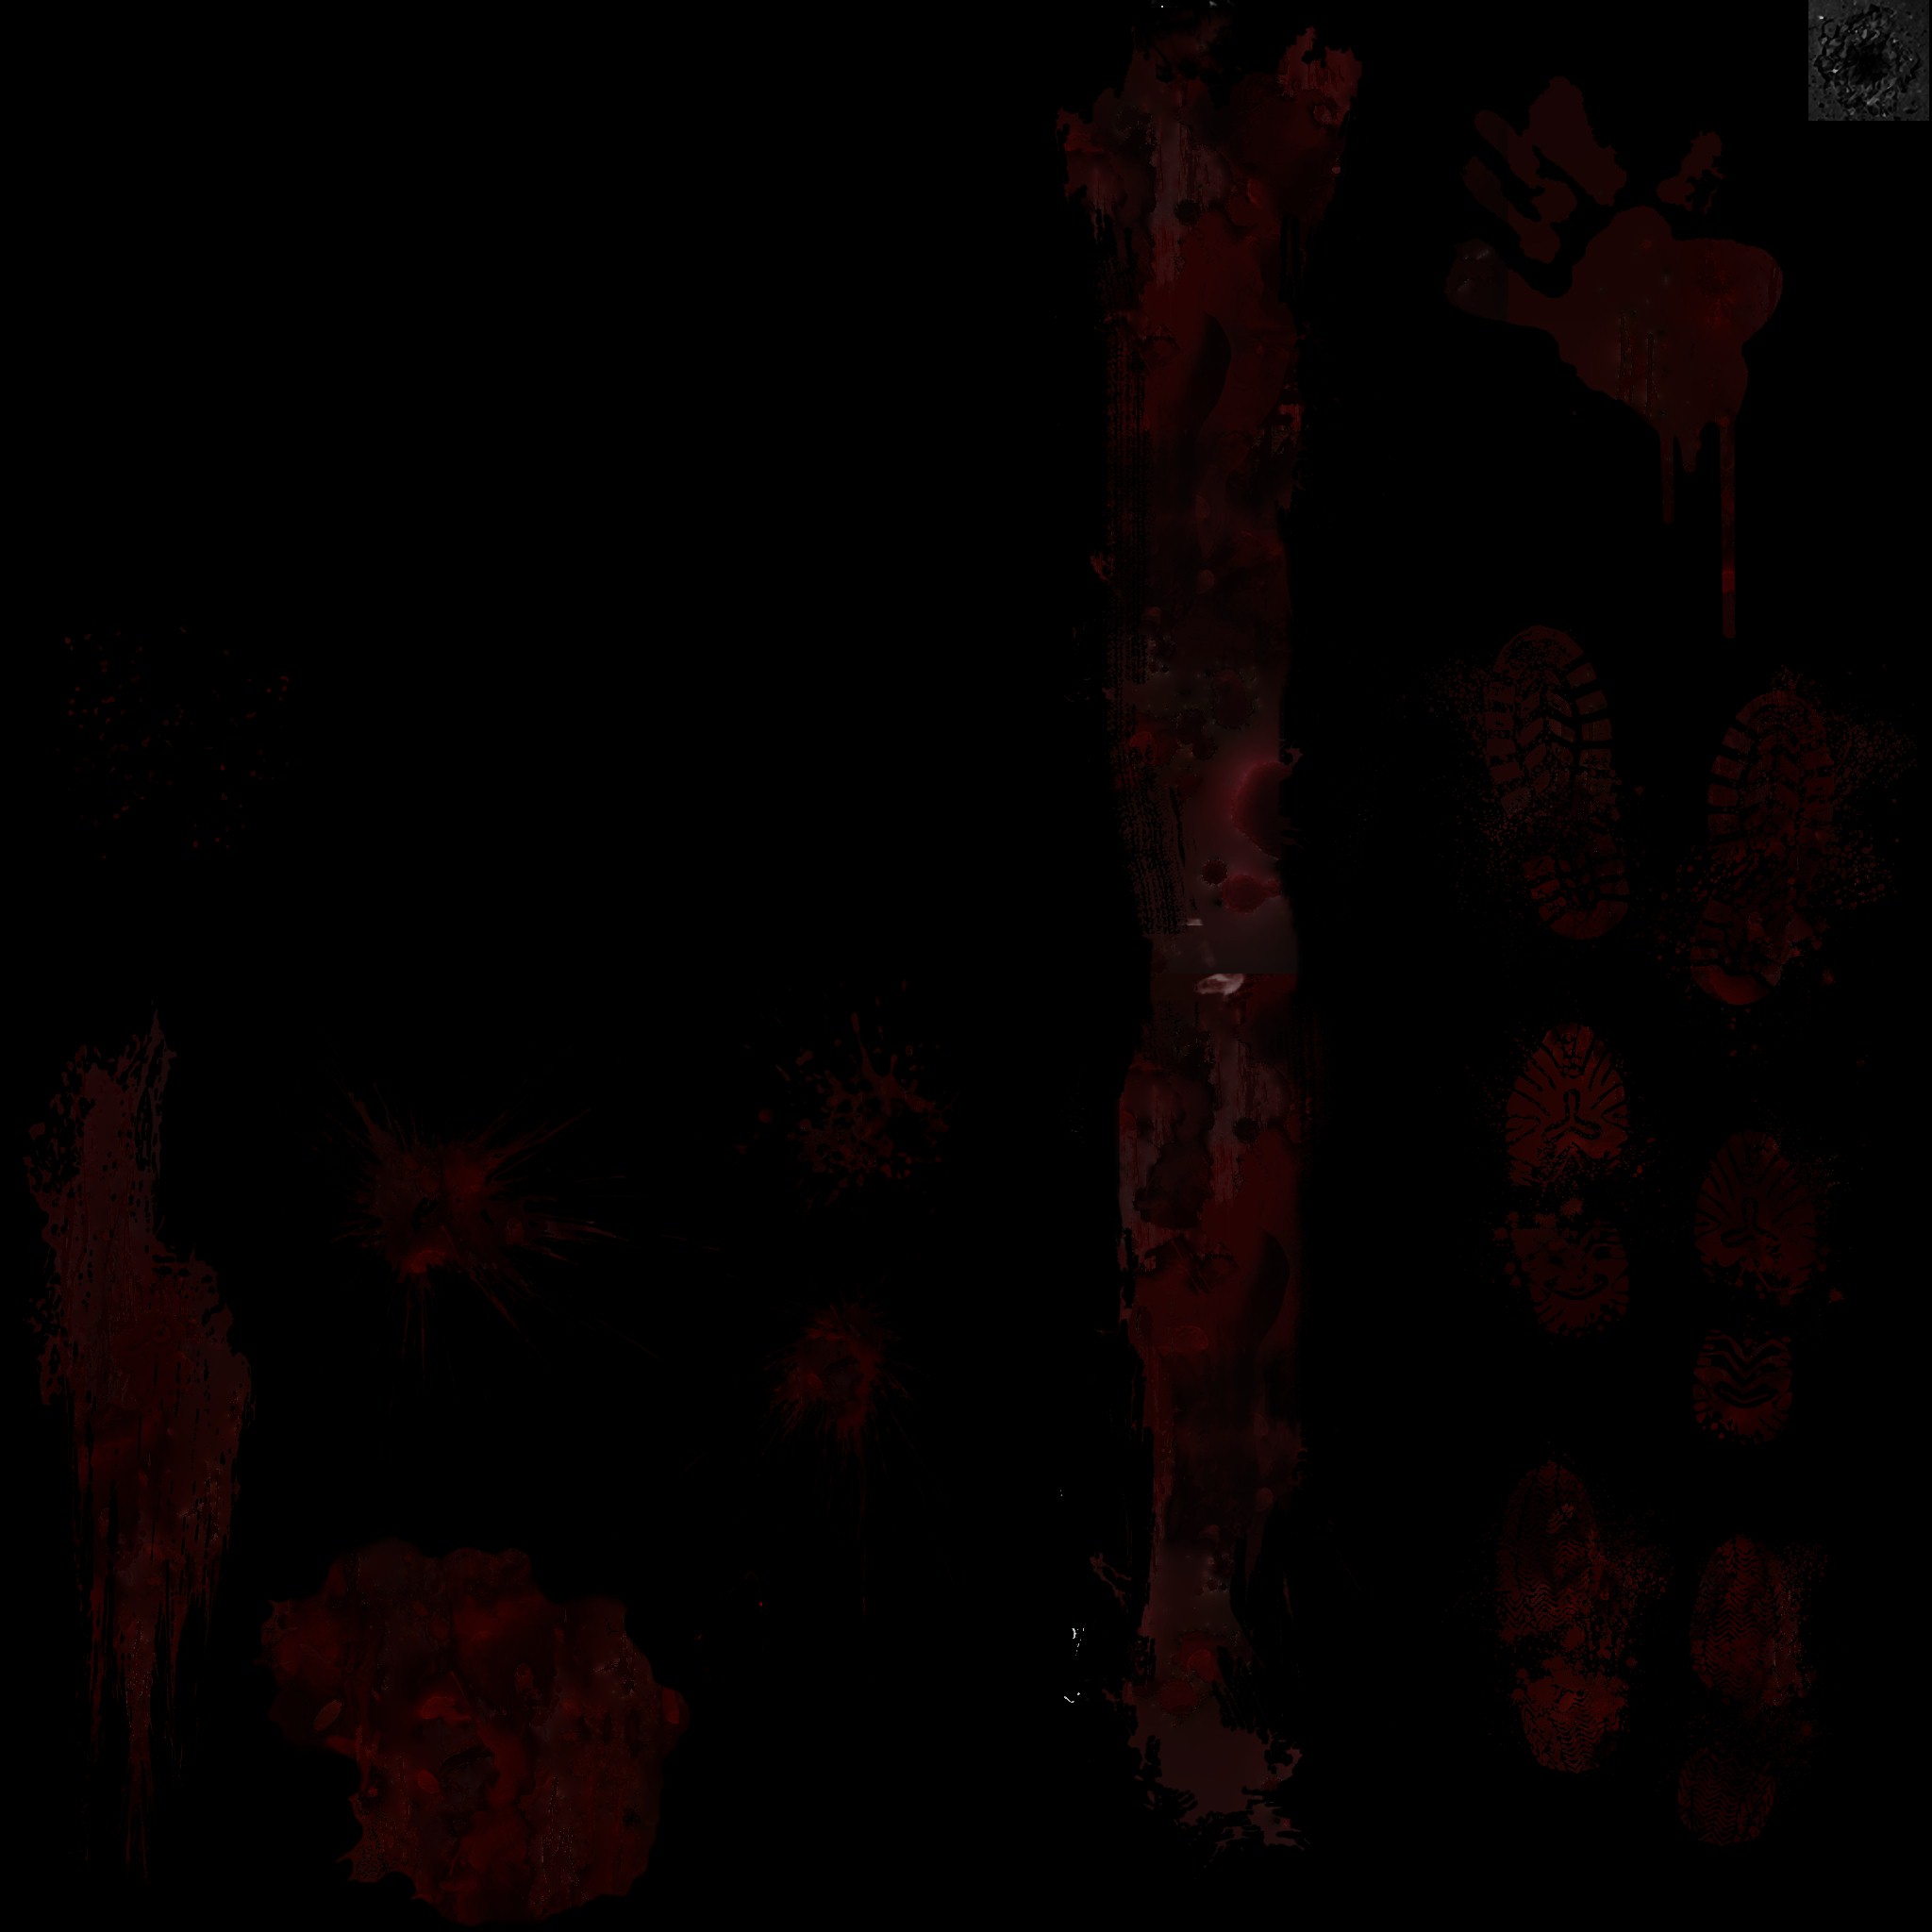
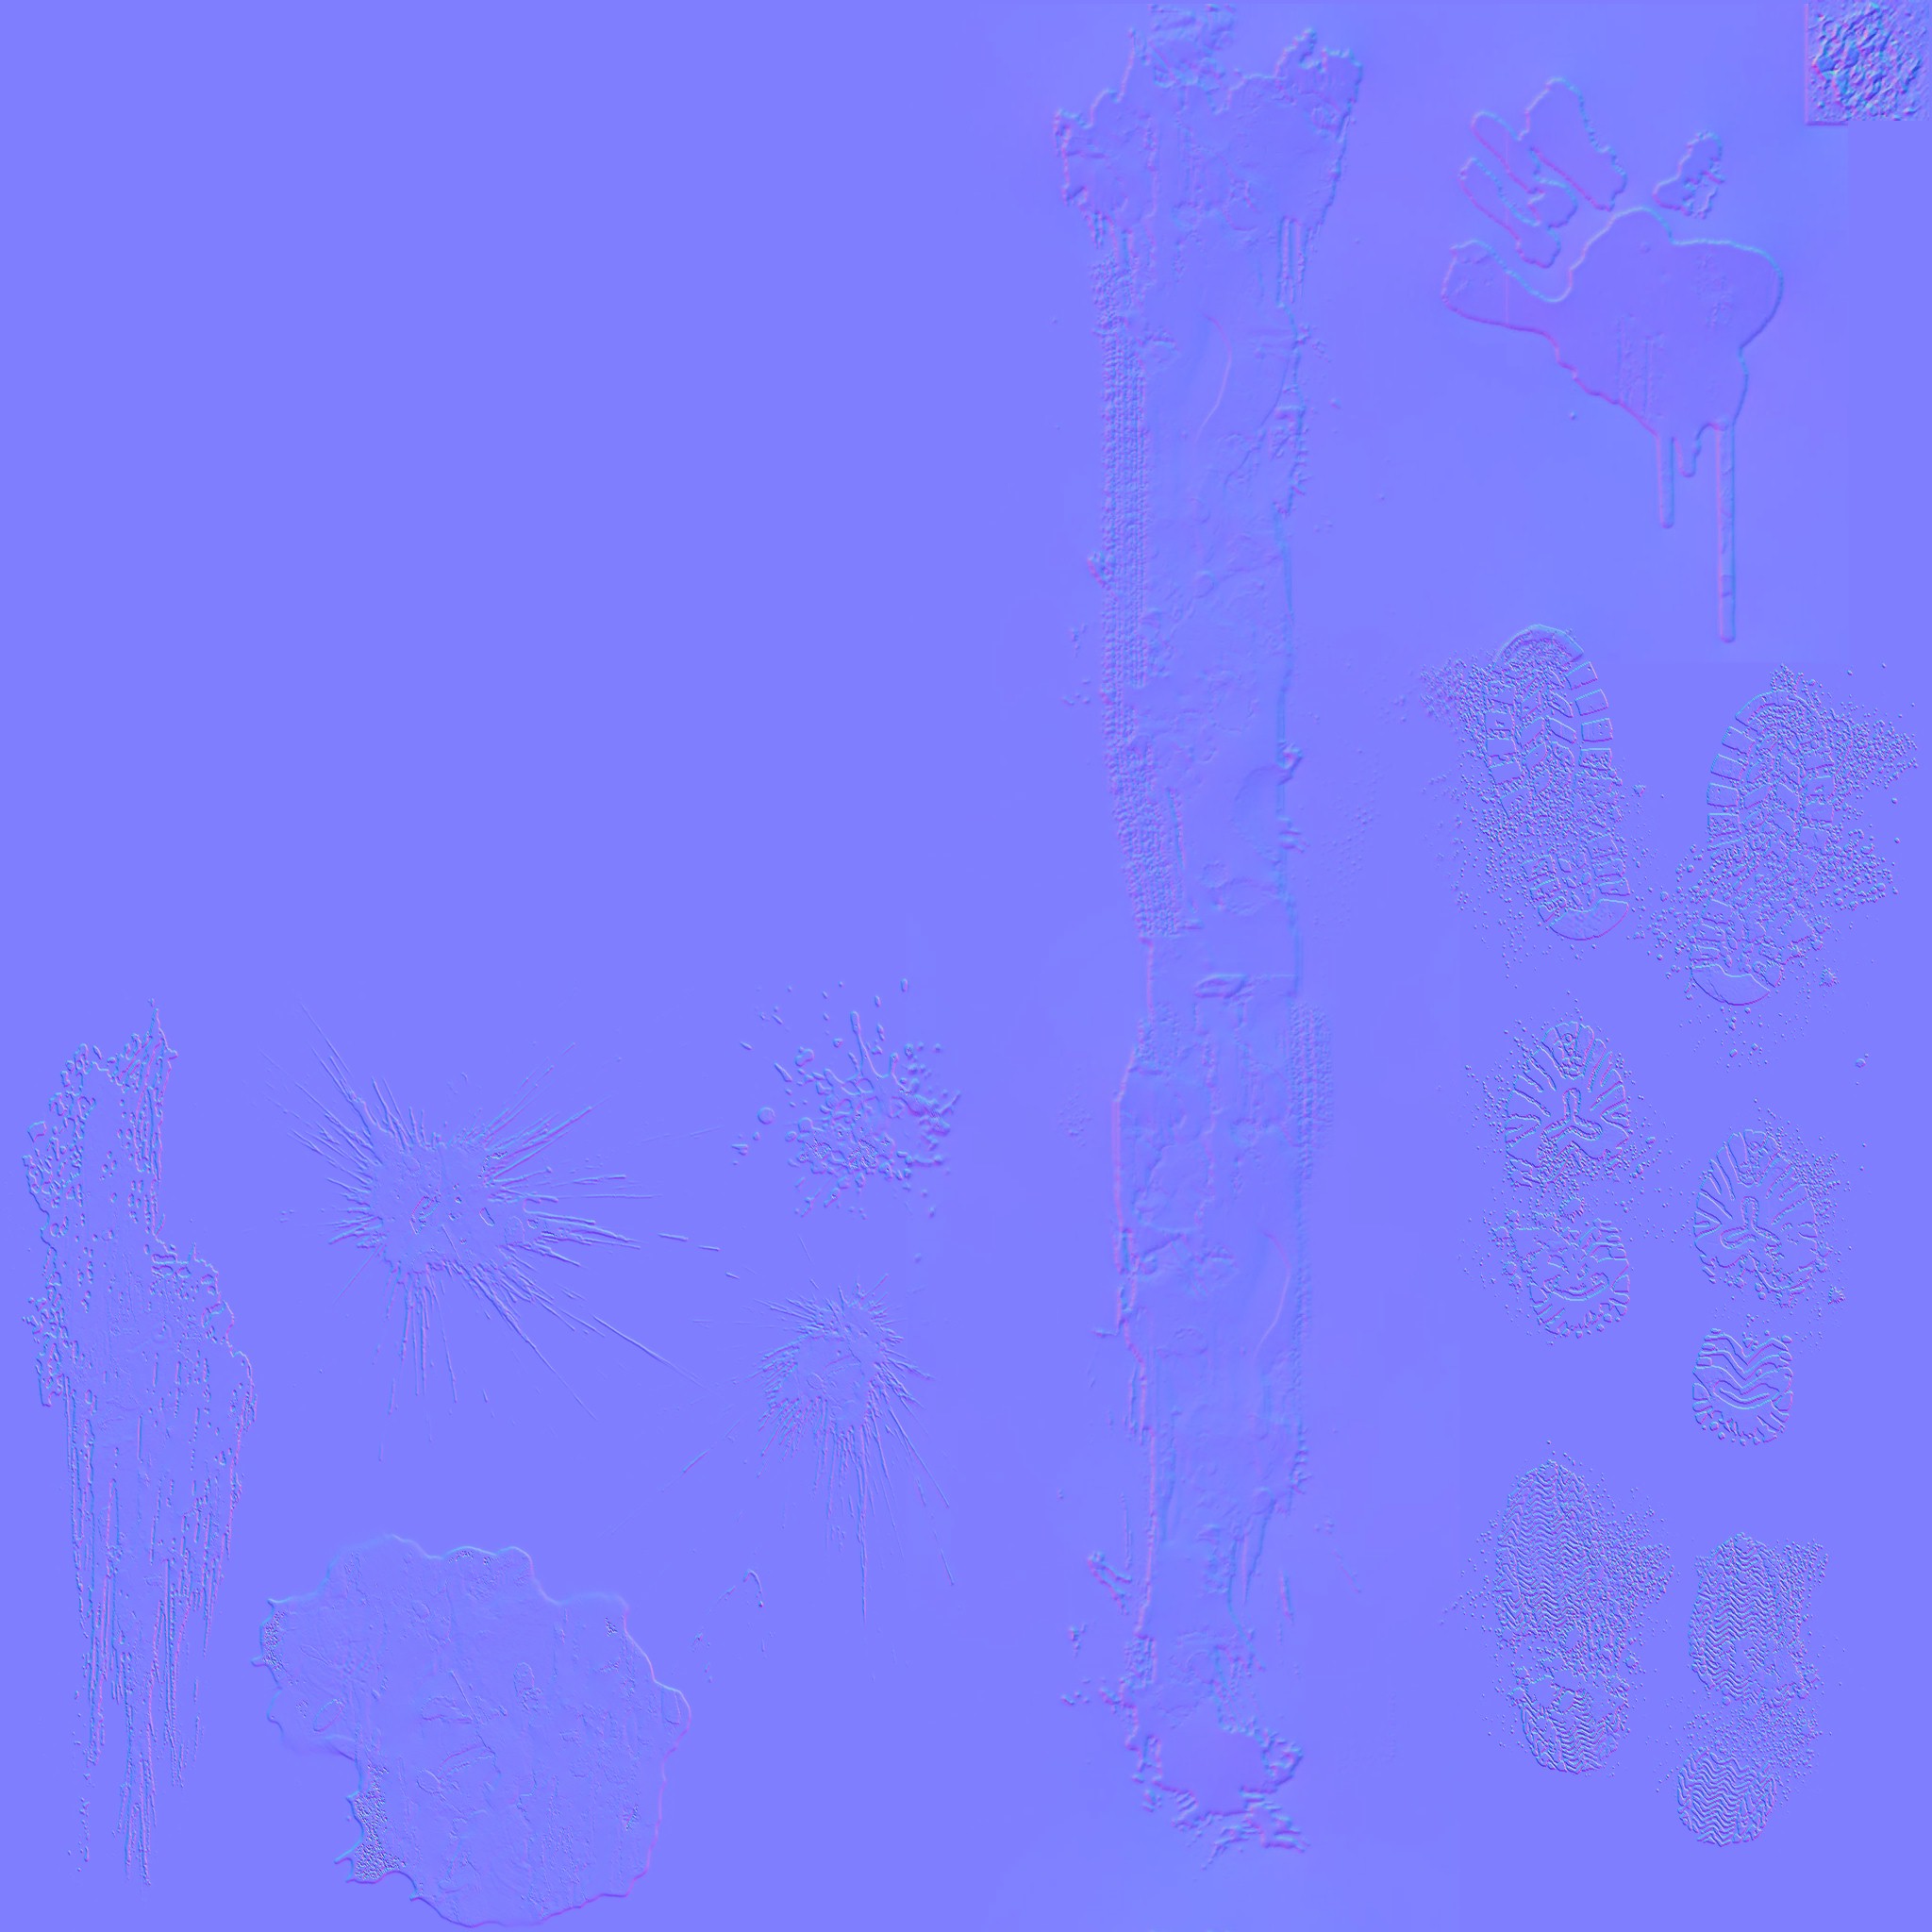
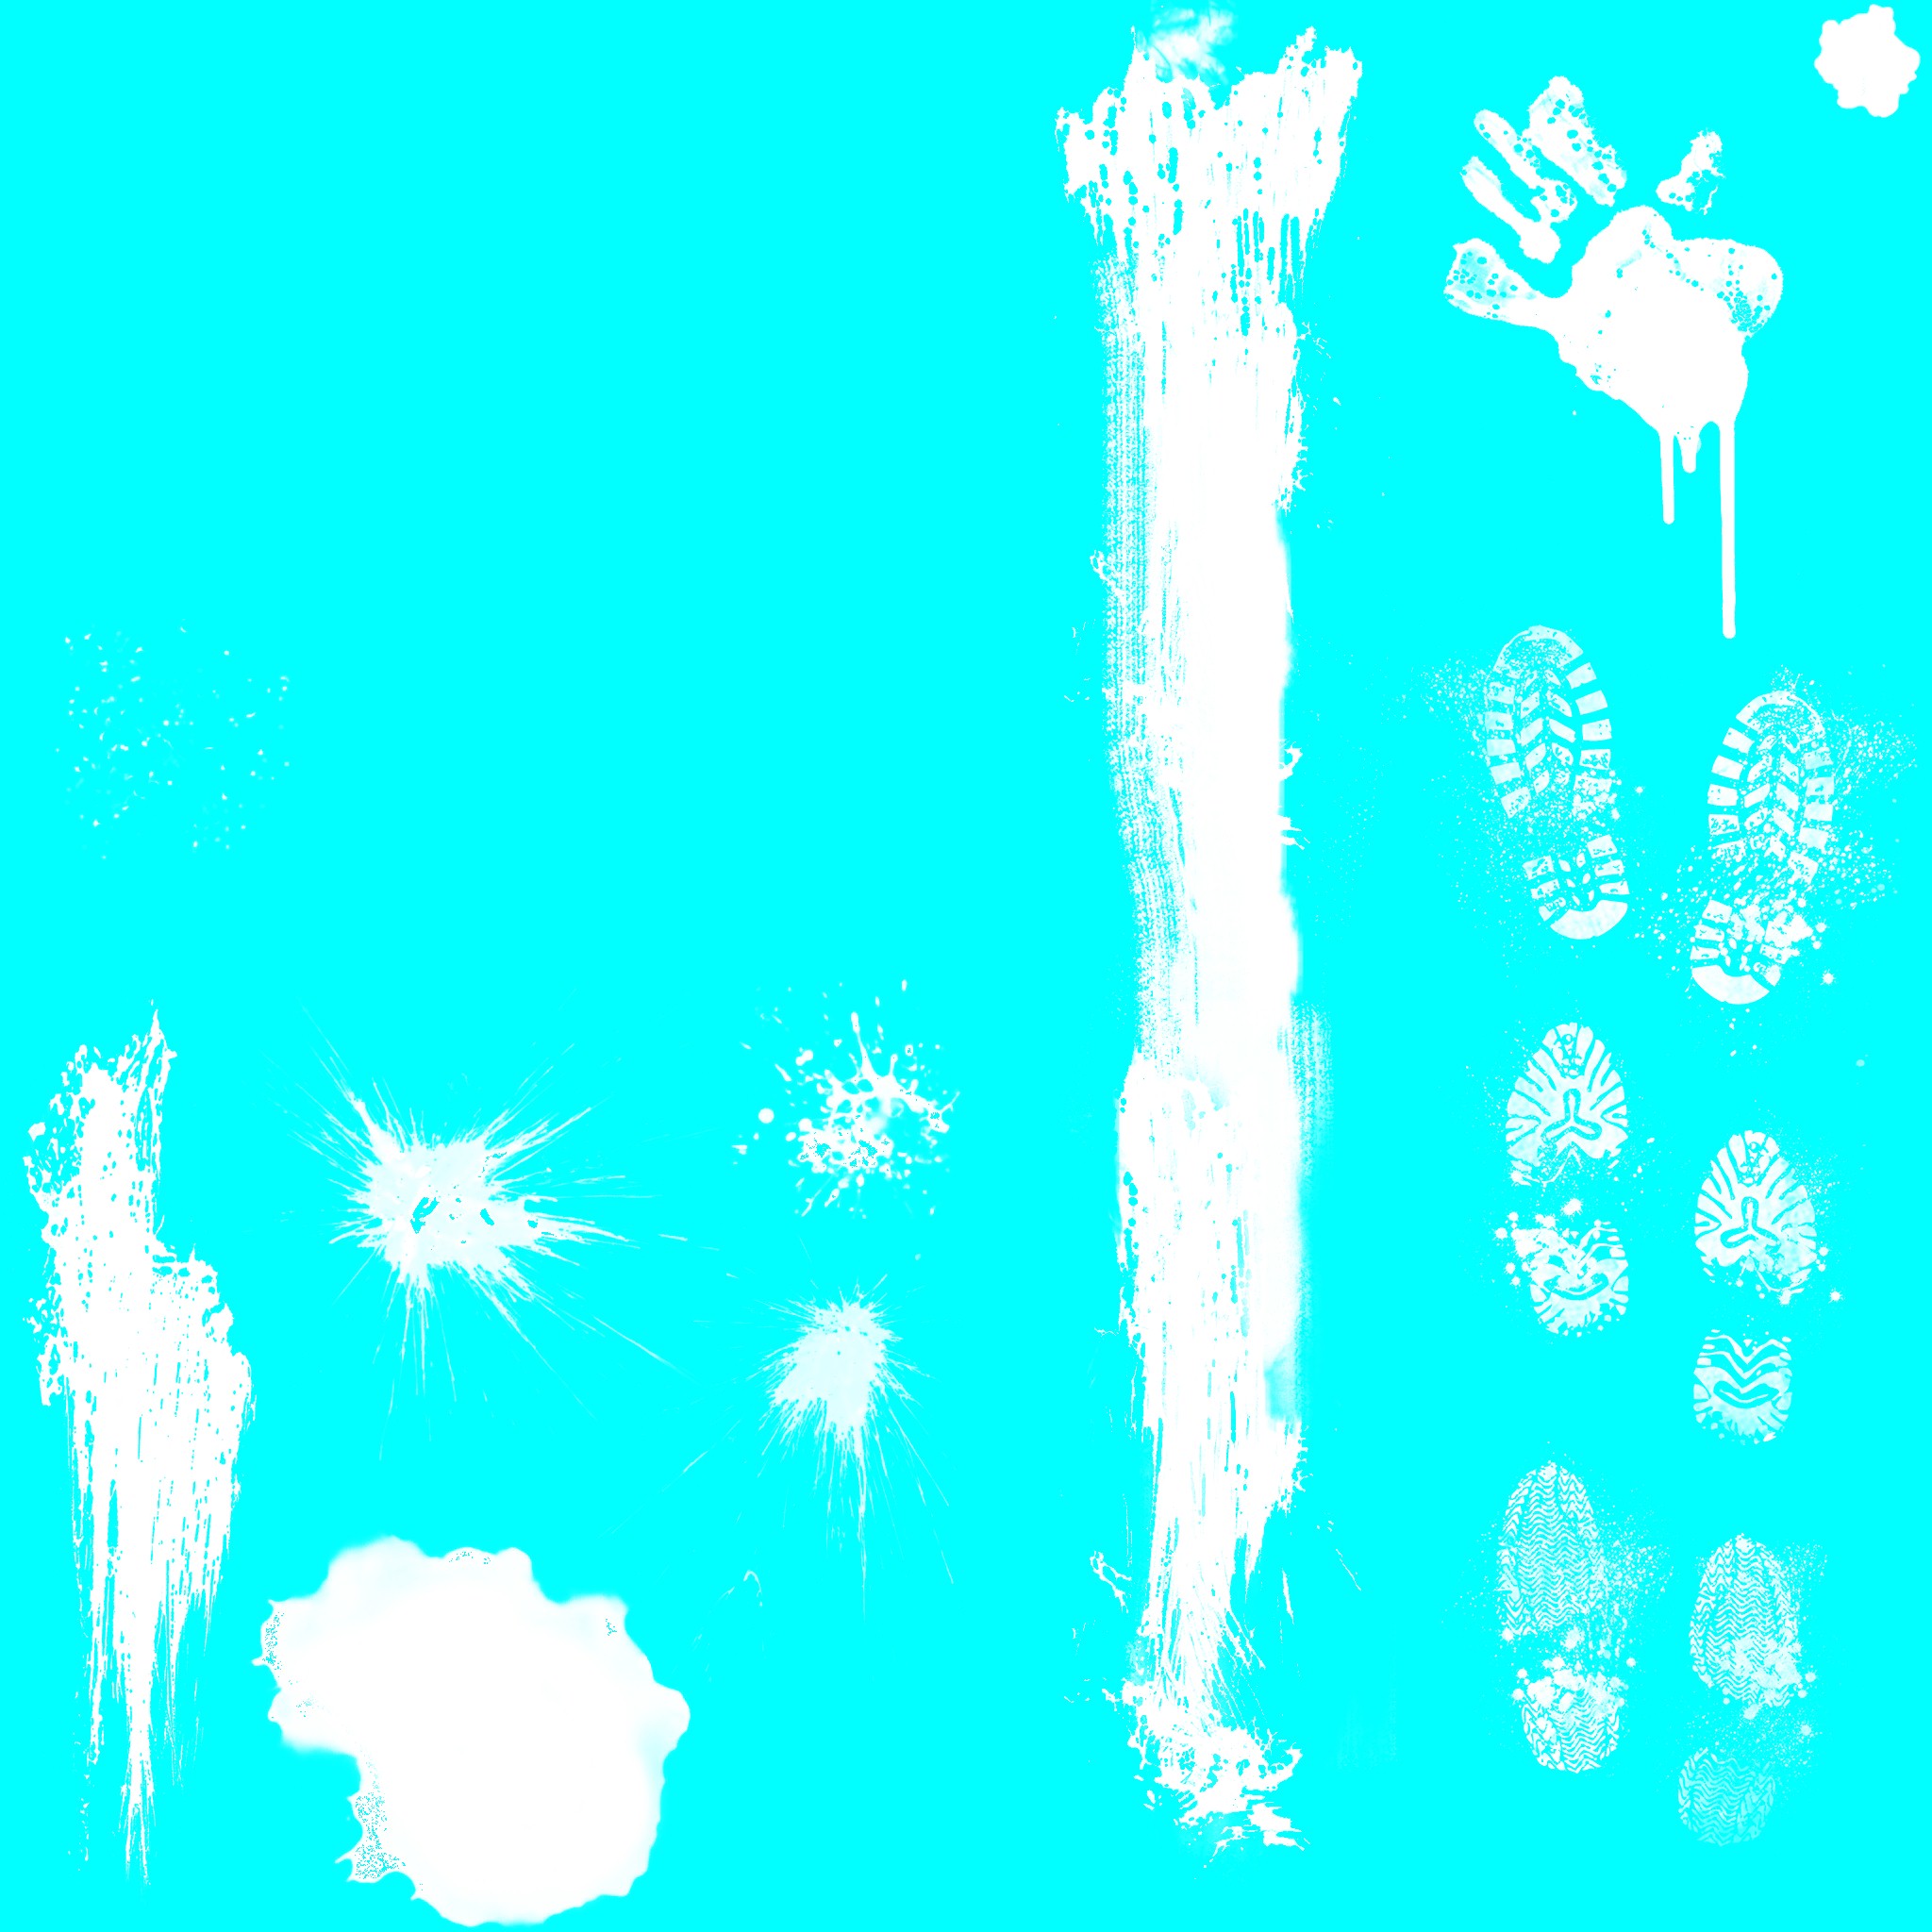
And if you didn’t notice how instancing & batching is doing great job for decals in RE Engine, perhaps more blood and foot steps will be a good evidence. It’s just 2 draws for everything! (much better than something like Elden Ring for example)

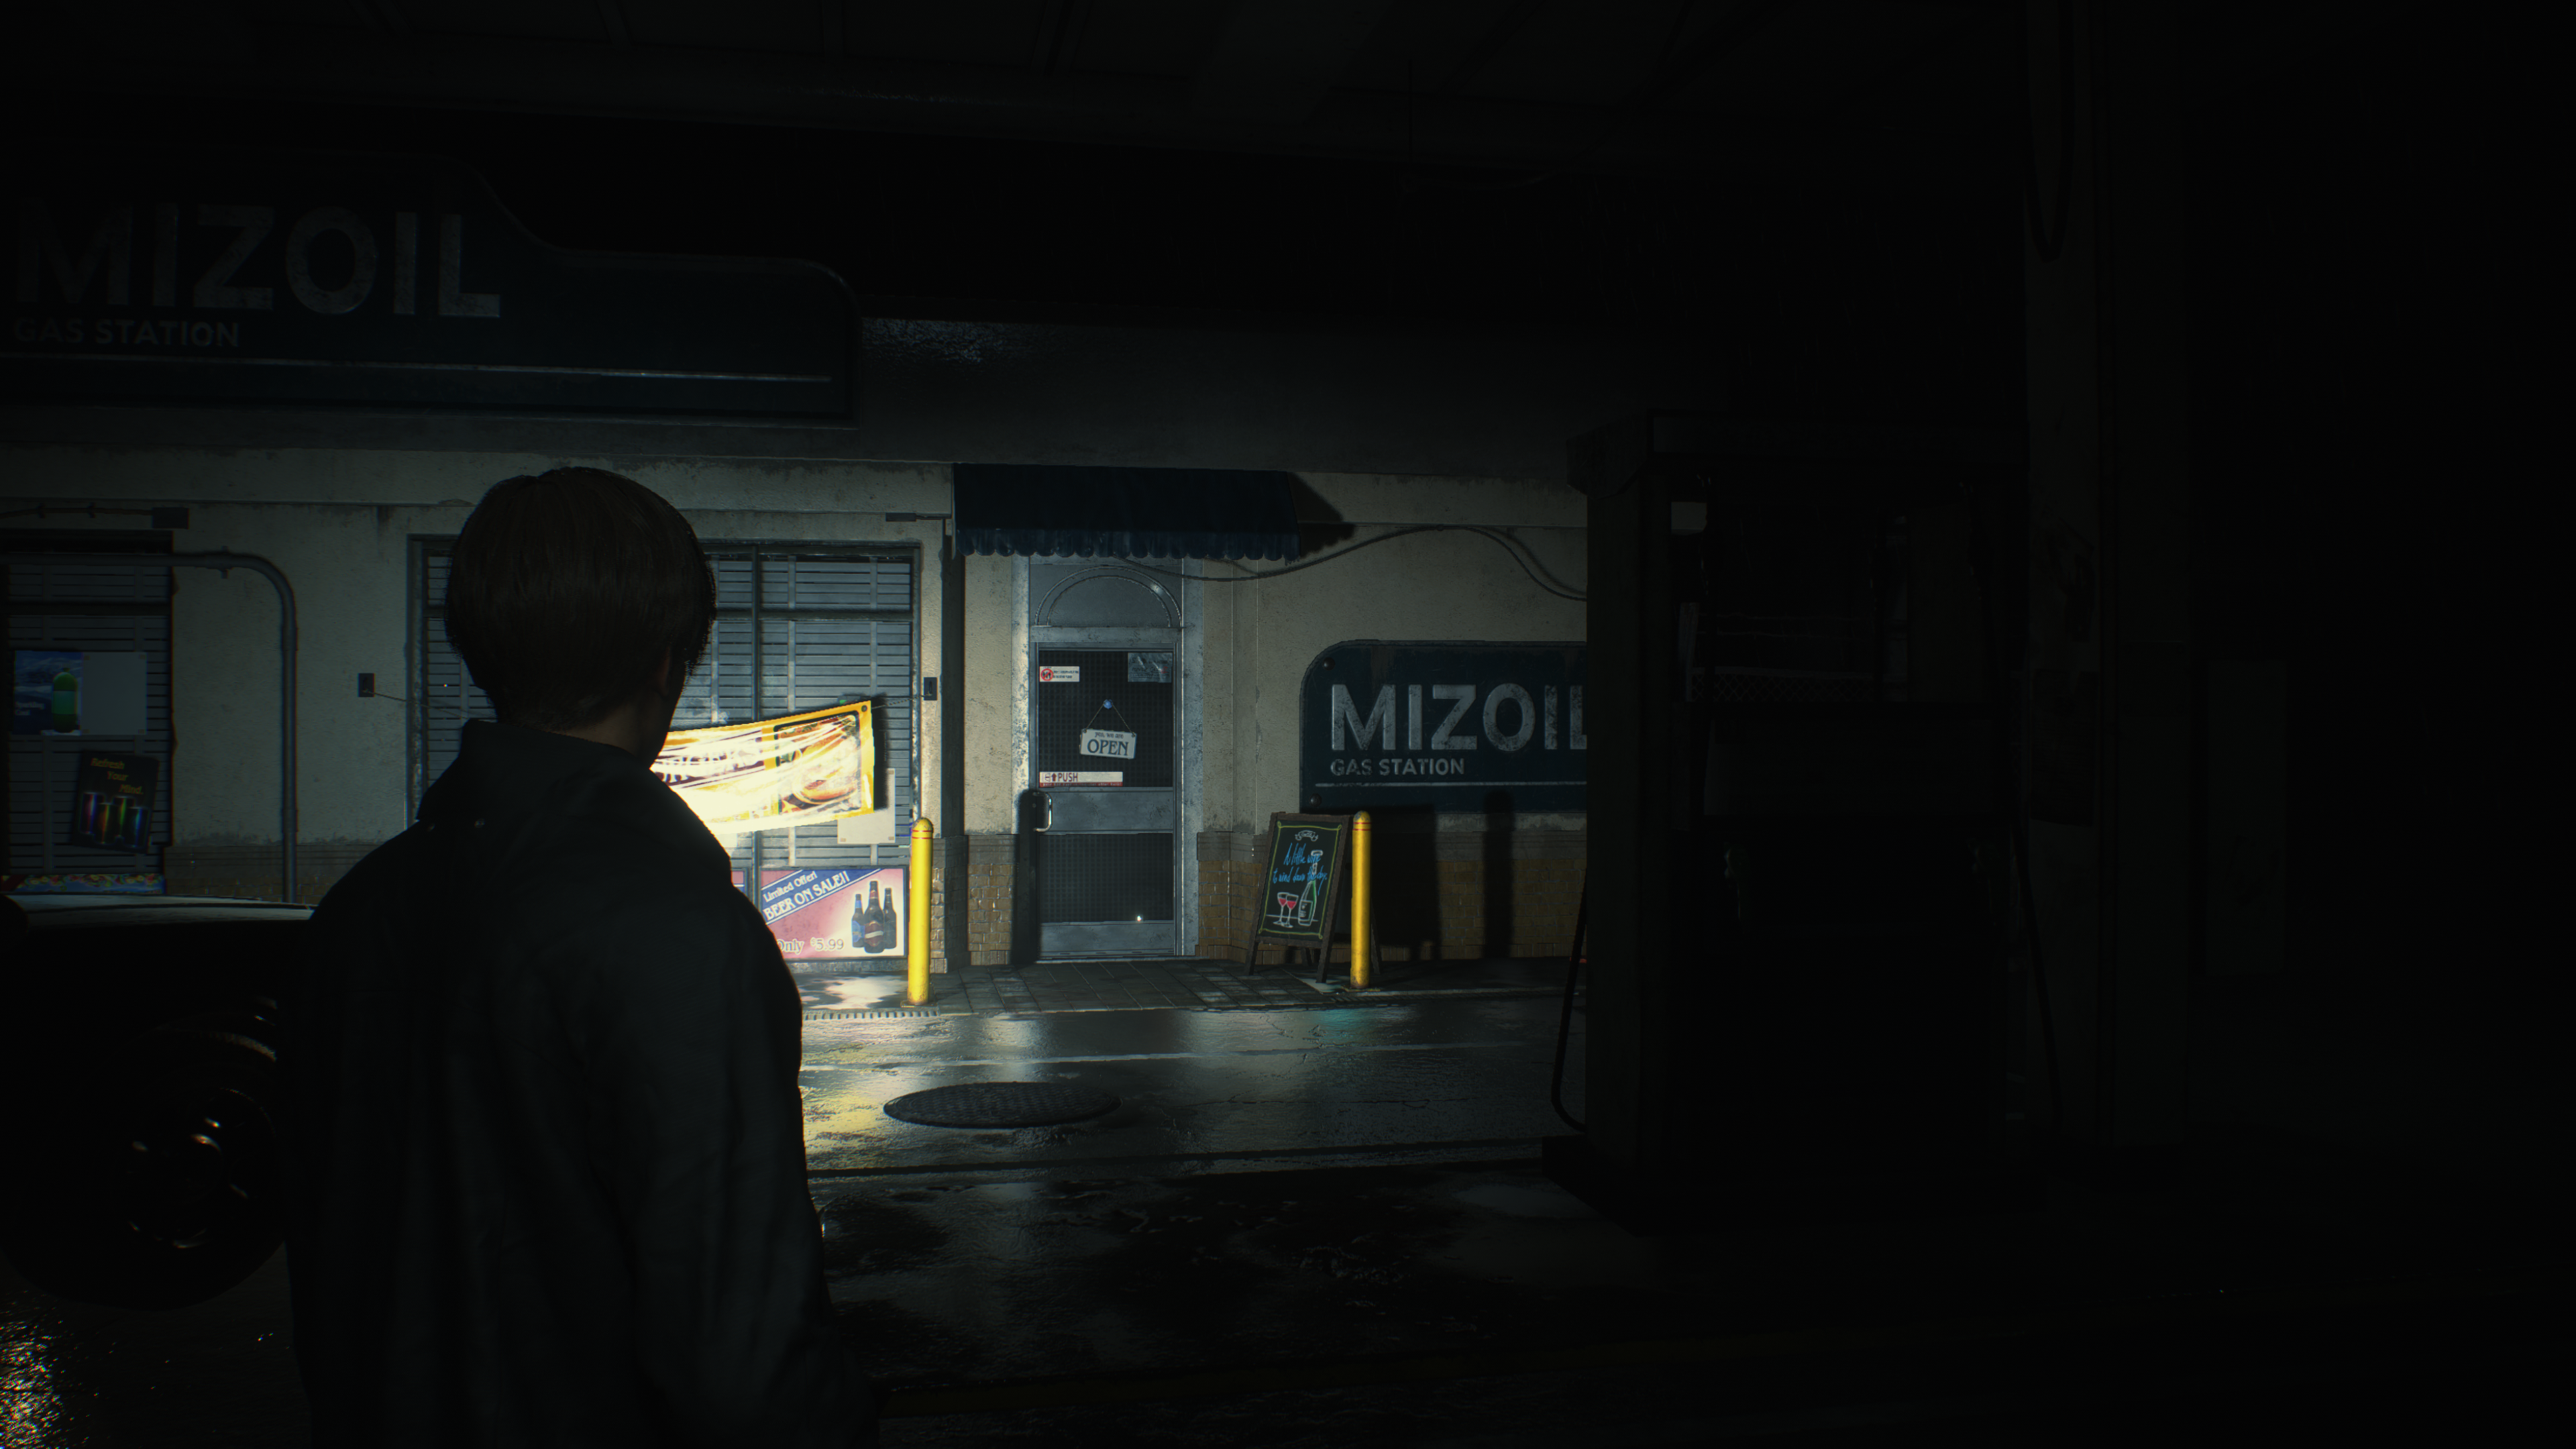
Far Cubemap
A cubemap draw on a plane behind everything in the horizon (bizarre) , that phase is referred to as “CubemapFarPlane2D“. It’s a single draw get’s an IBL2D texture. And because of the fact of being a drawn cubemap texture at the far horizon, won’t see any presence in the frames taking place in an interior area. At the other hand for example for an exterior area frames, it’s very obvious the difference.

Cubemap Setting
struct CubemapSetting
{
	float IBLExposure;
	float IBLRotation;
	float IBLAddblendFactor;
	float IBLYAxisoffset;
	float2 IBL2DTrimmingScale;
	float2 IBL2DTrimmingOffset;
}
Fill Velocity [Compute]
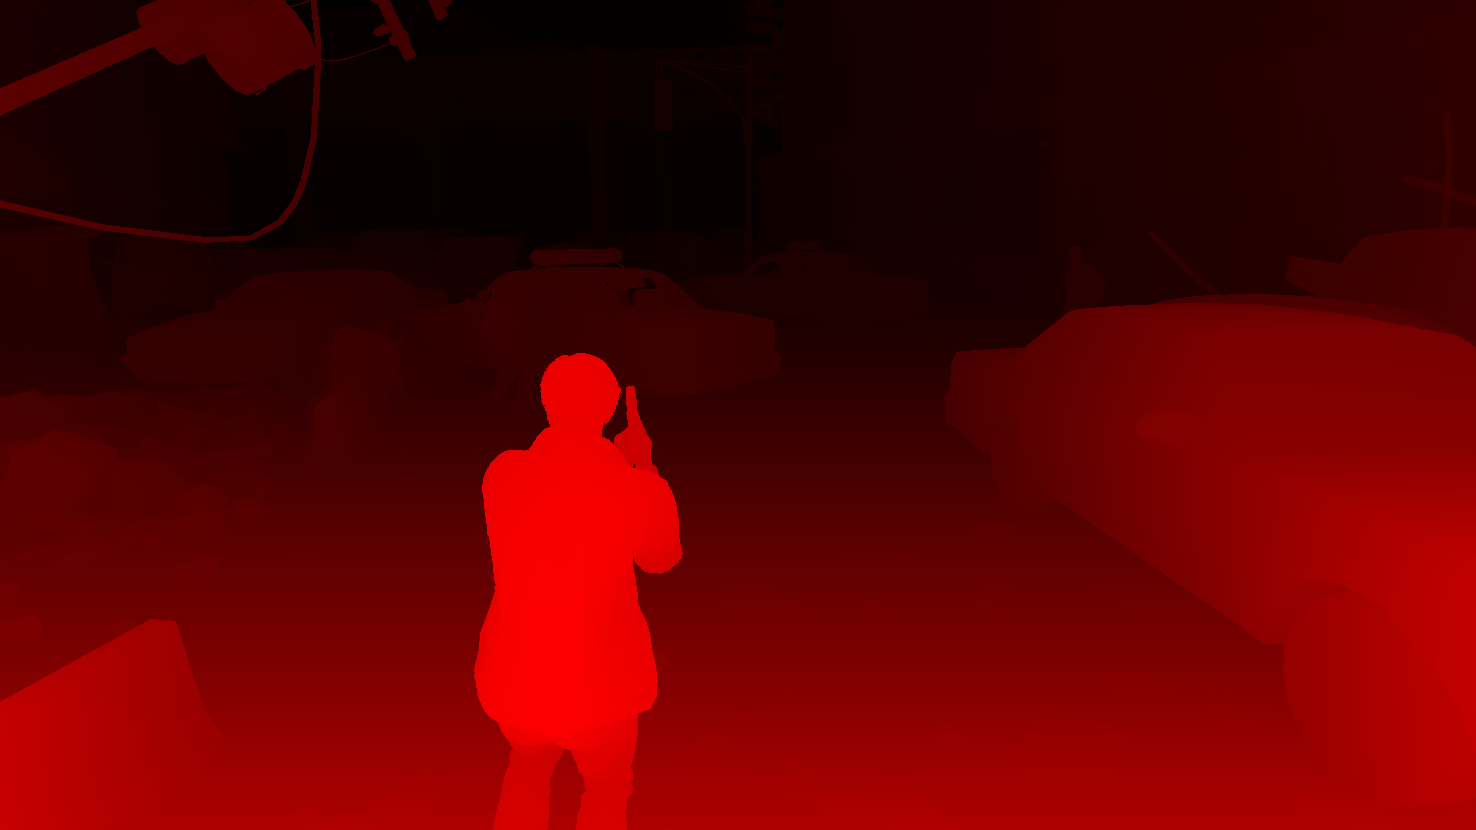
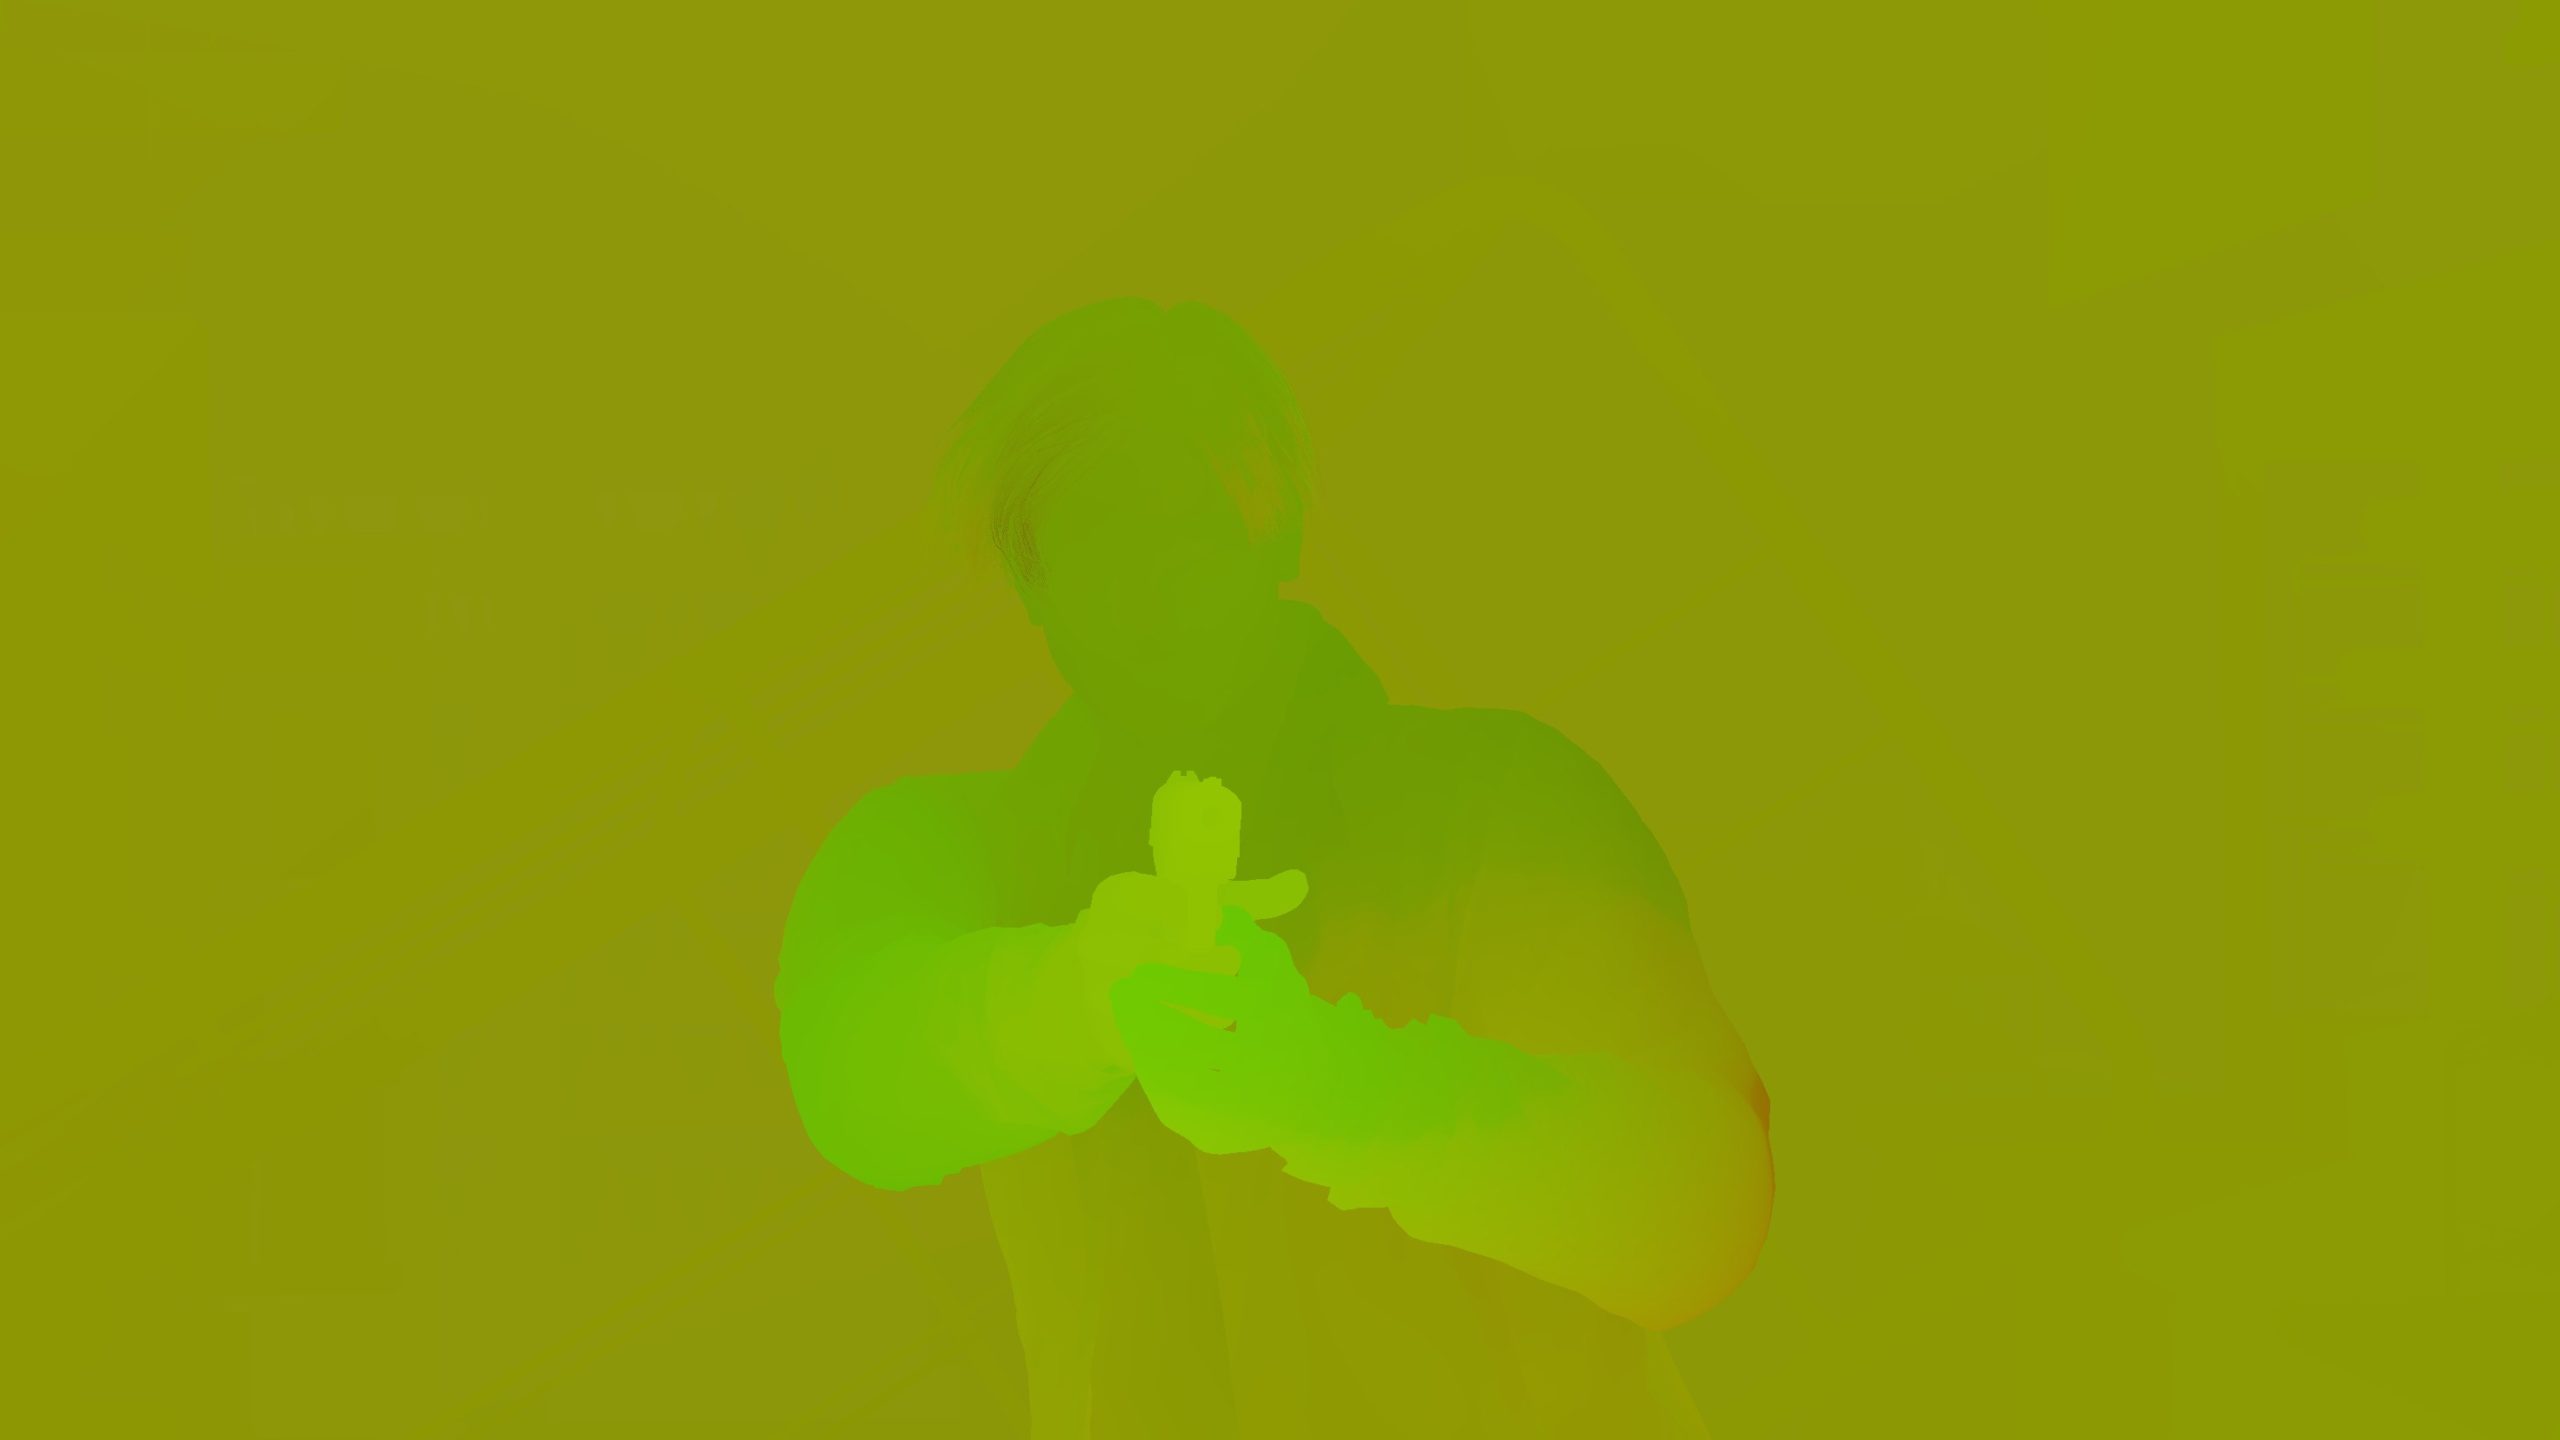
While it is very very important step, and needed not only for Anti-Aliasing, but also anything that requires velocity down the road. Apart from the input & output of this stage, there isn’t clear indication of the process steps or the used params. We just end up with the X & Y velocity values in the R & G channels of the what-so-called VelocityXYAoSss rendertarget of the GBuffer.


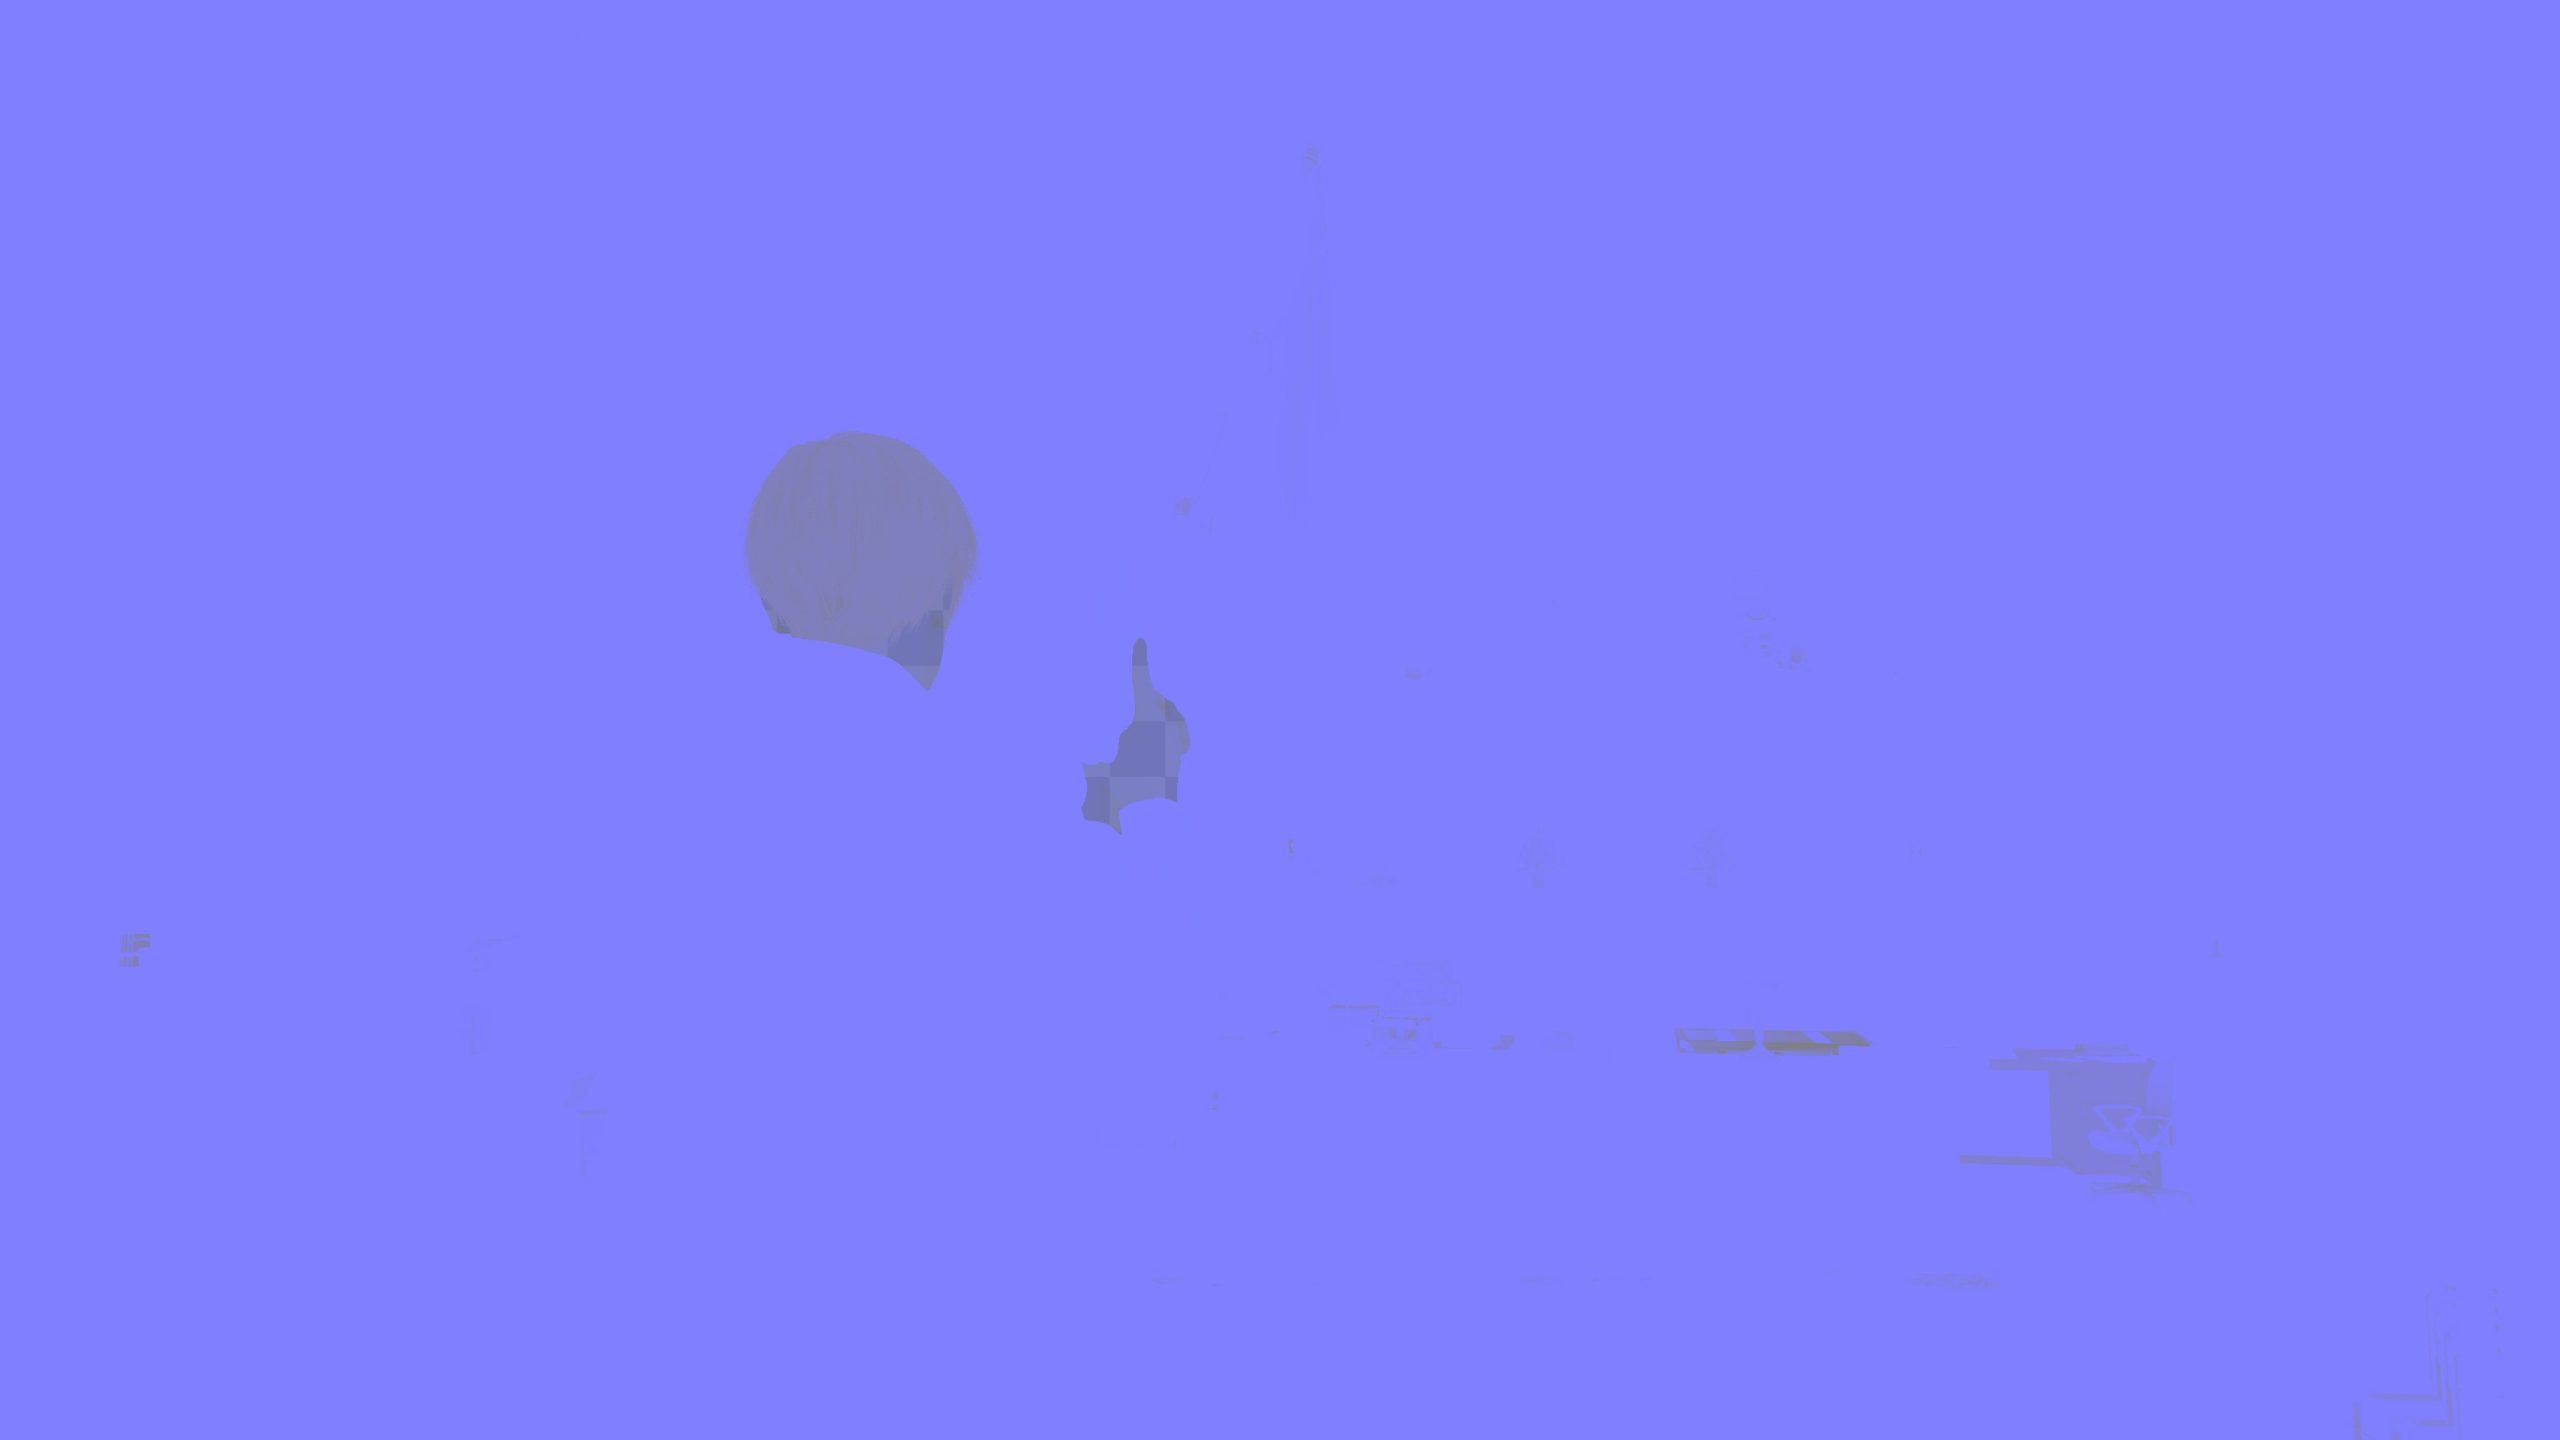

SSSSS [Compute]
Using the Depth + the SSS attribute in materials/shaders, can write to GBuffer, a “mask” to represent the SSS applicable areas (need that mask for later at deferred pass) through a compute of “FastScreenSpaceSubsurfaceScattering“


HI-Z Tracing [Compute] [Not always]
HI-Z Tracing is the method used for the Screen Space Reflections (SSR). Here the engine would generate the HI-Z (Hierarchical-Z buffer) which is needed later down in this page for SSR view generation. This is not always taking place, as SSR itself is not always part of a frame, as explained later that SSR only take place in some areas where (possibly) controlled by SSR volumes or such to define when to trace & render SSR and when to skip.
7 dispatches for that compute, each against one of the mips of the “Linear Depth” that came out from the “Fill Velocity” compute step above. Starting from highest mip level – 1, start takingthe the min or max of the 4 neighboring values from the original Z-buffer, and then keep it in a smaller buffer at 1/2 size
Hi Z Generate Info
struct HiZGenerateInfo
{
	uint2 HiZResolution;
	uint2 HiZOffset;
}
AO
There are multiple ways to deliver AO in RE Engine, something to fit every user! By default there is SSAO (Screen Space Ambient Occlusion), but there is also a limited version of the SSAO called SSAO (Set Areas Only), where the effect is not everywhere all the time. There is also HBAO+ (NVIDIA Horizon Based Ambient Occlusion) as well as CACAO (AMD FidelityFX Combined Adaptive Compute Ambient), and of course there is the option for no AO at all (just disabled). i decided to go further than single configuration (which usually SSAO), and decided to take some captures to take a closer look at each of the 3 main types available in the game in macro details. So we can check the final quality of the different AO methods and there impact on a frame, as well as check some of the workload behind them.

All AO methods doing GREAT job in RE Engine!
HBAO+ (CoarseAO) [Not always]
Only when the AO method is set to HBAO+ (aka CoarseAO).
HBAO+ entirely taking place in fragment shaders invocations, and it happens in a few distinctive steps (6 to be exact)
1 – HBAO Plus Linear Depth
The first step is to convert the depth into linear depth (format change)

2 – Deinterleave Depth
Taking that linear depth from the previous step, and make a 16 slice/cascades version of it

And of course, because the new linear depth is 1/4 and in 16 slices, if put all together, it will be a big image (atlas) that is the same size as the original linear depth.
HBAO Plus Per Pass Constants
struct HBAOPlus_PerPassConstants
{
	float4 f4Jitter;
	float2 f2Offset;
	float fSliceIndex;
	uint uSliceIndex;
}
3 – CoarseAO
AO generation in multiple passes (16 sequential draws) using the normals and the 1/4 res deintereaved depth (with it’s 16 slices), in order to draw the output HBAO jitters in form of slices of the texture. Generation happens with a unique jitter value per pass.
Because the output is 16 slices, so in an atlas view of 4 slices per row, it would look like the atlas below.
CB HBAO
struct cbHBAO
{
	float radius;
	float intencity;
	float nDotVBias;
	float negInvR2;
	float radiusToScreen;
	float aoMultiplier;
	float smallScaleAOAmount;
	float largeScaleAOAmount;
	float blurSharpness;
	float viewDepthThreasholdNegInv;
	float viewDepthThreasholdSharpness;
	float groundAORadiusPixels;
	float2 invQuarterResolution;
	float viewDepthThresholdNegInv;
	float viewDepthThresholdSharpness;
	float2 UVToViewA;
	float2 UVToViewB;
}
4 – Reinterleave AO
Using the Linear Depth we had originally at the first step of the HBAO+, with the help of the AO output we got from the previous step, we can end up with the what so called “AO Depth Texture” rendertarget.
The AO is only occupy the R channel only.

Also as you might’ve noticed that the output here is a rendertarget made of 16 slices, but only the first slice is occupied, and other 15 slices are filled in black. Which is not good, and it is an area of improvement.
5 – Blur X
Taking the AO Depth Texture, a blurring pass on the X axis takes place

Same case here, not only regarding making use of single channel, but also the rendertarget resulted by Blur X is made of 16 slices, but only the first slice is occupied, and other 15 slices are filled in black. Which is not good as well.
6 – Blur Y
In the last step, blurring takes place on the Y axis, and finally adding the AO (R channel) to one of the accompanied rendertargets of the GBuffer, which i referred to earlier as VelocityXYAoSss (in it’s B channel)

So basically, to make is clear what does the last few steps are exactly doing without the needless fancy colors, it’s something like that
SSAO [Compute] [Not always]
Only when the AO method is set to SSAO.
SSAO is yet RE’s least AO method in terms of computing and steps, it is done through through 3 distinctive steps that is all taking place in compute.
1 – Interleave Normal Depth
The 1st step takes the Depth + the NormalXY & generate the “Compressed Depth Normal” or “Normal-Depth Map” rendertarget, names could vary regarding where you learn it! This is basically “view space” normals & depth values for each pixel is drawn to that new rendertarget.

2 – Interleave SSAO
The SSAO shader itself. It calculates an “ambient access value” for every pixel (AO Image), so it can be used later for the lighting calculation.
SAO AO
struct SAO_AO
{
	float4 projInfo;
	float projScale;
	float radius;
	float radius2;
	float bias;
	float intensity;
	float aoIntensity;
	float SSAO_SDFLength;
	float SSAO_SDFSoftness;
	float SSAO_Contrast;
	float[] _padding;     //3
}
3 – Interleave Resolve
Same as HBAO+, we do scale & blurring at this step, because as you noticed we used several samples (the 4*4 from 1st step), which resulting in a little noisy AO Image. This could be solved earlier by taking more samples, but it’s not wise choice, it’s cheaper to take less samples, and then blurring than taking twice the samples count.
And of course, after doing do, composite that AO Image into the B channel of a rendertarget that is already accompanied with the GBuffer…the VelocityXYAoSss.


So basically, also without the fancy colors, this is the in & out of that last step (blurring the ugly AO Image)
CACAO [Compute] [Not always]
Only when the AO method is set to CACAO.
CACAO is quite a process, it takes a fairly large number of steps compared to the previous 2 methods. And it is entirely taking place in compute.
1 – Prepare Downsampled Depths And Mips
2 – Prepare Downsampled Normals From Input Normals


3 – Generate Q3 Base
This step run 4 times, once per jitter slice in order to generate the AO importance.


4 – Generate Importance Map

5 – Postprocess Importance Map A

6 – Postprocess Importance Map B

7 – Edge Sensitive Blur 1 (Generate Q3)
This step run 4 times, once per jitter slice in order to generate the Edge Sensitive Blur.

8 – Edge Sensitive Blur 2
Just as the previous step, this step run 4 times as well to do almost the exact same thing.

9 – Upscale Bilateral 5×5 Smart


i like how consistent it is…RE always end up storing the AO in the VelocityXYAoSss’s B channel regardless the used AO method!! Tidy, Consistent & Cool!
There is only one buffer/struct of params passed around to all dispatches across the entire process. Ironically the CACAO’s constant buffer referred to as SSAOConstantBuffer where the struct name itself is CACAOConsts!
SSAO Constants Buffer
struct g_CACAOConsts
{
	float2 DepthUnpackConsts;
	float2 CameraTanHalfFOV;
	float2 NDCToViewMul;
	float2 NDCToViewAdd;
	float2 DepthBufferUVToViewMul;
	float2 DepthBufferUVToViewAdd;
	float EffectRadius;
	float EffectShadowStrength;
	float EffectShadowPow;
	float EffectShadowClamp;
	float EffectFadeOutMul;
	float EffectFadeOutAdd;
	float EffectHorizonAngleThreshold;
	float EffectSamplingRadiusNearLimitRec;
	float DepthPrecisionOffsetMod;
	float NegRecEffectRadius;
	float LoadCounterAvgDiv;
	float AdaptiveSampleCountLimit;
	float InvSharpness;
	int PassIndex;
	float BilateralSigmaSquared;
	float BilateralSimilarityDistanceSigma;
	float4[] PatternRotScaleMatrices;      //5
	float NormalsUnpackMul;
	float NormalsUnpackAdd;
	float DetailAOStrength;
	float Dummy0;
	float2 SSAOBufferDimensions;
	float2 SSAOBufferInverseDimensions;
	float2 DepthBufferDimensions;
	float2 DepthBufferInverseDimensions;
	int2 DepthBufferOffset;
	float2 PerPassFullResUVOffset;
	float2 OutputBufferDimensions;
	float2 OutputBufferInverseDimensions;
	float2 ImportanceMapDimensions;
	float2 ImportanceMapInverseDimensions;
	float2 DeinterleavedDepthBufferDimensions;
	float2 DeinterleavedDepthBufferInverseDimensions;
	float2 DeinterleavedDepthBufferOffset;
	float2 DeinterleavedDepthBufferNormalisedOffset;
	float4x4 NormalsWorldToViewspaceMatrix;
}
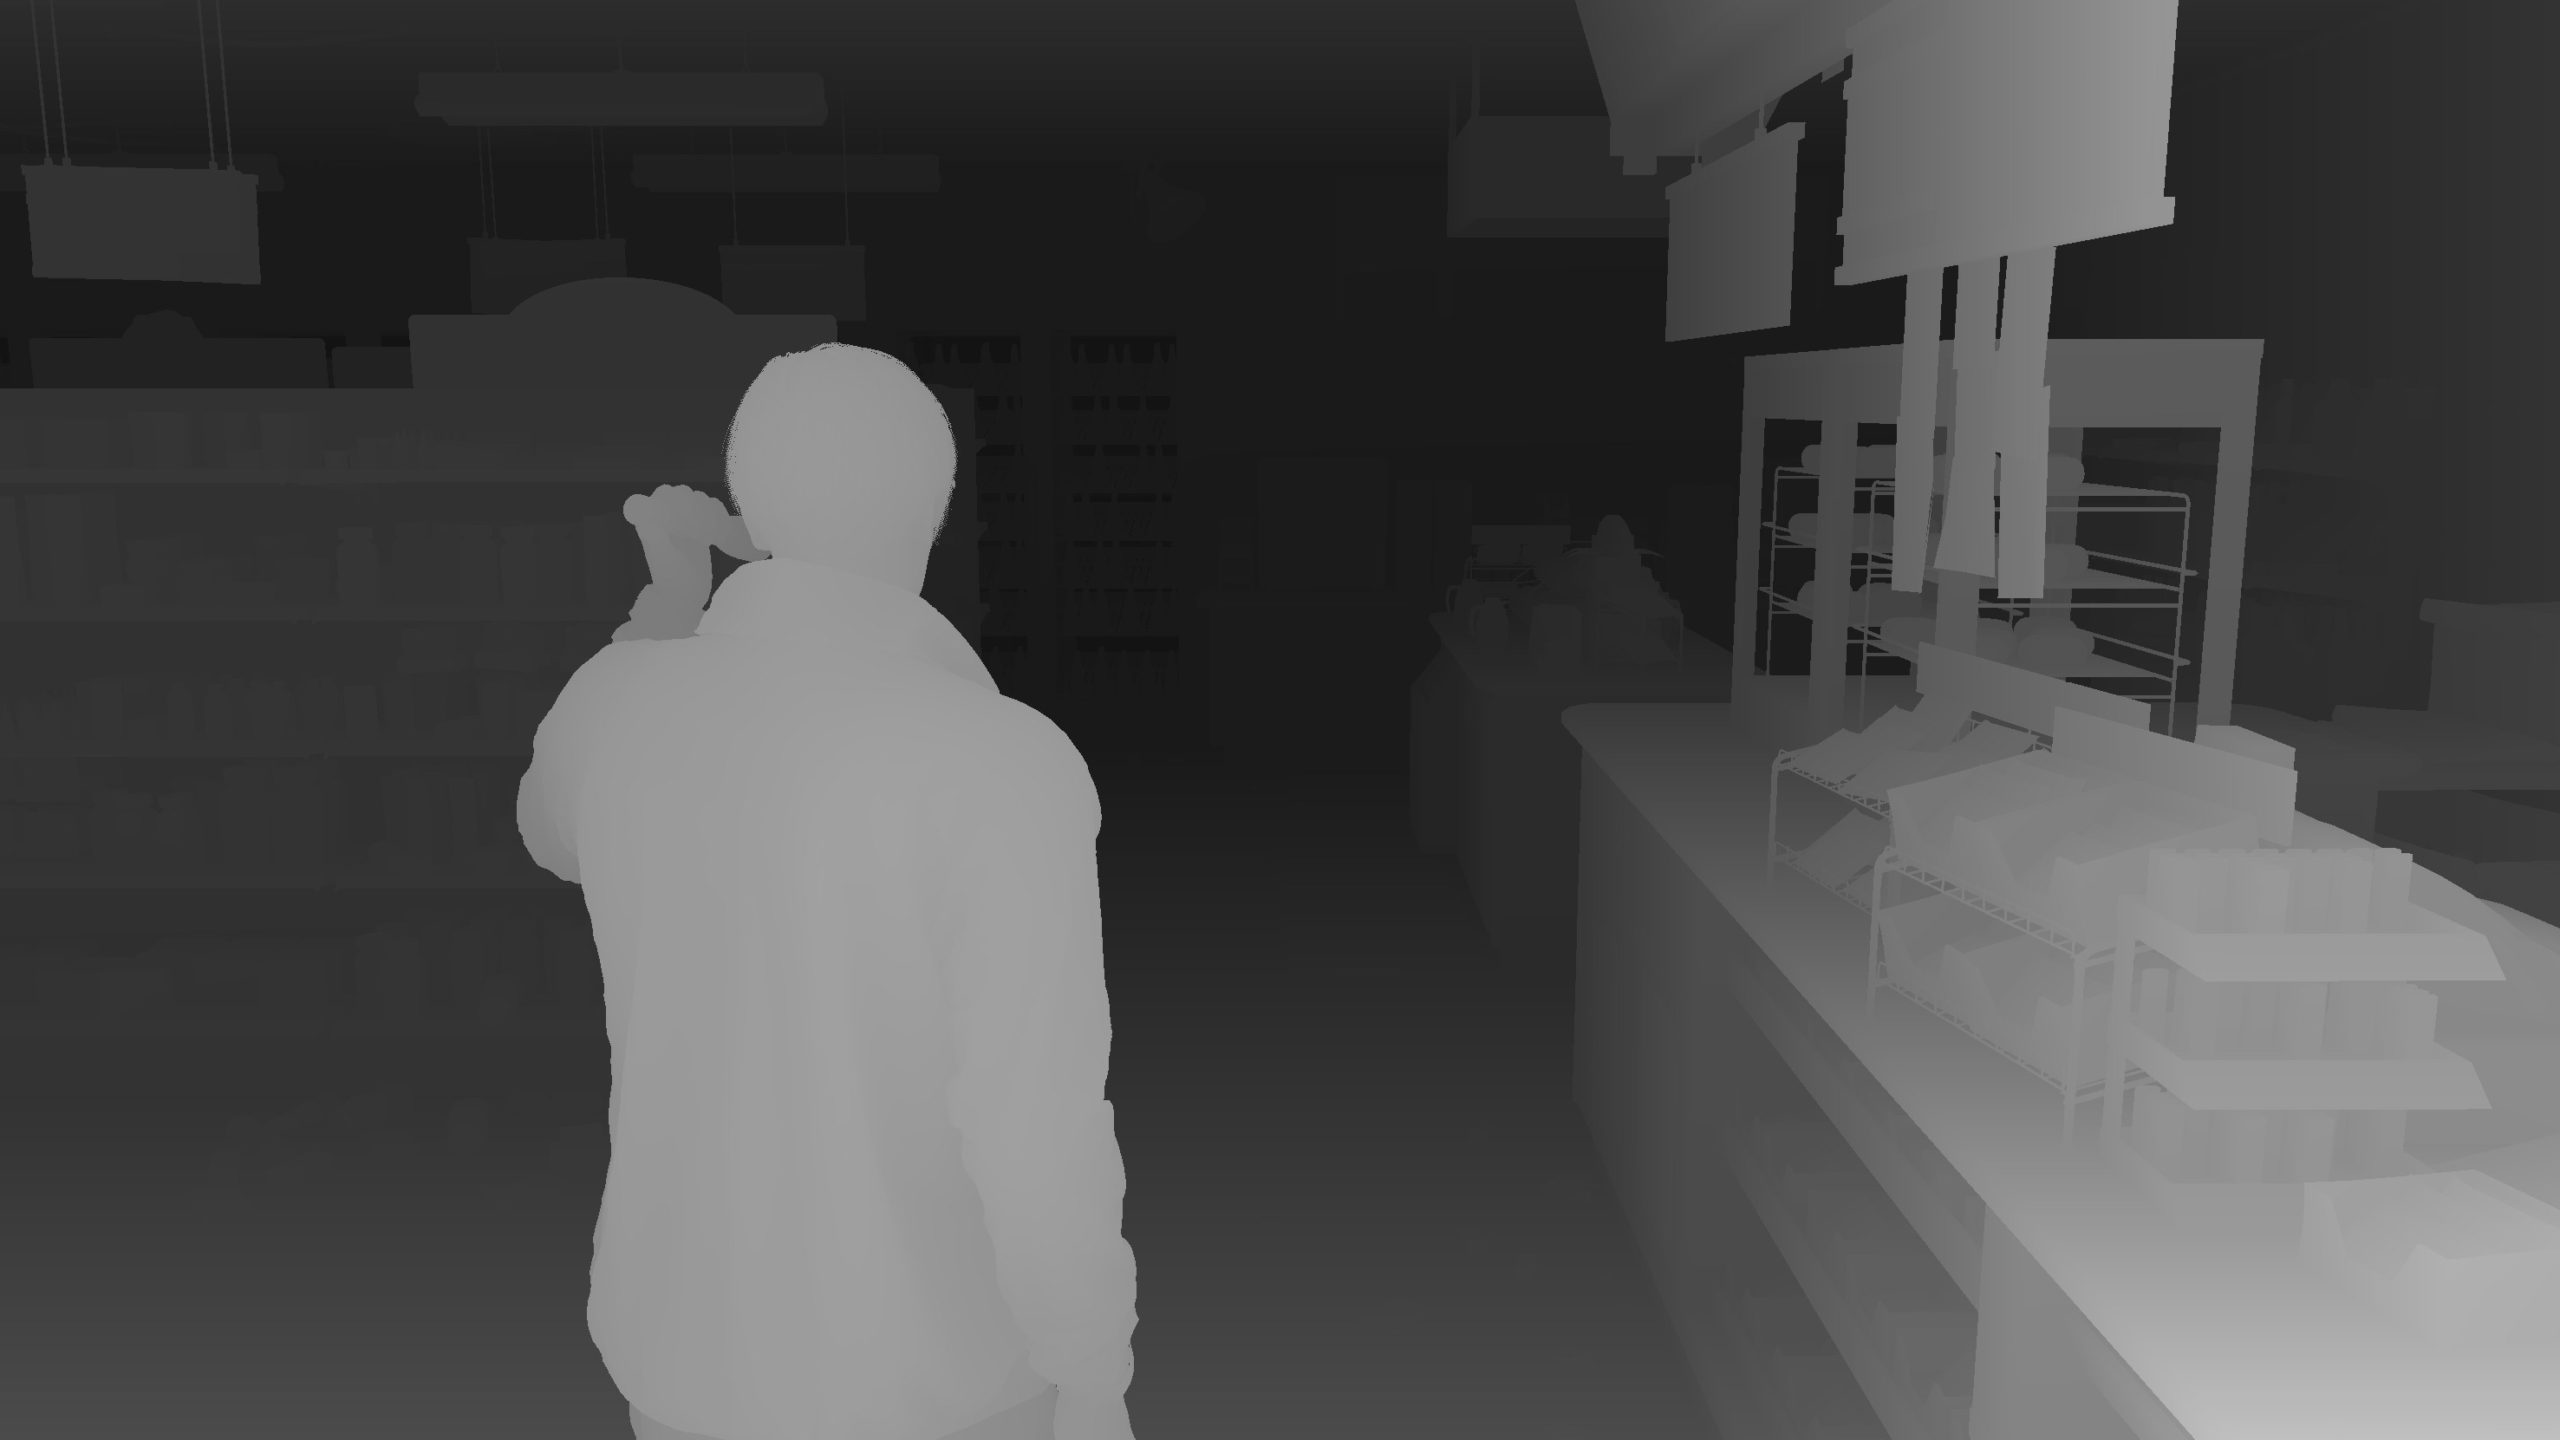
Particle Depth Emitters [Compute]
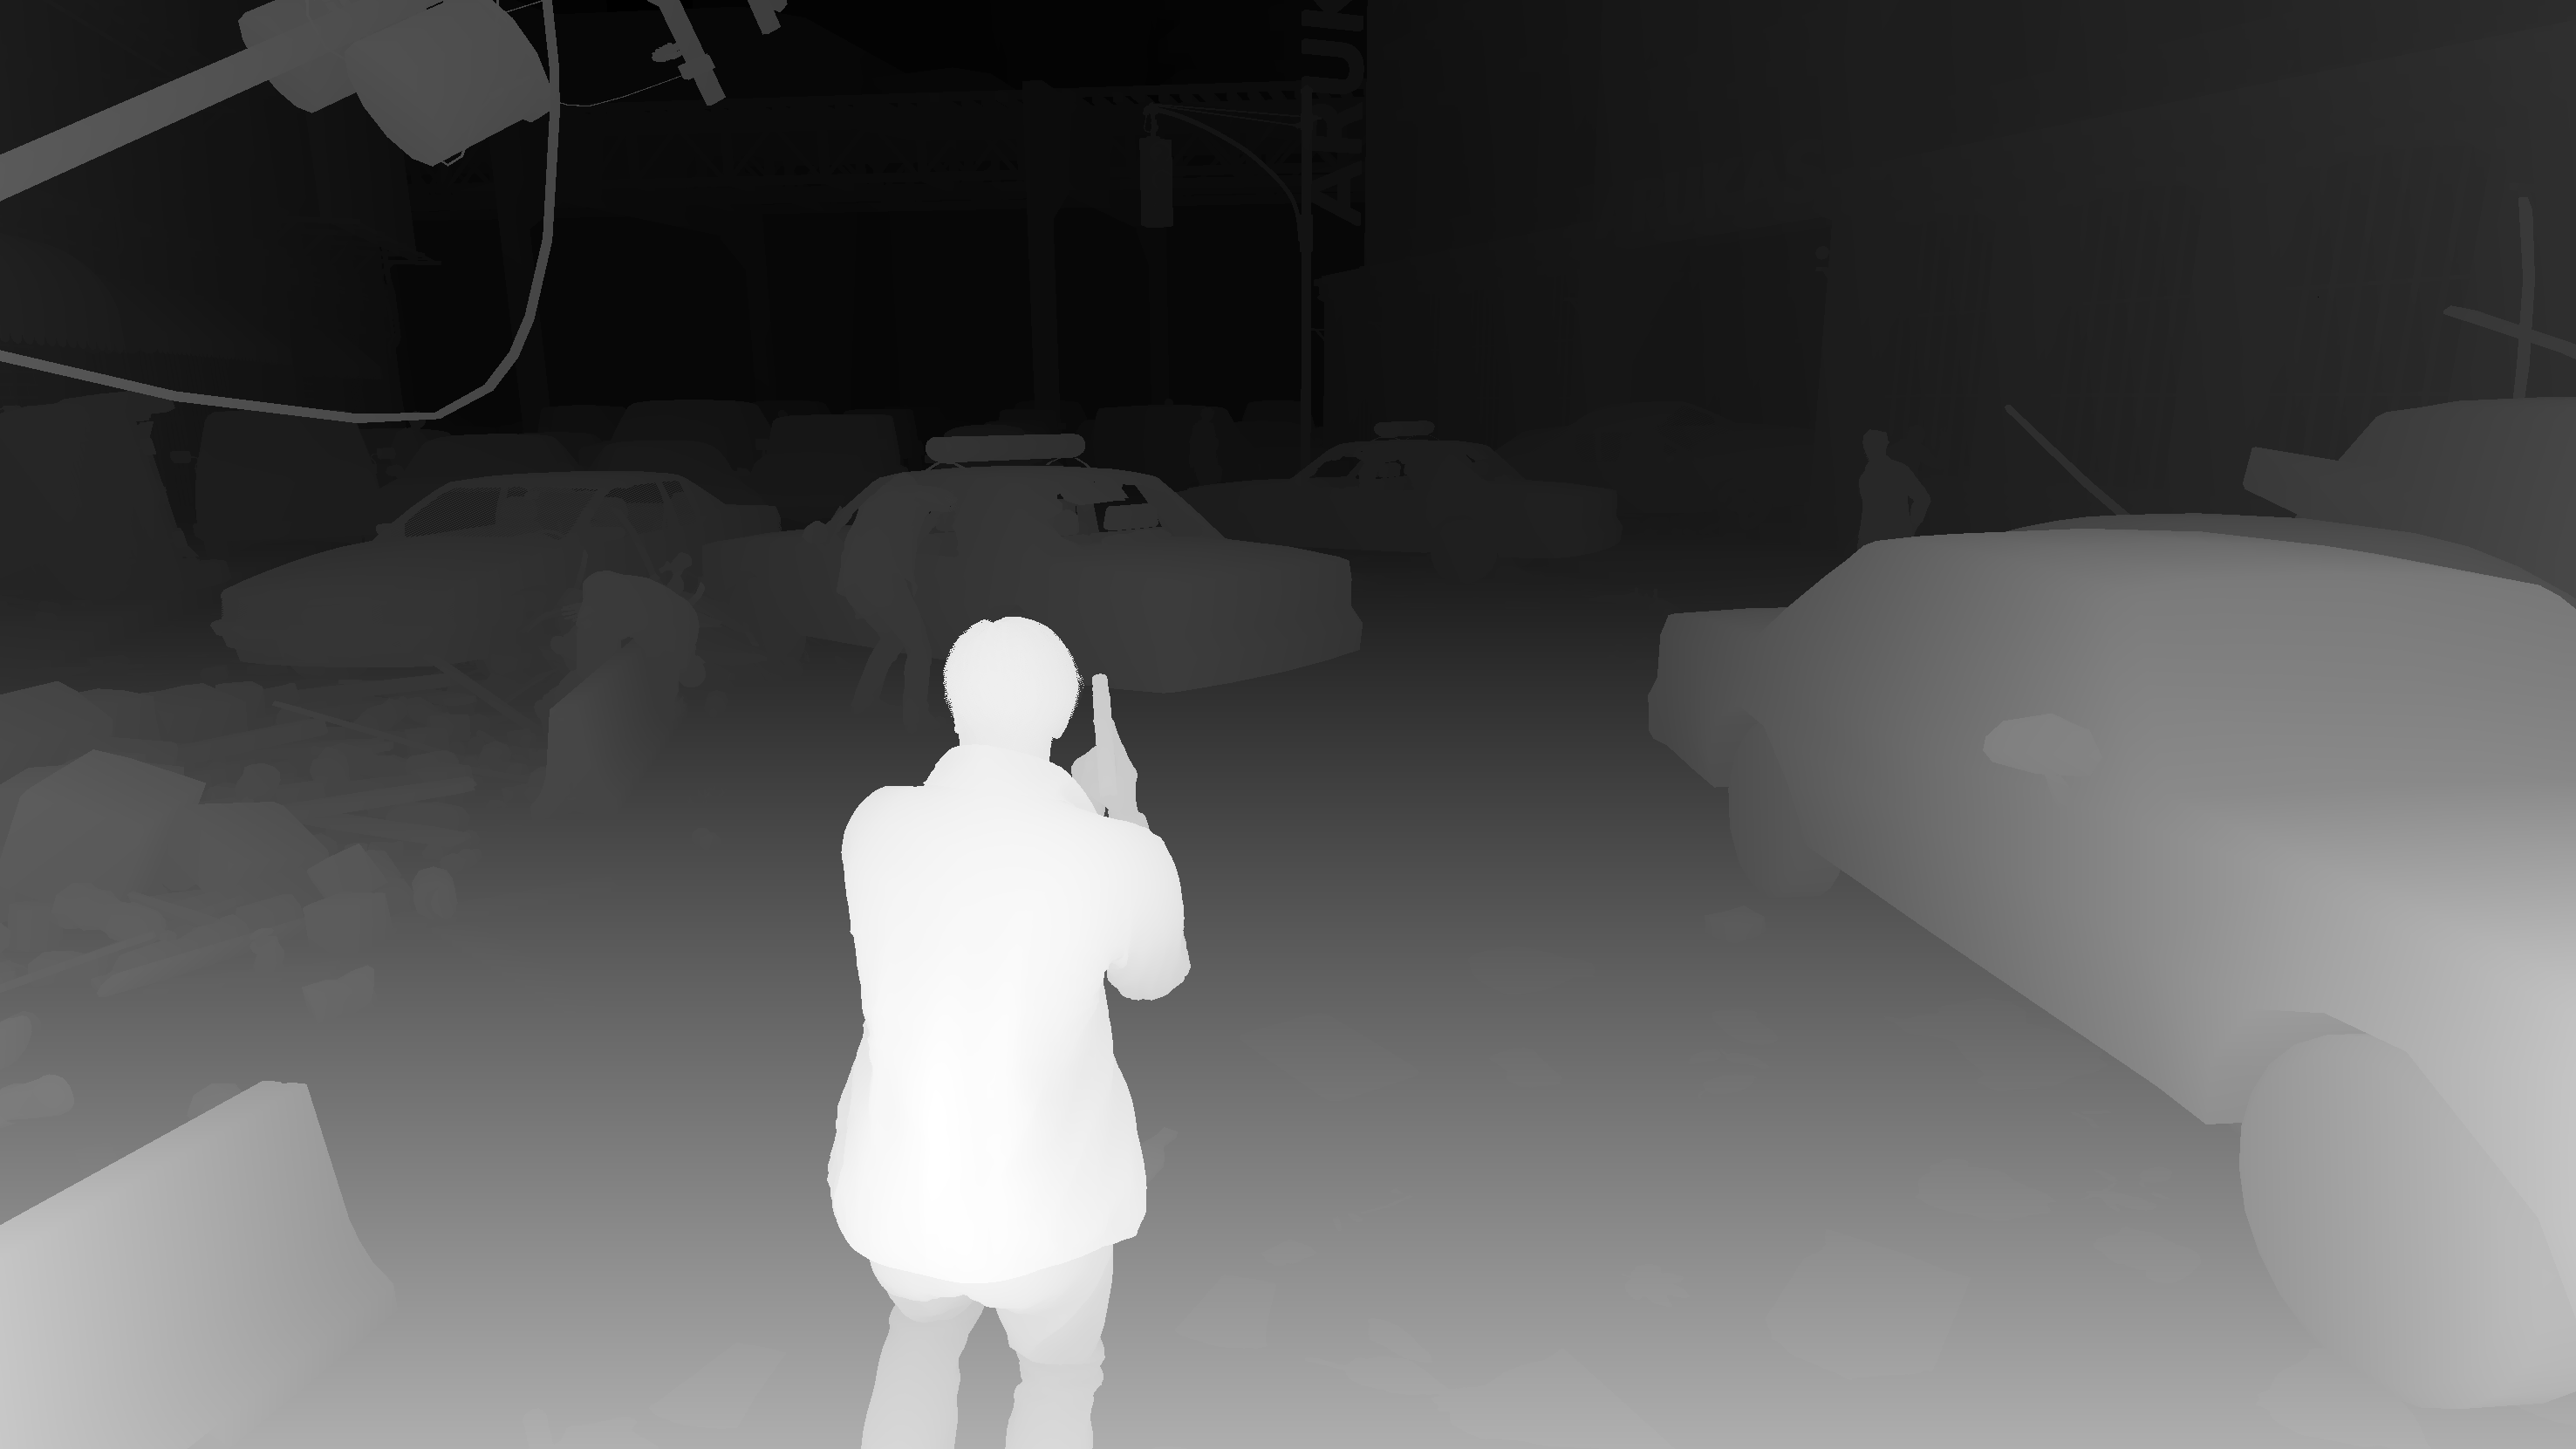
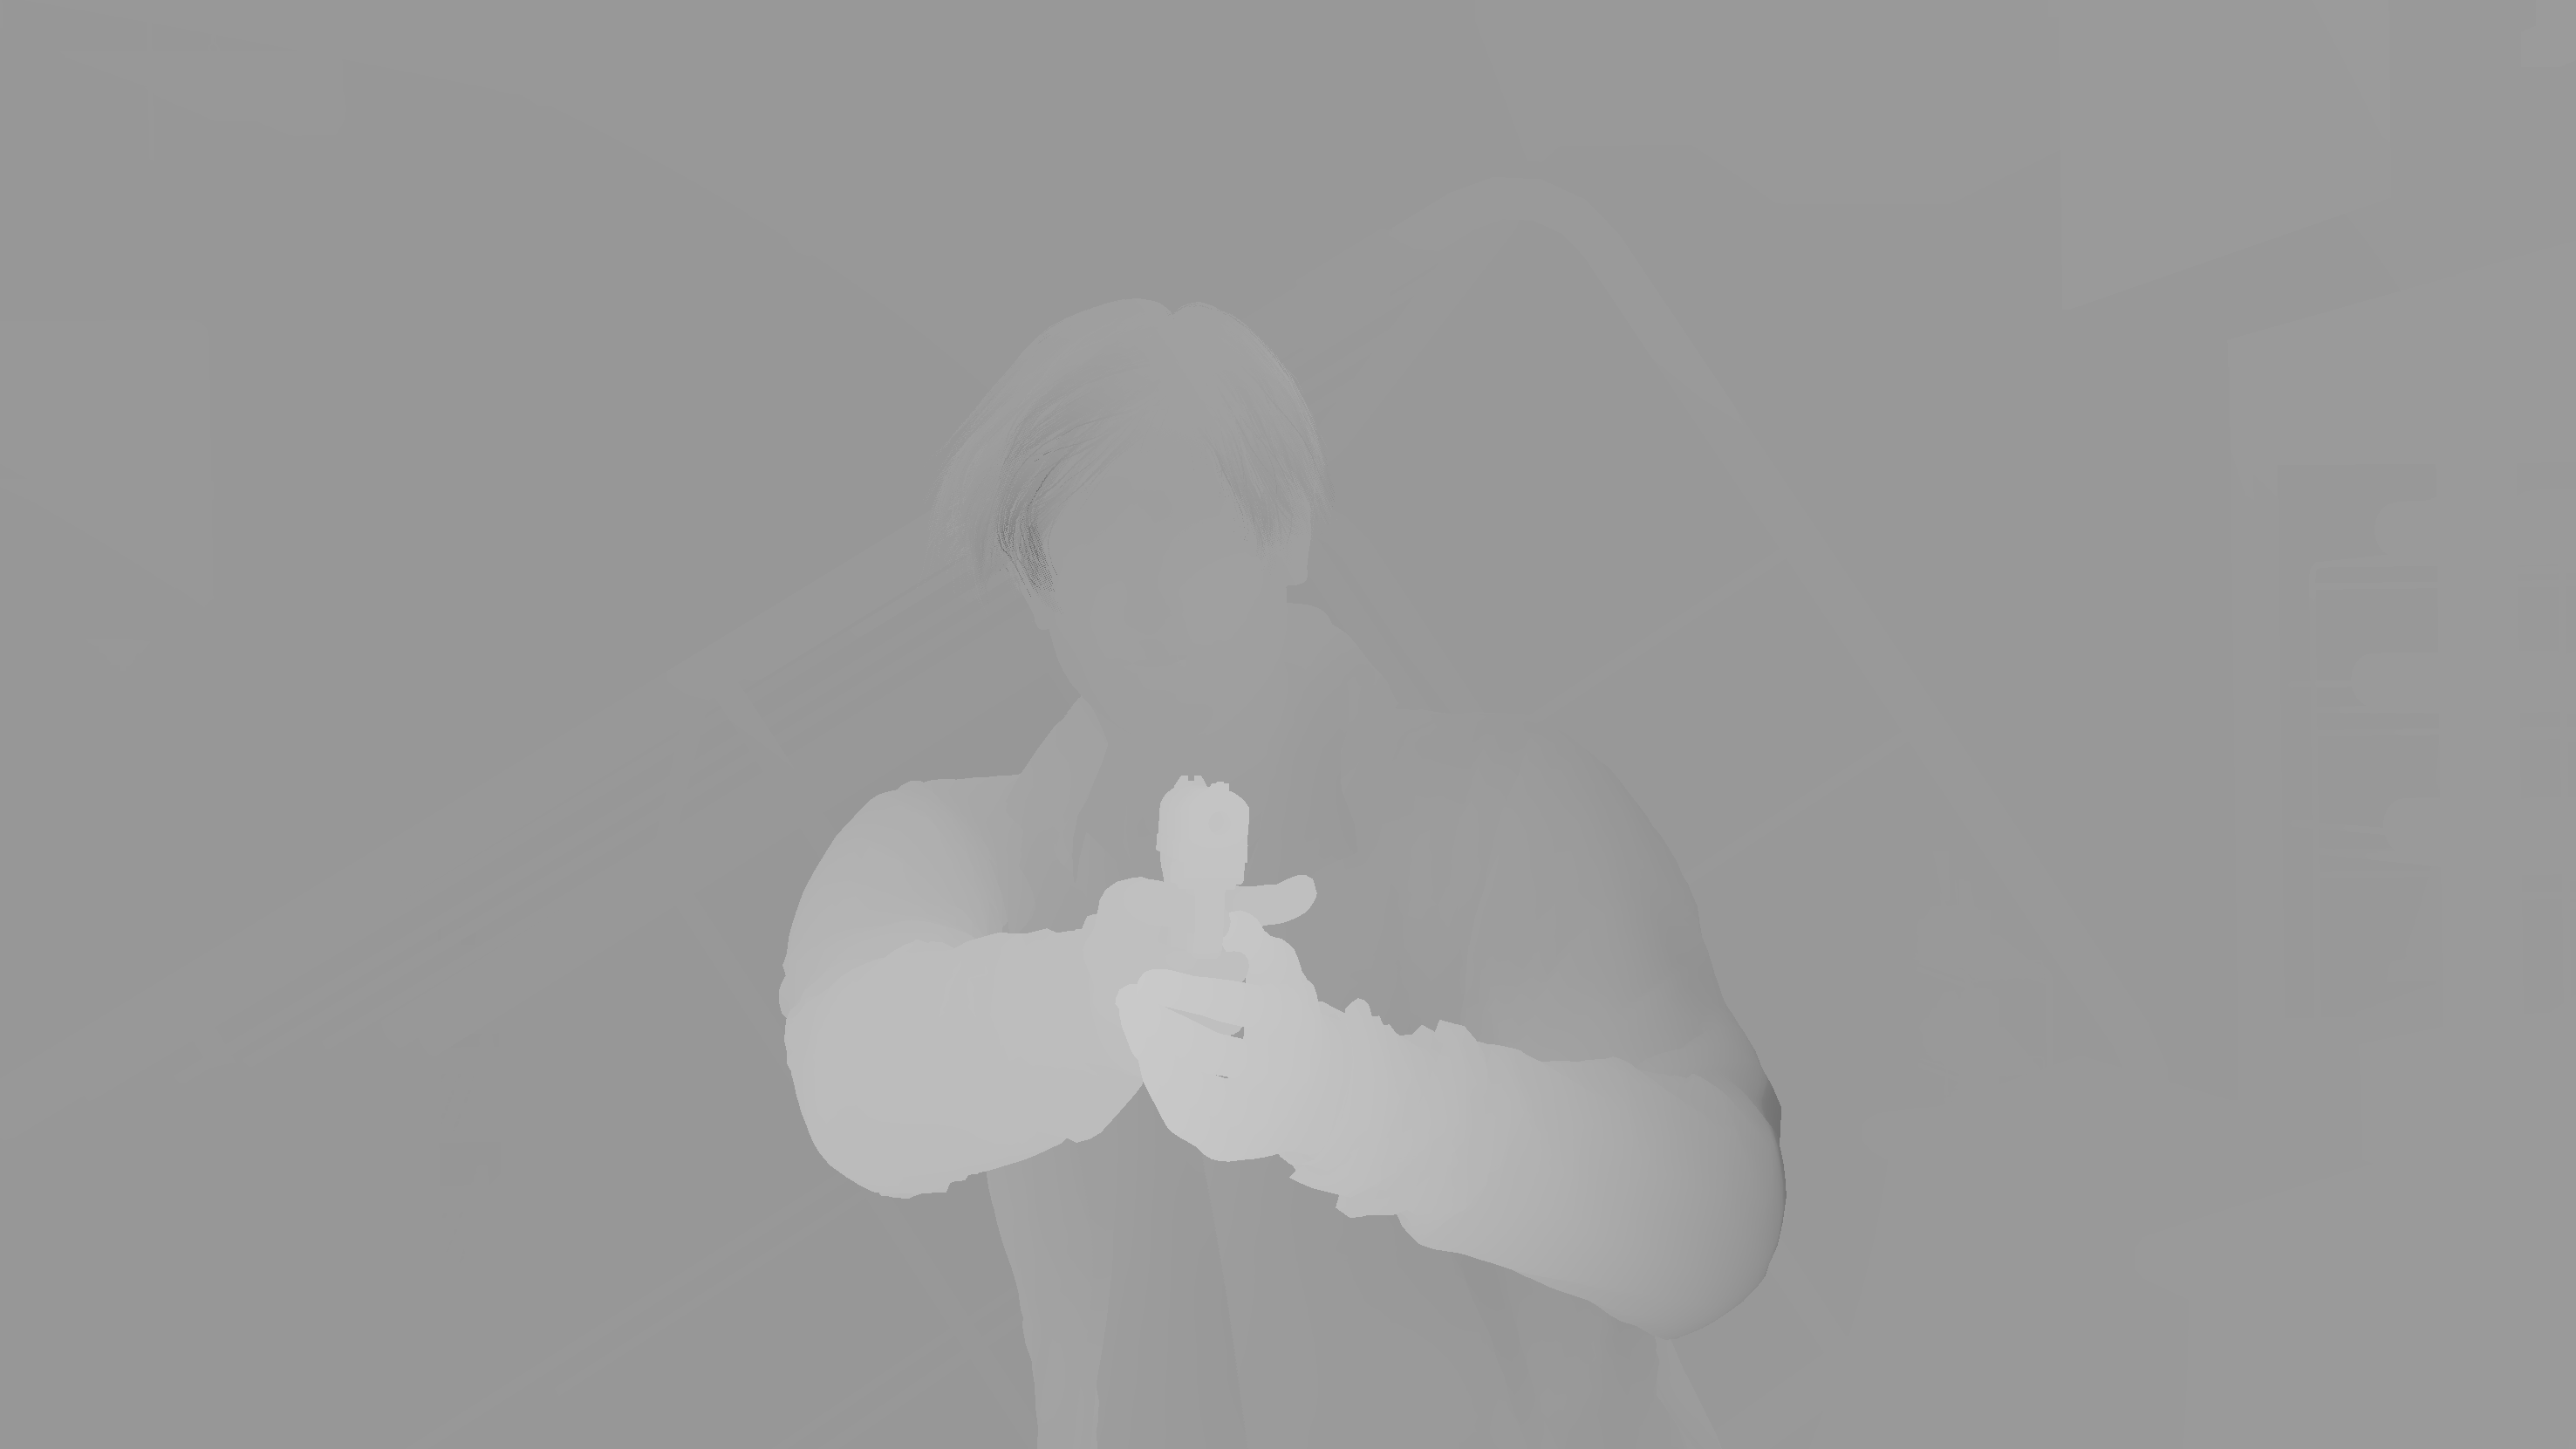
Depth based colliding particles. Nothing visual to see here except the Depth image, which been seen a thousand time already. But there are some interesting buffer & structured buffers going around the dispatches such as EmitterInstances, ParticleStructures, ParticleProperites, and ItmesBuffer.
Emitter Instances
struct EmitterInstance
{
	int maxParticle;
	int spawnNum;
	int segmentNum;
	int constantBufferSize;
	int randSeed;
	int emitterTime;
	int totalSpawnNum;
	int[] propertyOffsets;    //5
	int partsStartNoCounter;
	int particleBinaryHead;
	int propertyStride;
	int particleCount;
	int particleMaxId;
	int preParticleCount;
	int preParticleMaxId;
}
An array of that struct
Indirect Illumination [Compute]
Indirect Illumination, aka Global Illumination, aka GI. Nothing fancy to highlight, except the cubemaps!
Below are few examples of GI phase


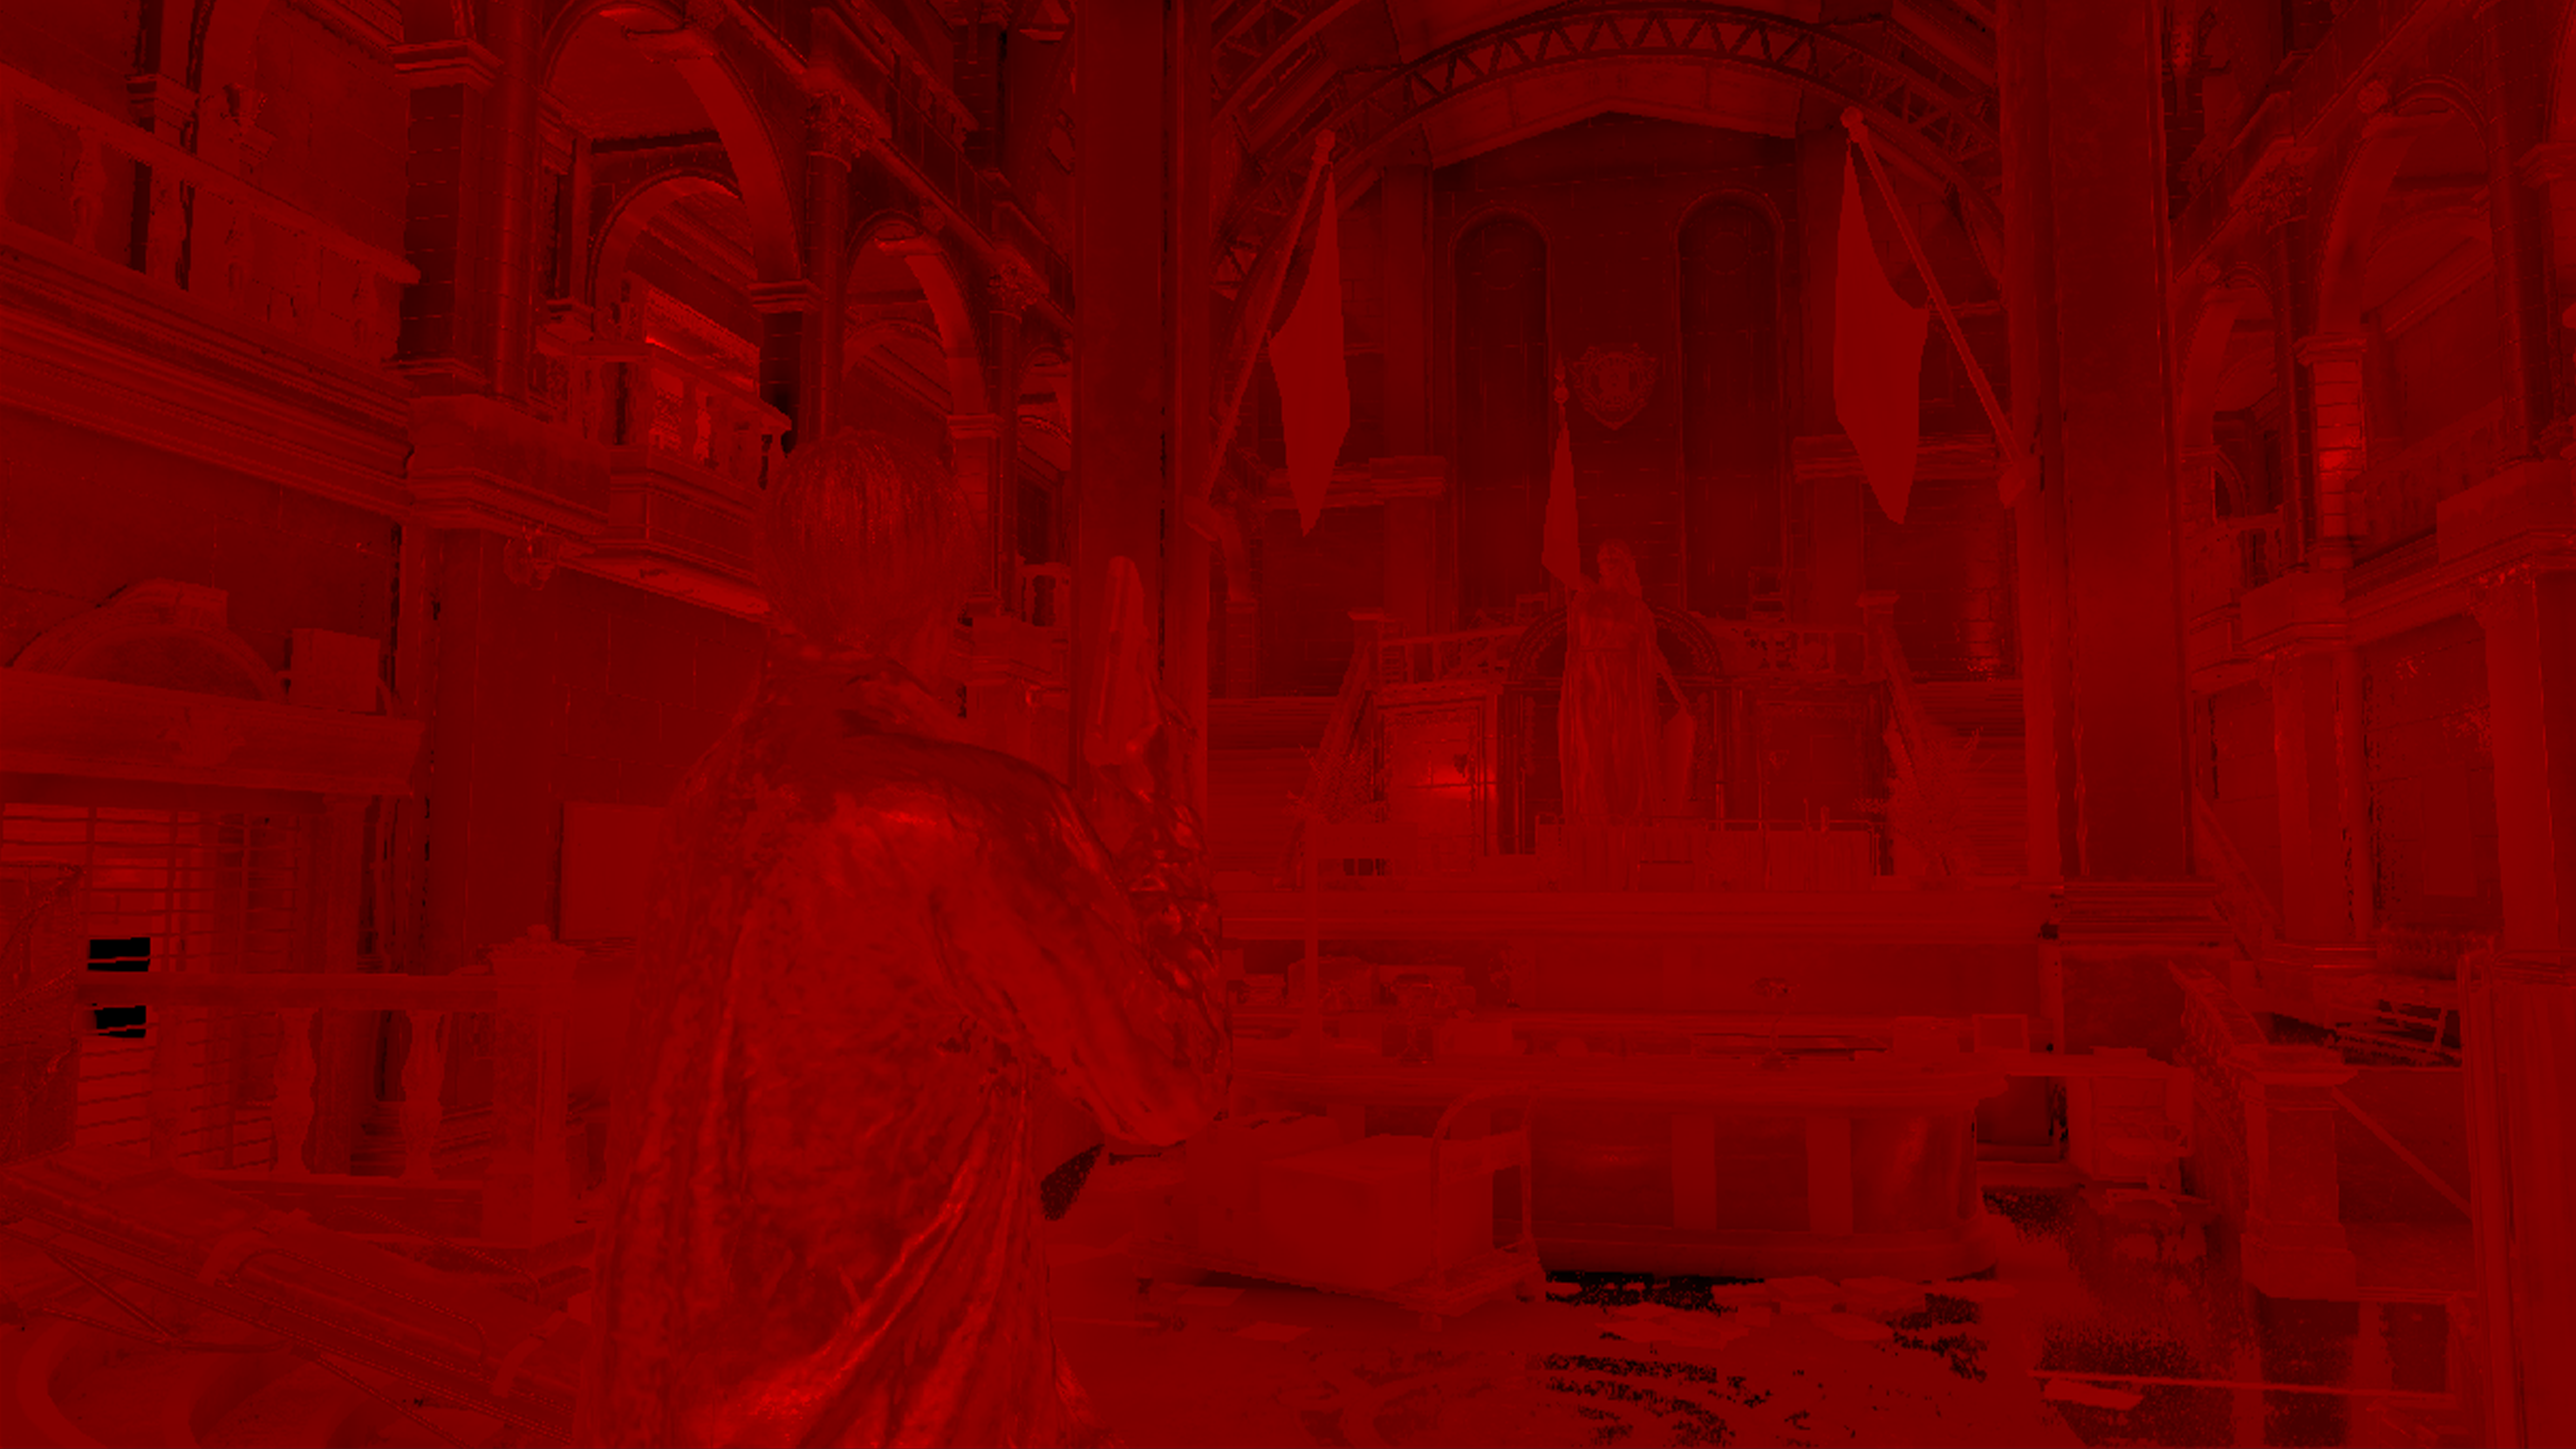
Totally Not Important Note
Funny…i was just speaking few days ago with someone about the BRDF and it is not always “Red texture with little Green“, and there are quite a few variations but not popular. And today while writing that part, i hit one of those fancy ones!
Cubemaps leaving some questions.
First, why an exterior frame have totally black cubemap where an interior frame have usual cubemap sky?
Second, why not using one Cubemap input?
Third, let’s assume there is a strong reason behind two different cubemaps for IBL/GI/Lighting, why on earth making a full 128 slices/entries, where only need to use maximum about 20?
Apart from that, here are most of the params passed to the dispatches during all the GI phases
Environment Info
struct EnvironmentInfo
{
	uint timeMillisecond;
	uint frameCount;
	uint isOddFrame;
	uint reserveEnvironmentInfo;
	uint4 rayTracingParams;
	float breakingPBRSpecularIntensity;
	float breakingPBRIBLReflectanceBias;
	float breakingPBRIBLIntensity;
	float breakingPBR_Reserved;
	uint vrsTier2Enable;
	uint reserveEnvironmentInfo2;
	uint reserveEnvironmentInfo3;
	uint reserveEnvironmentInfo4;
	float4[] userGlobalParams;     //32
}
Light Info
struct LightInfo
{
	uint PunctualLightCount;
	uint AreaLightCount;
	uint PunctualLightFowardCount;
	uint AreaLightFowardCount;
	float2 LightCullingScreenSize;
	float2 InverseLightCullingScreenSize;
	float LightCullingOffsetScale;
	uint RT_PunctualLightCount;
	uint RT_AreaLightCount;
	uint CubemapArrayCount;
	float3 DL_Direction;
	uint DL_Enable;
	float3 DL_Color;
	float DL_MinAlpha;
	float3 DL_VolumetricScatteringColor;
	uint DL_Reserved;
	float4x4 DL_ViewProjection;
	float DL_Variance;
	uint DL_ArrayIndex;
	uint DL_TranslucentArrayIndex;
	float DL_Bias;
	float3 Cascade_Translate1;
	float Cascade_Bias1;
	float3 Cascade_Translate2;
	float Cascade_Bias2;
	float3 Cascade_Translate3;
	float Cascade_Bias3;
	float2 Cascade_Scale1;
	float2 Cascade_Scale2;
	float2 Cascade_Scale3;
	uint SDSMEnable;
	uint SDSMDebugDraw;
	float4 CascadeDistance;
	float3 Atmopshere_Reserved;
	uint Atmopshere_Flags;
	uint lightProbeOffset;
	uint sparseLightProbeAreaNum;
	uint tetNumMinus1;
	uint sparseTetNumMinus1;
	float smoothStepRateMinus;
	float smoothStepRateRcp;
	float _LightProbeReserve1;
	float _LightProbeReserve2;
	float3 AOTint;
	float _AOReserve1;
	float3 LightProbe_WorldOffset;
	float LightProbe_Reserved;
}
Checker Board Info
struct CheckerBoardInfo
{
	float2 cbr;
	float cbr_bias;
	float cbr_using;
}
Tetra Coordinate
struct TetrahedronTransform
{
	intt4 vertexId;
	intt4 neighborTetId;
	float4 row0;
	float4 row1;
	float4 row2;
}
Sparse Light Probes List
struct SparseLightProbesList
{
	float4 row0;
	float4 row1;
	float4 row2;
}
An array of 128 entry
Shadow Pass[es]
A depth only shadow pass for direct light sources. Usually this is a single pass at most cases, but there are cases (such as “some” cinematics) where it is more than a single depth pass (usually 2, but can go more). The one distinctive thing in this pass (which i like) is that it is entirely using Indirect Draw for the entire pass, which was not the case in other games (let’s say with Elden Ring which was using DrawIndexedInstansed || DrawInstanced for the shadow passes). The other interesting thing here, is that where many games tending to store in a big atlas, RE is tending more to store those in a 3DTexture of 32 Slices with fixed size of 2048*2048 in the format R32_TYPELESS…FAN!!!!!
Here are some examples for the different shadow passes cases


The reason i liked it like that, it is very organized, very friendly and very easy to debug & to optimize if needed. i agree that “all roads lead to Rome”, but why take a bumpy road if you can take a good smooth one!
While i do like what we’ve in hand here, but at the same time, i see the >1 passe in some cinematics is not necessary, and can be a good area of improvement. You can barely notice the difference between the different outputs.
Lighting Billboard Particles [Compute]
A quite long compute pass, that is dedicated to the “PreCalculateLighting” and then “CalculateNodeStretchBillboardLighting” and “CalculateGpuBillboardLighting” for the particles. No fancy inputs here, all inputs we are yet familiar with (same outputs & inputs from the GI phase) are inputs in this phase.
Light Parameter SRV
struct LightParameter
{
	float3 position;
	float boundingRadius;
	float3 direction;
	float falloff;
	float4 attenuation;
	float3 color;
	float tolerance;
	int shadowIndex;
	int iesId;
	int2 reserved;
}
An array of 512 elements
Shadow Parameter SRV
struct ShadowParameter
{
	float4x4 viewProjection;
	float variance;
	int arrayIndex;
	int translucentArrayIndex;
	float bias;
}
An array of 512 elements
Tetrahedron Transform
struct TetrahedronTransform
{
	intt4 vertexId;
	intt4 neighborTetId;
	float4 row0;
	float4 row1;
	float4 row2;
}
Among other structs that was already mentioned previously with particles (Emitter, EmitterInstance, ParticleStructure) and GI (BSP, BVH, SpareLightPropesList,…etc.).
Deferred Pass
1.Deferred Lighting
Just deferred fragment shader that does what a deferred frag shader does!


2.Deferred Projection Spotlight [Not always]
This is not always present, it depends on the current map/level and the existence of spot lights. There is no difference, it just makes the shader invoke couple more times to process spotlights contribution.
3.Fast SSSSS Apply
This step in reality is not actually a part of the Deferred pass, but i wanted to list it here as part of the deferred pass for 2 simple facts, 1st it takes place right away after the deferred invocations. 2nd, without the Fast-sssss, the output of the deferred pass is not actually a complete output, and some pixels (skin & such) is still missing for color info, or perhaps better to say it “still missing for some light calculations”, and the completion of this Fast-sssss for me means the completion of the deferred pass.
Step A – Apply SSSSS
Step B – Composite With Deferred Output
SSR [Compute] [Not always]
RE Engine is utilizing (what i believe) a Hi-Z Screen-Space Cone-Traced Reflections, which is quite interesting technique, if you are more into beyond the sneak peak below, feel free to check Yasin Uludag’s paper here, or in the reading section by the end of this article.
SSR steps are done only in some areas, as if there is “SSR volumes” or a per “Room/Map” settings that can control that feature. So rendering graph won’t always have this SSR series of dispatches. Those dispatches vary between regular Dispatches as well as Indirect Dispatch. SSR pass goes into the following steps
1 – SSR Indirect Clear
Clear buffers. Nothing interesting, but its essential for a clean start.
2 – Small Diffuse Default
Using the GBuffer’s attachments (Color, Metallic, Normals, Roughness) in addition to the Gl Specular from the Indirect Lighting phase, and the Hi-Z output from earlier and the Diffuse Image from the Deferred pass, the shader sometimes will keep other rendertargets around, but they do nothing. But this is only “sometimes”. The output will be new diffuse version that is Filtered Diffuse (8 mips).


3 – Small Diffuse Filter
This dispatch applies filter to the out Filtered Diffuse from the previous step, but it’s hard to observer the difference!

4 – SSR Indirect Prepare
This dispatch runs twice. But there is nothing visually present to showcase this compound two dispatches.
5 – Small Diffuse Filter
This dispatch runs 6 times. Remember few “years” ago at the top of this page 😅 we mentioned that at the Hi-Z phase that the resulted rendertarget has 7 mips/levels as output of the 7 dispatches. and mentioned that will be used later. Here it is used, in those 6 dispatches here, we go from level 7 down to level 0 and do filtering (same one done in step 3), but this time for all mips.
6 – SSR Ray Trace (Indirect Dispatch)
This is an Indirect Dispatch that runs twice. It s the ray tracing pass itself! Where all the Hi-Z Screen-Space Cone-Traced Reflections happens.
7 – SSR Resolve Reflection
This is where all are put together..And we not only get SSR applied, but we end up with a new GI rendertarget (previously we had GID for Diffuse, and GIS for Specualr, here we get GIR for reflections).


So, in a nutshell
During the entire process, a group of structs and params keep going between the different compute sahders/invocations. Below are the most common ones
SSR Control
struct SSRControl
{
	float RoughnessLimit;
	float DetailRoughnessLimit;
	float TemporalBlendRate;
	float ColorClampRate;
}
CB Hi-Z
struct CBHiZ
{
	int2 hiZSize;
	float2 texelSize;
	float mipCount;
}
CB Resolve
struct CBResolve
{
	int2 offset0;
	int2 offset1;
	int2 offset2;
	int2 offset3;
	float4x4 uvViewProjInvMat;
	float4x4 viewProjUVMat;
	float2 rep2UvScale;
	float2 rep2UvOffset;
	float2 screenToUVScale;
	float2 screenToUVOffset;
}
Frustum Volume
struct FrustumVolume
{
	float4[] FrustumCornerRays;
	float4 DepthEncodingParams;
	float4 DepthDecodingParams;
	uint3 FrustumVolumeTextureSize;
	uint FrustumVolumeFlags;
	float3 InvFrustumVolumeTextureSize;
	float pad1;
}
Volumetric Fog
– (TODO)
FX / GPU Particles 1
– (TODO)
Volumetric light
– (TODO) //not dedicated pass, it happens at the 2nd half of the GPU particles color pass
Light Shaft
A full color pass is dedicated to the light shafts. It’s mostly for light poles, flash lights, car head lights,…etc.

This is not a single step pass where you give A and get B out, that pass is composed of few but yet distinctive steps.
1.Using the current GBuffer’s Depth, in addition to the Shadowmap and a unique 1D Texture array of 64 slices that represents the IESLightTable, the shader start drawing into a new rendertarget dedicated to the Light Shafts.


Keep in mind, for those IESLightTable, it’s a 512 in 64 slices (array elements) so, each entry/slice, is just 1 pixel height of that textuers abov. So all slices would look like that for the 3 test frames


The following struct is passed to the shader that draws
Light Shaft
struct cbLightShaft
{
	float3x4 InvModelMat;
	float3x4 InvViewModelMat;
	float3x4 InvModelLightMat;
	float3x4 InvLightMat;
	float4 lightPosition;
	float3 lightDirection;
	float lightFalloff;
	float4 lightAttenuation;
	float3 lightColor;
	float lightBoundingRadius;
	float lightTolerance;
	float fExtinctionCoef;
	float fRayleighCoef;
	float fMieCoef;
	float2 fFovTan;
	float2 fInverseReducedScreenSize;
	float fZAttnStart;
	float fZAttnEnd;
	float fInvZRange;
	float fZOriginDist;
	uint indexes;
	uint flags;
	float transparency;
	float fScreenAspect;
	uint tilingNum;
	float _LightShaft_Reserved0;
	float _LightShaft_Reserved1;
	float _LightShaft_Reserved2;
}
Drawing is not happening at once, it is one draw at a time per volumetric light source that shall result in light shafts


2.That render target then get scaled to the work/rendering resolution (1/2 or the output resolution), but this happens horizontally only..if you asking why? it’s because why not! I would’ve gone with fully 1/2 res, but i believe the reason behind that resolution used here, is because it give close (if not same) result, with less pixels to deal with in the fragment shader. Which is yet another good choice (if i’m not wrong).


3.Finally the lightshaft render target get composed into the current frame (the one came out of the GPU Particles & Volumetric lights previous step)
for that last two steps, the fragment shader use the following param
Light Shaft Filter
struct cbLightShaftFilter
{
	float filterEdgeSharpness;
	uint filterScale;
	float _LightShaftFilter_Reserved0;
	float _LightShaftFilter_Reserved1;
}
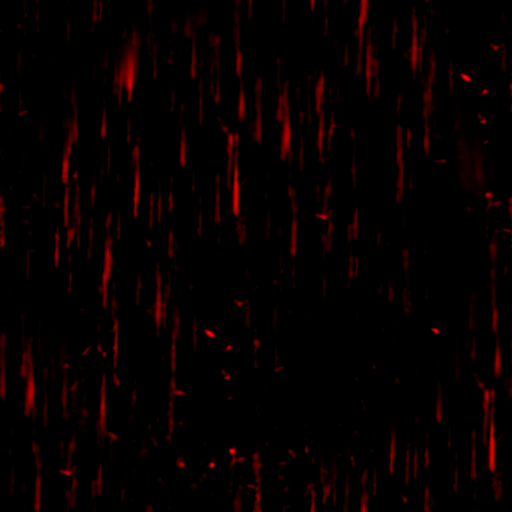
FX / Particles 2
//- (TODO) Car rain scene
Post Processing
Haze Composite
– (TODO)
Lens Flares Generate [Not always]
A full pass of instanced draws one by one to draw all the required flares. Only if needed, otherwise the entire pass skipped. For that purpose a limited set of around 9 sprites is used to draw the flares with the help of the frame’s Depth target. Those sprites textures while are unified in their format of BC7_SRGB, they does vary in their sizes as well as their texture pyramid depth.
So below you can check examples (with timelapse) of 3 different frames with pretty lens flares as well as their final swapchain.
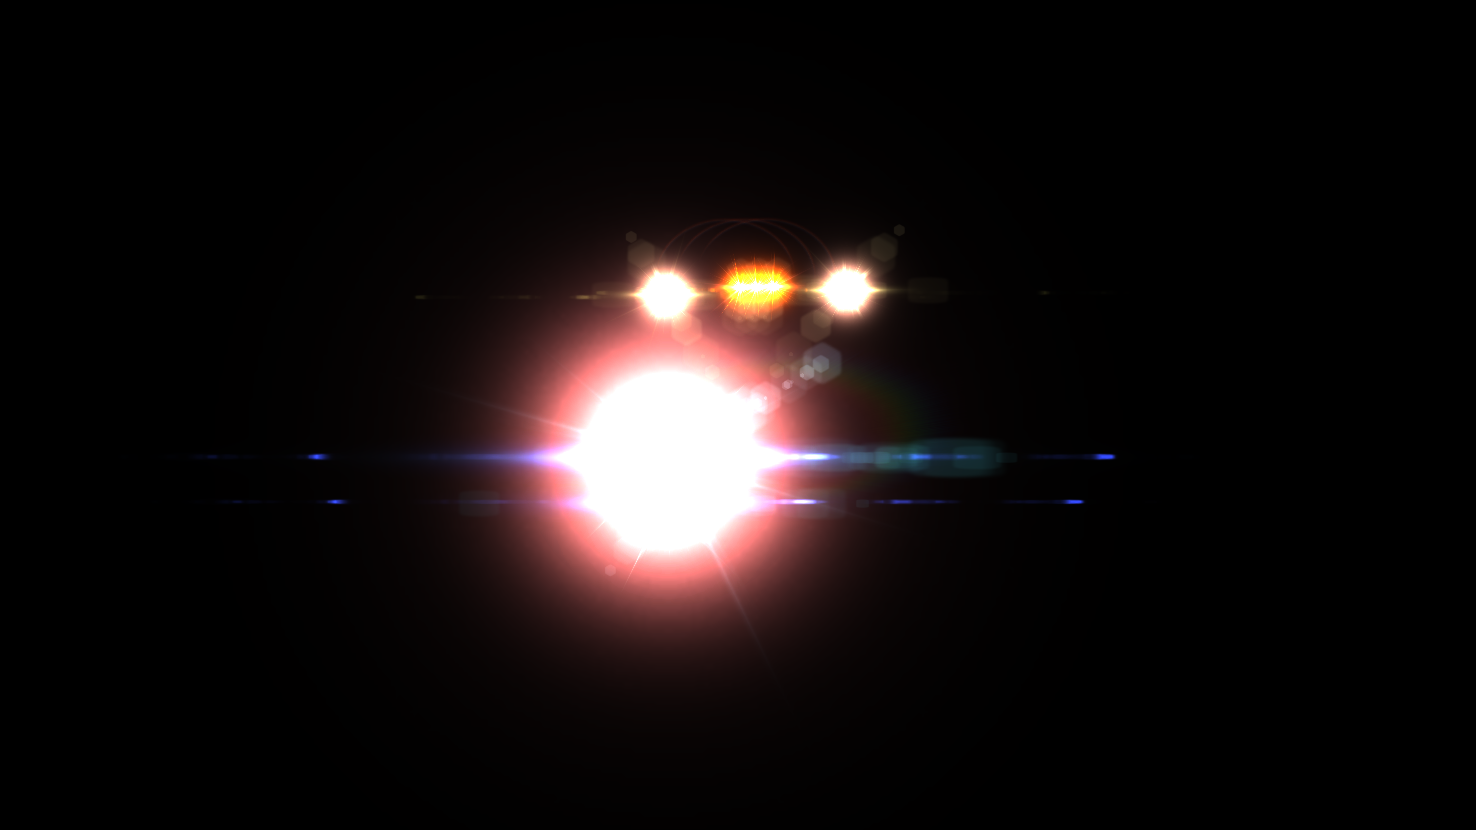
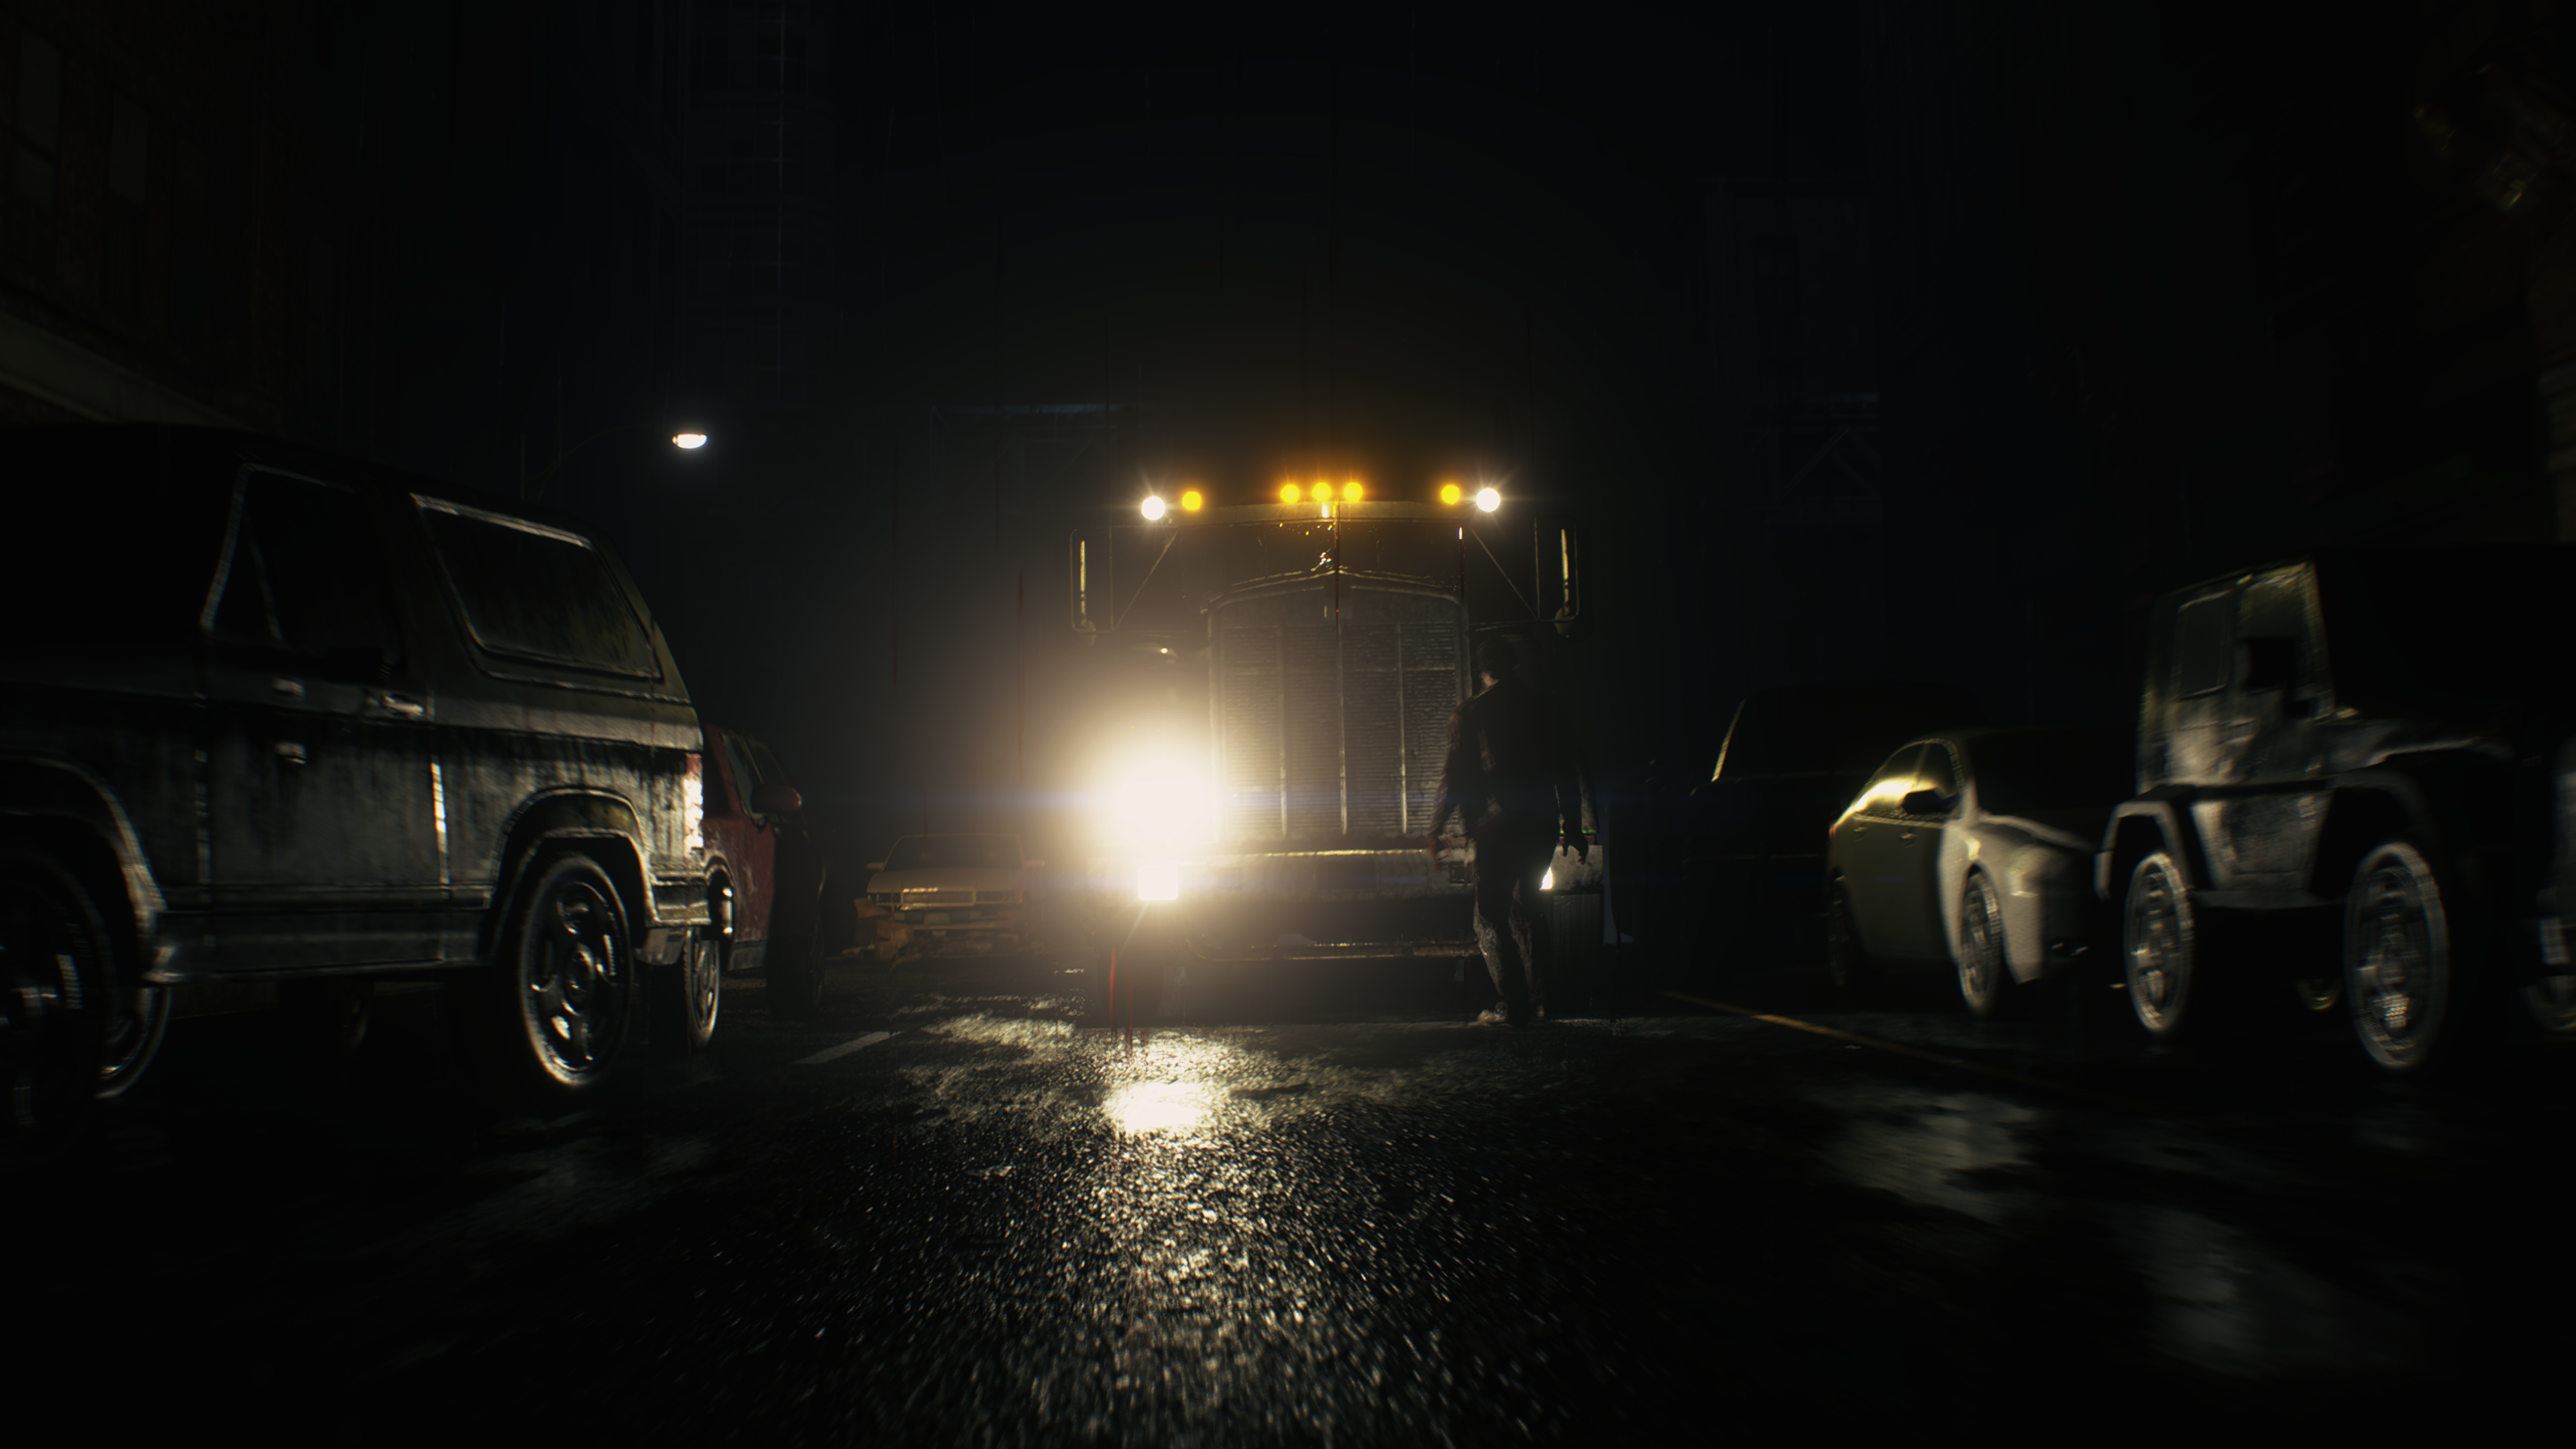

And of course it can’t be a “Behind the Pretty Frames” without a timelapse for every step of that magic. It is really pretty, this is why i insist in putting those things. Due to the gif compression, there are many tiny & slight draws made that is not clear, so the gifs below is actually linking to YouTube videos that are in full 4k!
The cool thing that you might notice that sometimes many of sprites show at once, this is the magic of instanced draws..as mentioned at the start of this section. But also you’ll notice at other times that time passing, but not change, this is not true, there are very slight draws that are occurring behind other draws…sadly i can’t find a good way to show those sneaky draws!


Lens Flare Constants
struct LensFlareConstants
{
	float cbLensflareDistance;
	float cbLensflareIntensityOffset;
	float cbLensflareScaleOffset;
	float cbLensflareBorderWidth;
	float2 cbLensflareOffset;
	float cbLensflareBorderOffset;
	float cbLensflareAspectRatio;
	uint cbLensflareOccludeSampleCount;
	float cbLensflareOccludeSampleRadius;
	float cbLensflareFadeStart;
	float cbLensflareFadeEnd;
	float2 cbLensflareRotationOffset;
	float cbLensflareTranslationVertical;
	float cbLensflareTranslationHorizontal;
	float4 cbLensflareGlobalColor;
	float3 cbLensflareFadeConeDir;
	float cbLensflareGlobalIntensity;
	float cbLensflareFadeConeAngle;
	float cbLensflareFadeSpreadAngle;
	float cbLensflareFadeNearStart;
	float cbLensflareFadeNearEnd;
	float cbLensflareFadeFarStart;
	float cbLensflareFadeFarEnd;
	float cbLensflareFadeByAlphaRate;
	float cbLensflareResolutionScale;
	uint cbLensflareFlags;
	float cbLensflareInterleaveScale;
	float cbLensflareReserve0;
	float cbLensflareReserve1;
}
Anti Aliasing (FXAA, TAA, FXAA+TAA) [Not always]
By default the game has the option for TAA + FXAA as an Anti Aliasing method. Which is the option i decided to go with for my capturers (unless stated something else). Both TAA as well as FXAA happens at the same draw and in the fragment shader. So regardless you using FXAA, or TAA, or FXAA+TAA this step will be exist, other wise (Off or MSAA) this step will be totally skipped.
A given Effect Mask rendertarget to do masking, usually this is black, unless there is something need to be excluded for now, which is most of the times are Particles. And also the shader is given the Depth (needed for FXAA) and the source HDR Image, which is the aliased party of the case.
In order to process the TAA part of the equation, the shader given the Prev HDR Image (the post AA one, so it’s already smoothed) as well as the Velocity (or velocities, or movement,…etc.) render target that was prepared earlier.
So it’s a total 5 inputs for the AA phase


And regarding the shader input params needed, for a reason, someone decided to combine the AA variables with the Tone Mapping variables in a single struct mainly named against the tone mapping phase!
Tonemap
struct Tonemap
{
	float exposureAdjustment;
	float tonemapRange;
	float sharpness;
	float preTonemapRange;
	int useAutoExposure;
	float echoBlend;
	float AABlend;
	float AASubPixel;
	float ResponsiveAARate;
}
Yeah, i agree. Not the best name. But you know, as long as the programmer responsible for the feature know that the “Tonemap” struct includes the “FXAA” params, life will just keep moving on…
If you follow carefully the params names across the entire study, you will know that there is 2 different naming styles 😉
And for the sake of variation and better confirmation of the findings, let’s give another example, perhaps from gameplay not cinematic, and with some actual values in the Effect Mask.


And before leaving this section, i want to mention that personally in the resolution and monitor i used, i can’t really complain about the final image quality, even with Anti-Aliasing totally turned off! all variations of AA were resulting in very very very similar swapchain presentation, unless you zoomed in very close! And if i need to give some credits in that regard, then may be to the FSR!
While all works fine in a final frame, and i can play & live with it. But i’m not a big fan of the SMAA results…not matching the initial paper from CryEngine..Not even close!!
Motion Blur
Just right away after AA, Motion Blur kicks in as a multi-pass post processor. It takes place in two phases, the first one is to prepare the “motion” which happens in compute dispatches, where the other half of the process is to apply the “Blur” in the fragment shader.
Prepare [Compute]
1 – Motion Blur Tile Max Height
Given the Depth and the Velocity, the 1st dispatch would result in a TileMaxHeigh rendertarget that is needed to “define” tile dimension for the next steps (just like DOF).
Keep in Mind
Tiles for post-processing here mostly are 32*32 in RE Engine. So if we’re working on a rendering resolution of 2953*1661, then tiles for post processing shall be ((2953/32)*(1661/32)) which is (92.281)*(51.906), and because we’re dealing with pixels and hence int, so we don’ t have a 1/2 or 1/4 or 1/3 pixel, we round that to (93*52) which you will see later on used for tiles rendertargets as resolution, where each pixel is a representation for a canvas tile.
The second output is a pre-computed velocities rendertarget PreComputedV that is based on the velocity rendertarget that was generated very early in the frame start (notice that basically we move from RGBA16 to RGBA8, aka half-velocities)


That later one (Pre Computed Velocity) holds all directions & mask in it’s channels as expected.


2 – Motion Blur Tile Max Velocity
Then using the TileMaxH, with a 2nd dispatch (a downsample pass) we can generate the TileMax rendertargert (same as DOF). In that new rendertarget, each pixel shall represent a tile. In each of those tiles, stored the highest magnitude velocity (from the half-velocity rendertarget) among all the velocity values in that tile (projection in the half-velocity rendertarget).

3 – Motion Blur Neighbor Max
Using the TileMax from previous dispatch as an input for that pass/dispatch, we can generate the NeighborMax in a 3rd and last dispatch by comparing each highest velocity of each tile with it’s neighbors. And then store the “new” highest value of half-velocity found.
It’s worth mentioning that the versions i put here for the TileMax and the NeighborMax, are upscaled linearly, but in reality those are the original ones


Apply
This is the fragment shader part of the process (aka final gather), where a DrawInstanced cmd issued using the previous data generated from compute (NeighborMax, PreComputedV + HDR Image), in order to result the final Motion Blurred HDR frame by blurring each pixel of the HDR Frame in the direction of the highest half-velocity for it’s tile in the NeighborMax rendertarget.

During the entire process (Compute & Graphics queues) the shaders are using the following buffer
MB Settings
struct MBSettings
{
	float MBInvertIntensity;
	float MBIntensity;
}
So, to put it all together, with couple more examples
Fragment In
Dispatch 2 In
Dispatch 3 In
Fragment In

Fragment In

Dispatch 2 In

Dispatch 3 In

Fragment In


Fragment In

Dispatch 2 In

Dispatch 3 In

Fragment In


And because velocities always look cool & interesting, specially their masks or their axis with least movement, here are the velocities for those 3 frames all side by side


Simple, fast, organized & pretty…i liked the Motion Blur post-processor in that Engine/Game!
DOF
DOF takes place in two (well defined) passes, a compute pass followed by a tiny color pass. It starts right away after the motion blur, and it is a 100% effect for cinematics only, and it was totally absent from all the captures i had for gameplay. Gameplay frame would jump right away from Motion Blur to Bloom. This is good, and that topic was one of the things i didn’t like about some other games, where they still process the effect even if it is absent. But here, it is TOTALLY absent when it is not needed (aka gameplay).
CoC, Neighbor & Alpha [Compute]
A 6 compute dispatches takes place in fixed order in order to generate the data needed by the fragment shader. It goes as follow
1.Depth to generate the Tile Max Heigh, you can think about this as a template for the tile size.

2.Use the pervious output to generate the TileMax rendertarget (first step in having complete Near & Far tiles mask)


3.Generate the Neighbor rendertarget, which is basically the complete Near & Far fields (mask) that is packed in R11G11B10_FLOAT (credits to this cool trick to Crysis/Cryteck/CryEngine)

4.Using the Depth + HDR Image + Neighbor (generated in previous step), we finally calculate the CoC, and at the same time downscale the HDR image to 1/2, so we have a version that is same size as CoC.


5.Now use that outputs of the previous dispatch (CoC & Downscaled HDR) + the neighbor, so we can calculate a CompressDOF, and DOF A. This is a good decision, i mean separating into two rendertargets, check the formats and you know what i mean. Also keep in mind at this case the CompressedDOF is fully white (it is red below due to the R32_UINT).


6.Using the CompressDOF to apply to the Downscaled HDR, so we can get an output of the first pass of the DOF…a fully blurry image!

And that’s all what happens under the hood for the compute part of the DOF. It is pretty much standard and i see a lot of similarities with some work done previously, specially in CryEgnine3, but of course it’s more “compute” driven now.
Bokeh DOF


The result is not that “outstanding” such as Elden Ring for example, but it is acceptable. And i do like the separation of the process into 2 passes, not the fact of using 2 passes, but the choice of a compute pass for all those generation at first, and then followed by a tiny color pass for the final composite, is just works for me!
If you’re not very clear about what happened right now. So basically in the compute we’ve generated everything we need, in addition to blurring the entire thing to the amount of blur defined by the artist for this area or cinematic sequence. Then we move to the color pass, where we use that fully blur image + the masks + clean HDR version of the frame , and we end up with a “focus” on the blurry image (aka DOF)… Hooray!
Because the compute’s output & fragment shader’s output are in different size, i just resized those to same size, in order to be easier to observer, but the sizes here not representing the correct sizes
Because that part might be confusing, i wanted to say again, but in a “different” way, reading the text on the images and seeing the images in full, shall be enough.


Some of the images (when you open in new tab) i scaled them up & down, just to make it easier to check the difference
i’ve added this section later while re-reading before posting, as i felt that part might be little confusing
One thing to keep in mind, regarding the used rendertargets above, that the Neighbor rendertarget i put an “Linear Upscaled” version of it, but in reality, this is it in full size

And of course, the CoC rendertarget as well is not the actual one. This is a “boosted” version of it, just to make it clear, the original one in it’s correct color space, is very hard to observer.


And of course, the DOF’s shader params that are used during the entire “two” passes are as follow
DOF
struct dof
{
	float coc_bias;                                //0.03284f
	float coc_scale;                               //-0.08055f
	float focal_plane_depth;                       //0.38943f
	float pcoc;                                    //0.0012f
	float quad_reduction_threshold;                //0.015f
	float quater_resolution_threshold;             //0.01f
	float near_blur_scaler;                        //10.00f
	float depth_adjuist_factor;                    //0.00f
	float bokeh_intensity_threshold;               //1.00f
	float bokeh_shape_factor;                      //0.00f
	float dof_single_pixel_radius;                 //0.00521f
	float dof_aspect;                              //0.5625f
}
Because i used one example frame in the article here, i decided to leave the values used for that frame commented per struct member.
Lens Flare Composite [Not always]
This is an occasionally present draw, it only happens “if needed” which most of the time is not needed. But there are good occasions to observe that too, mostly in cinematics, and that one too was something i did not find in any of my gameplay captures. Even in areas that have too much brightness (explosion or huge fire) i sometimes expect such lens effects, but nope!
Very straight forward draw, where the engine would composite the output of the DOF with the Lens Flare rendertarget we got earlier.
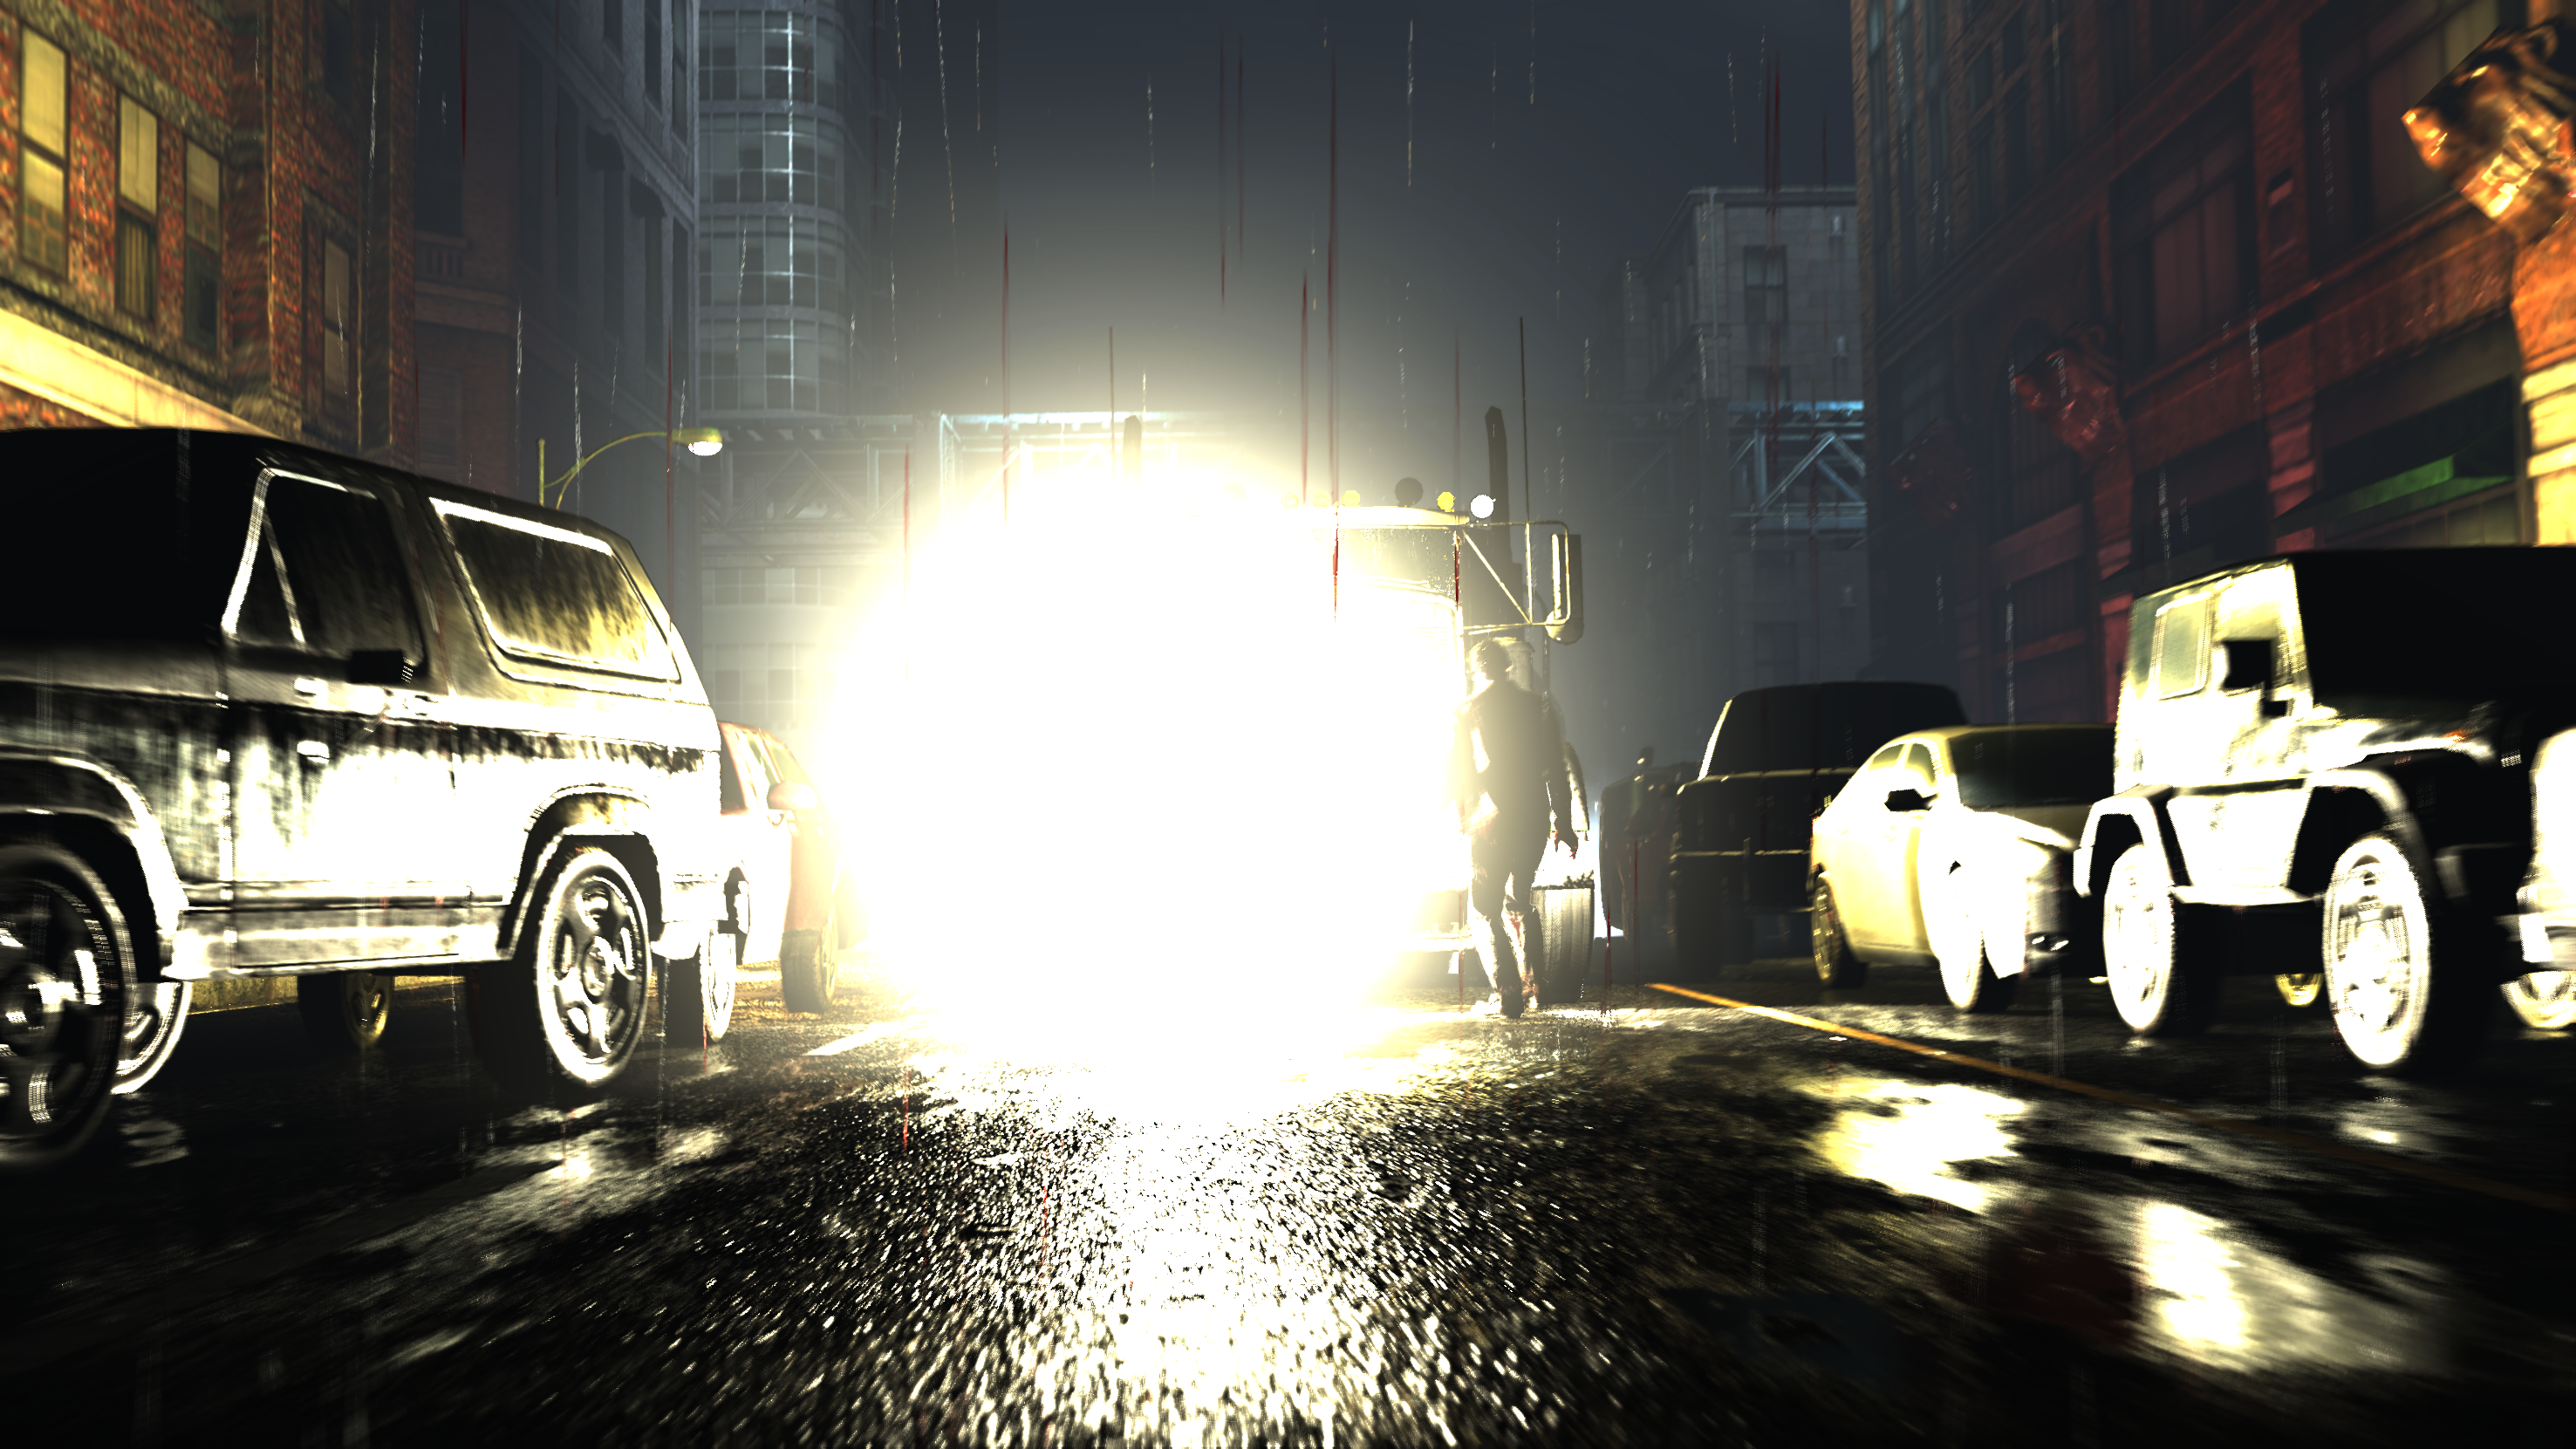
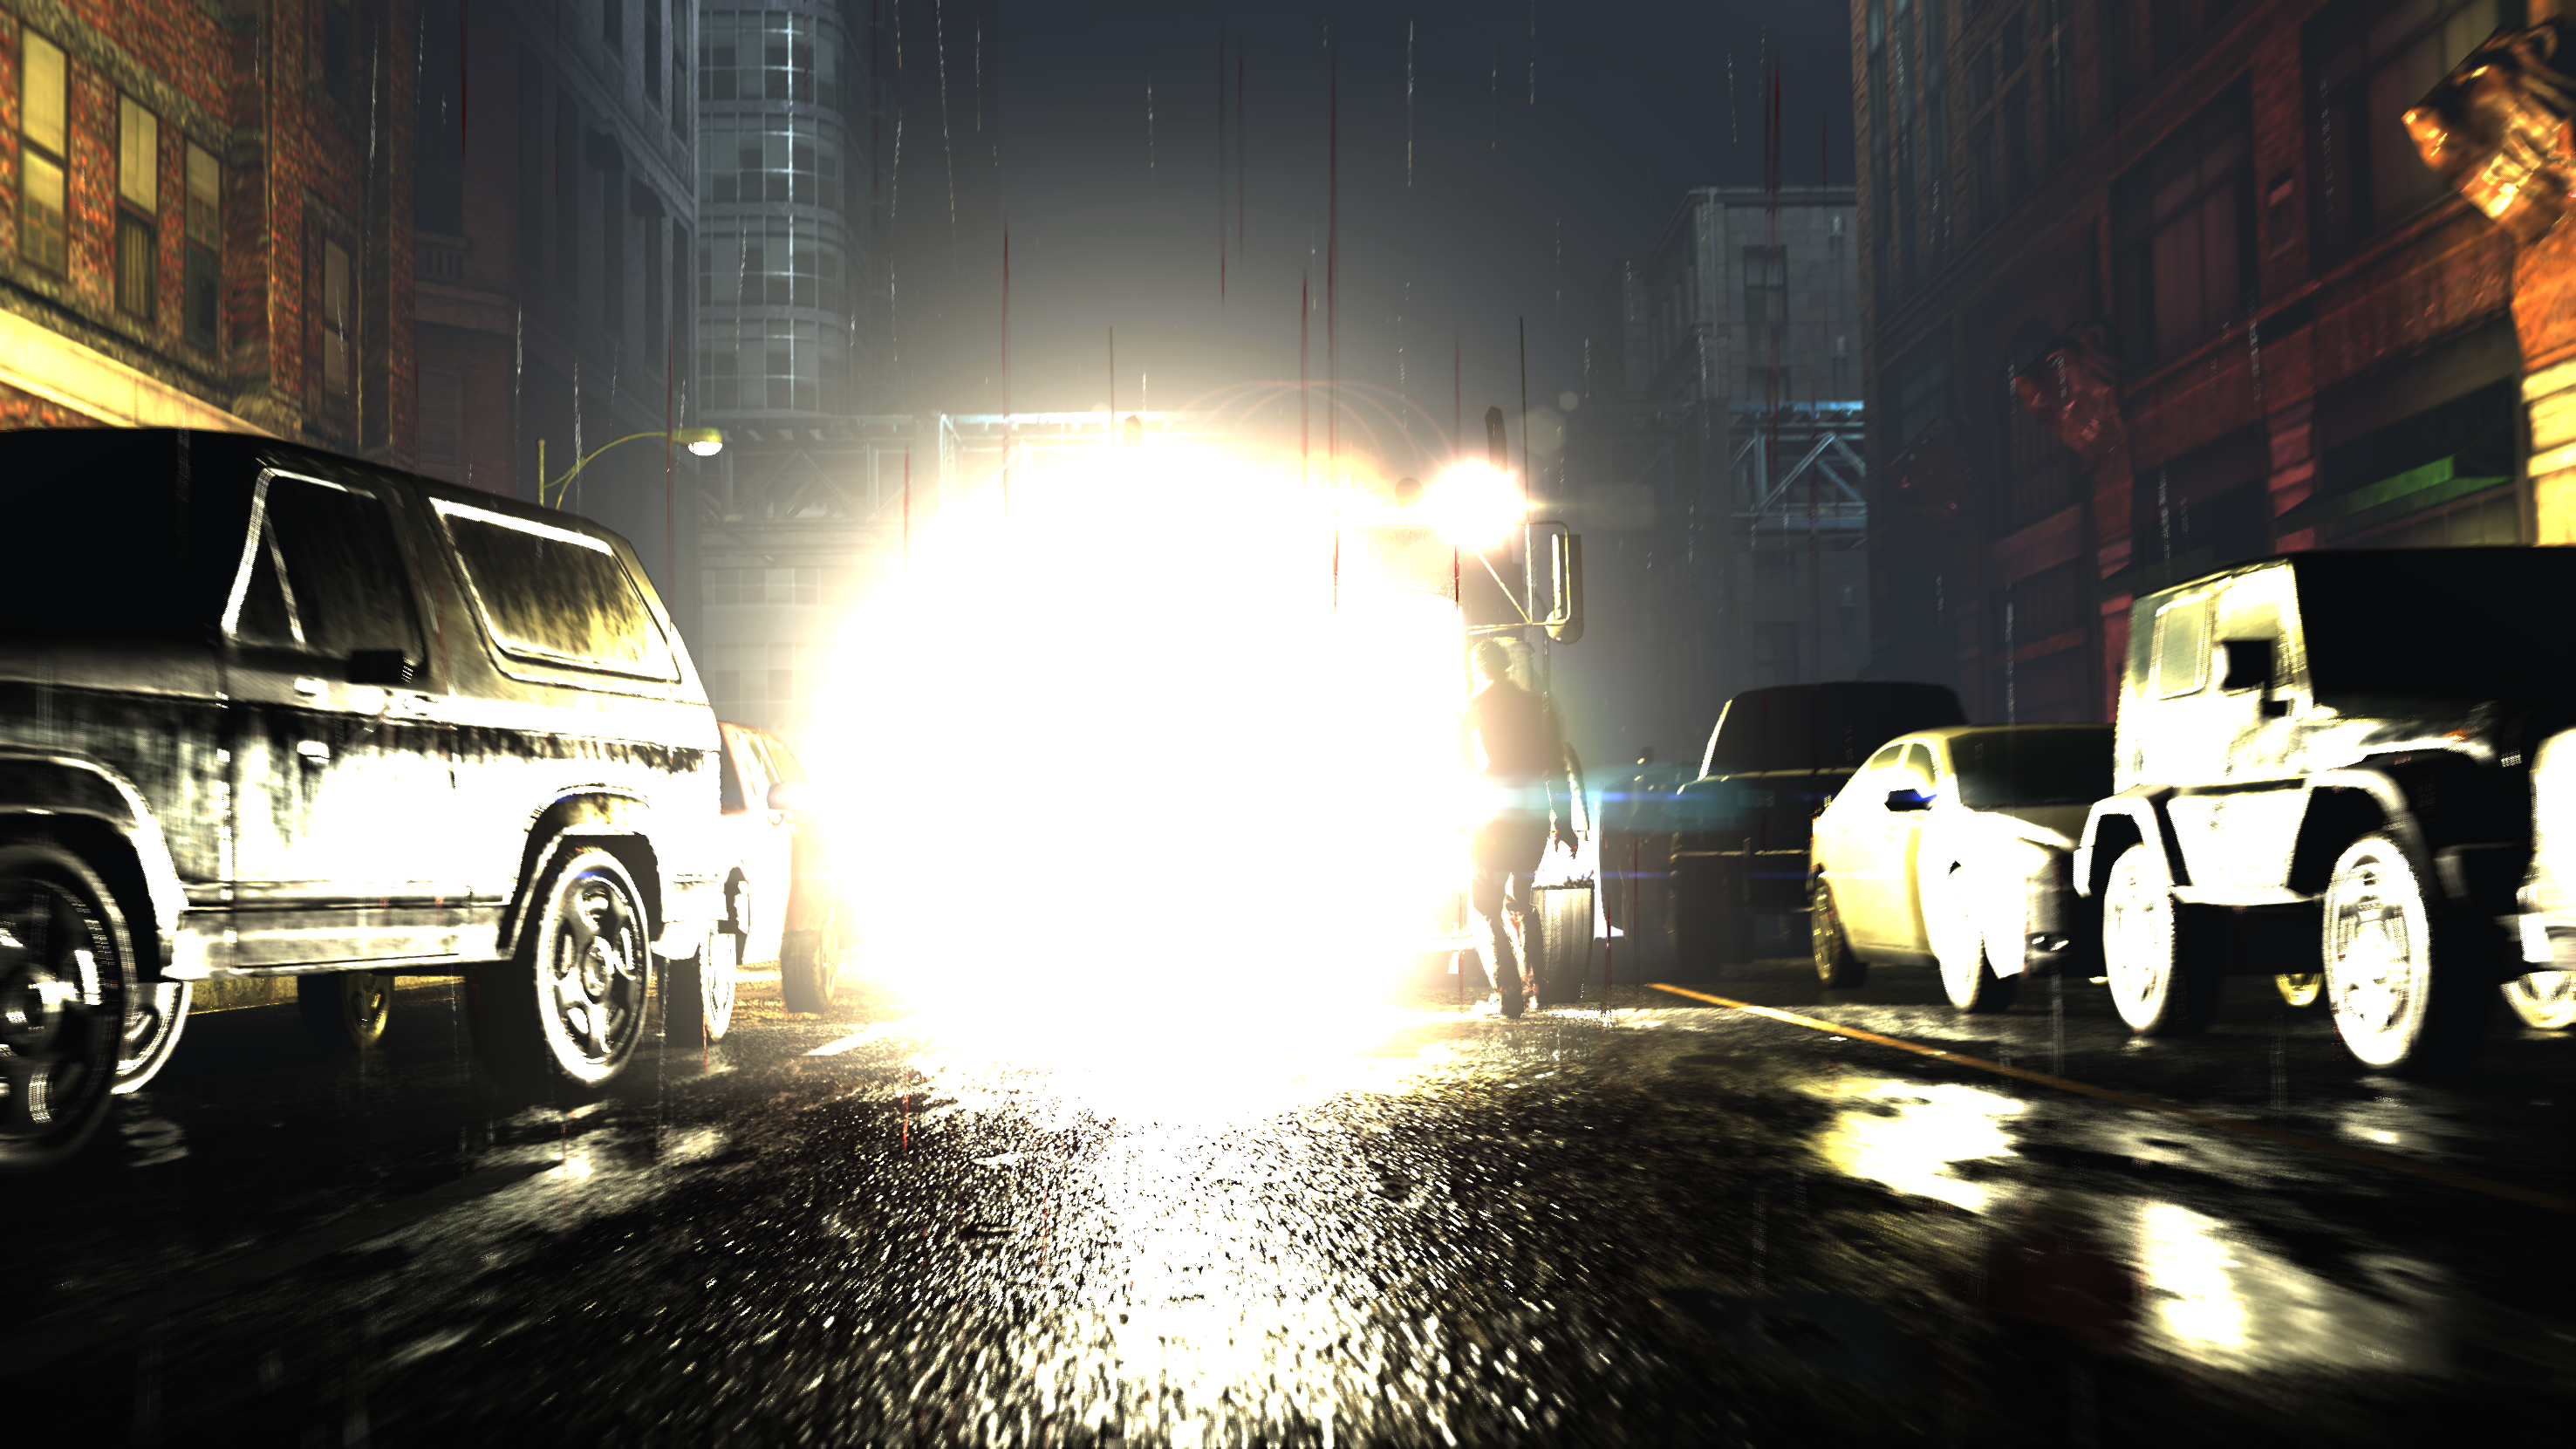
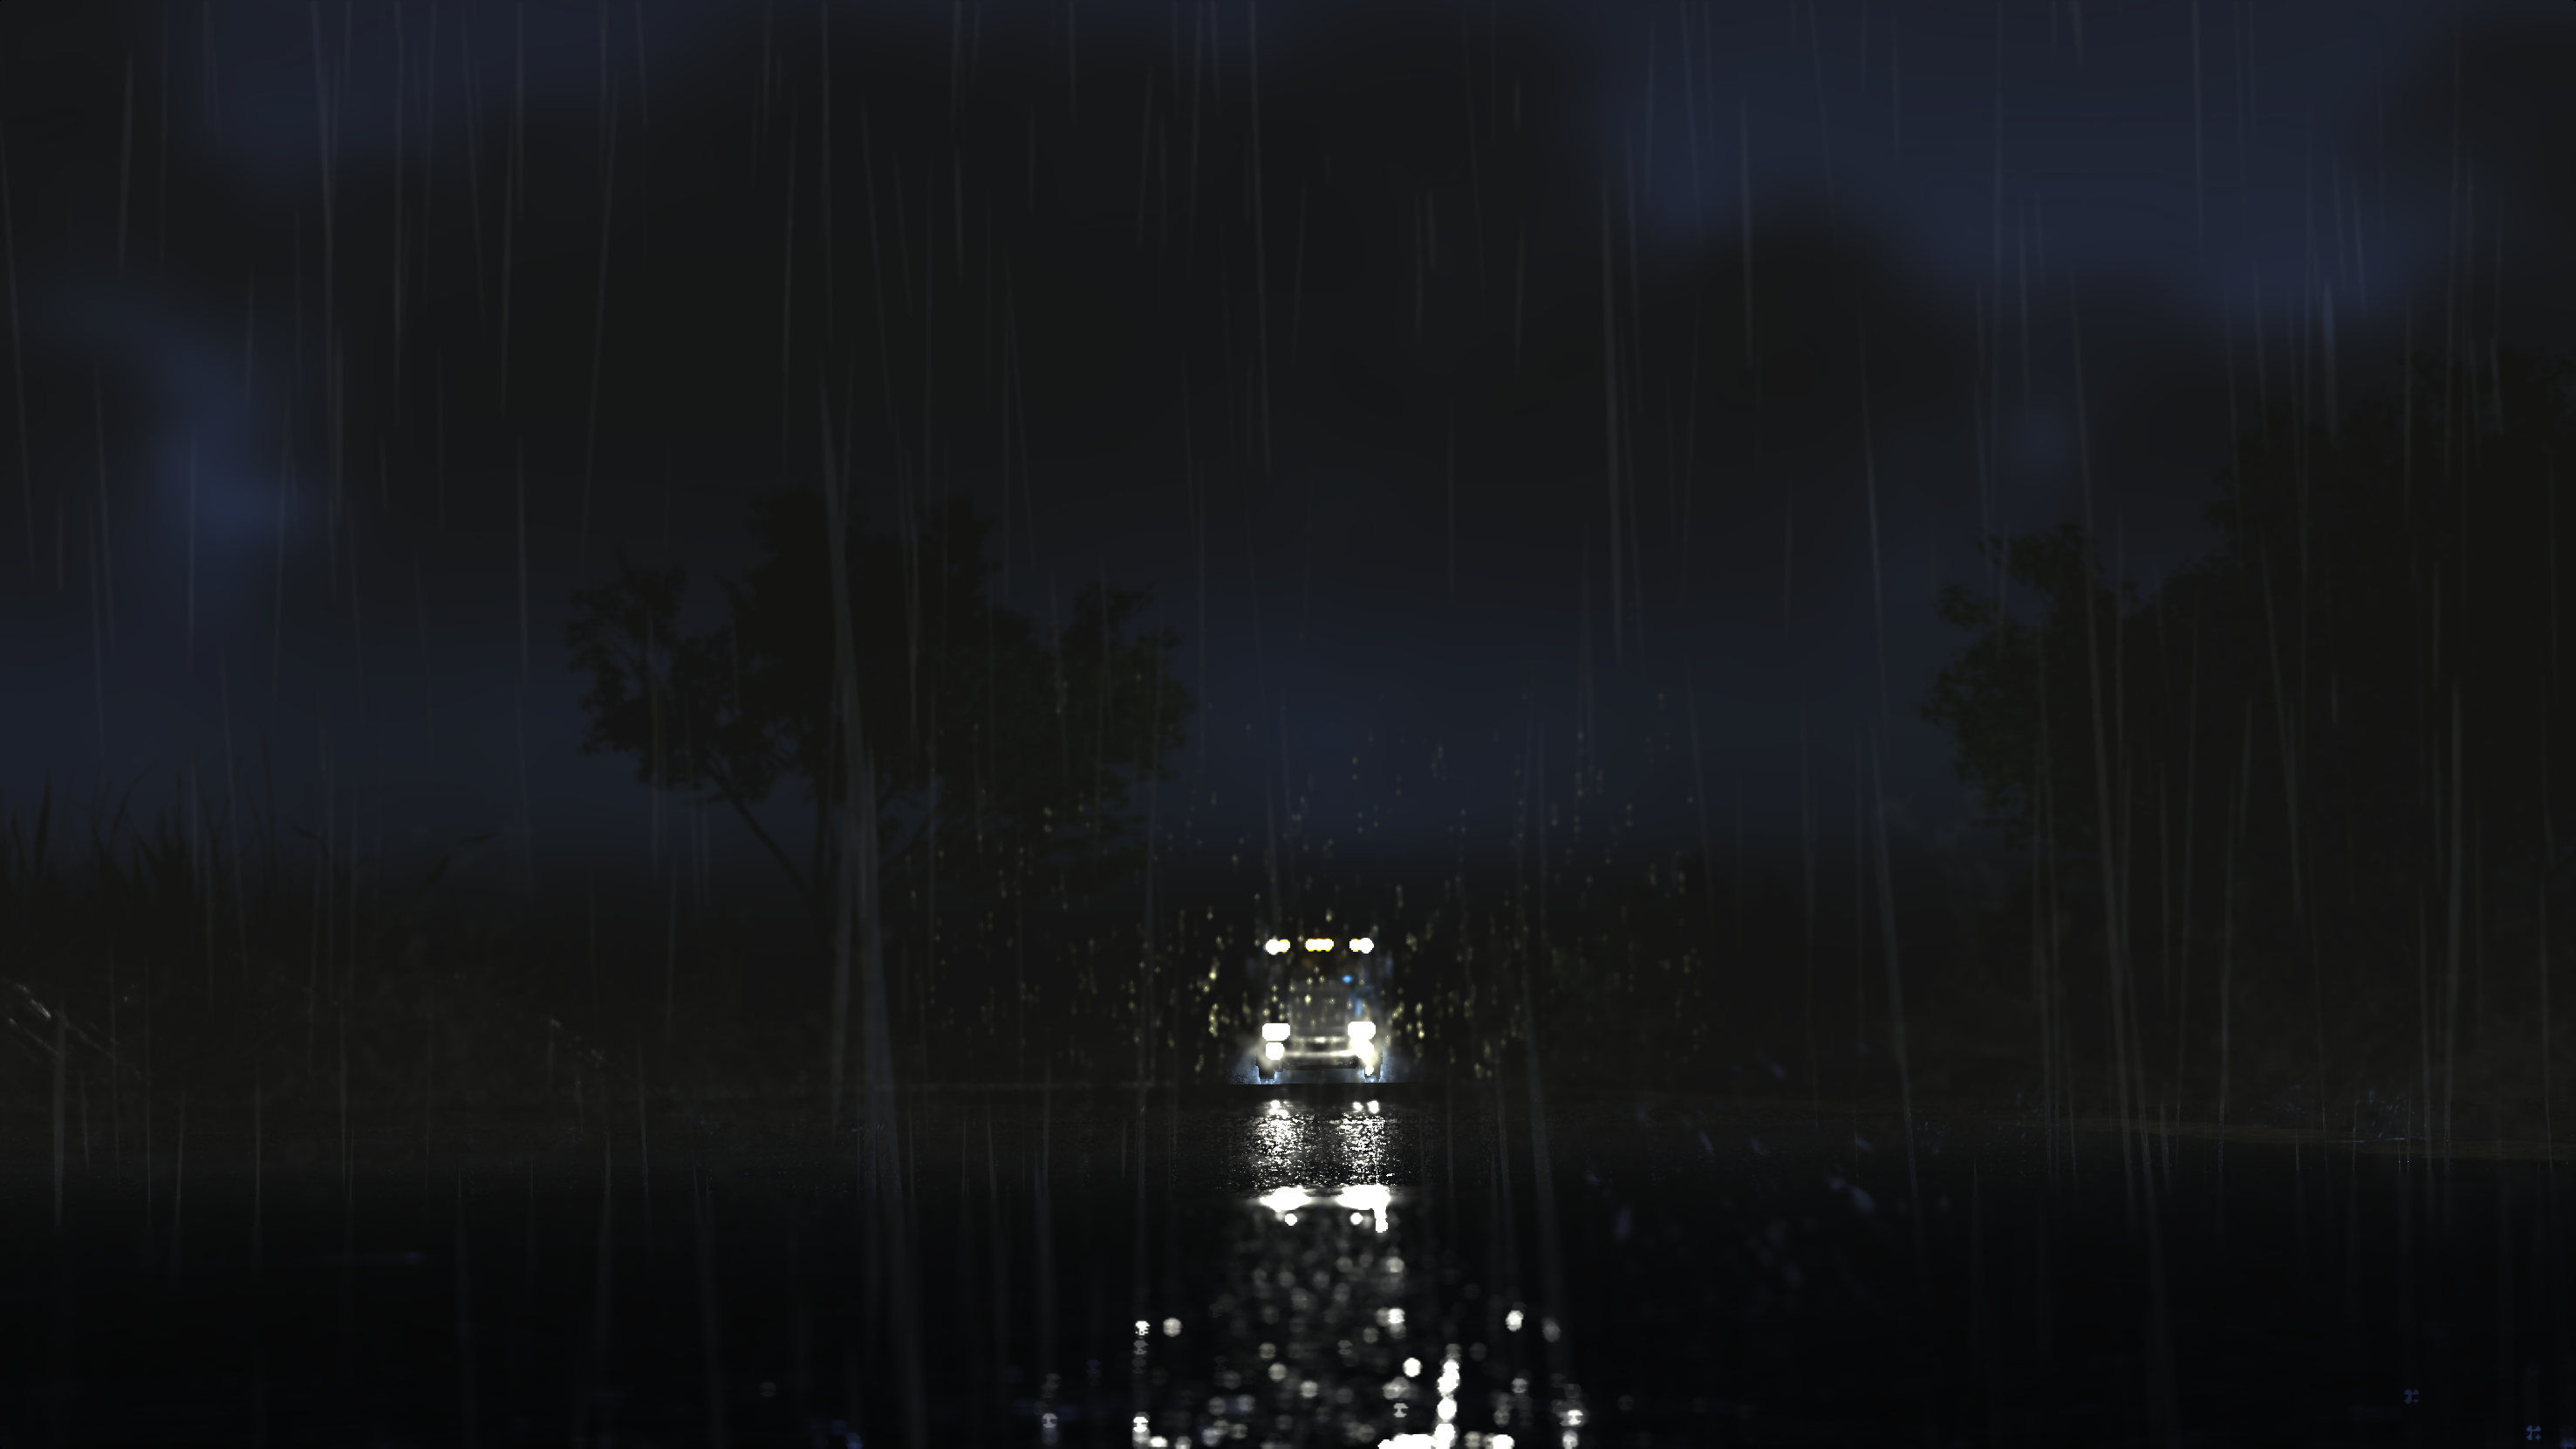
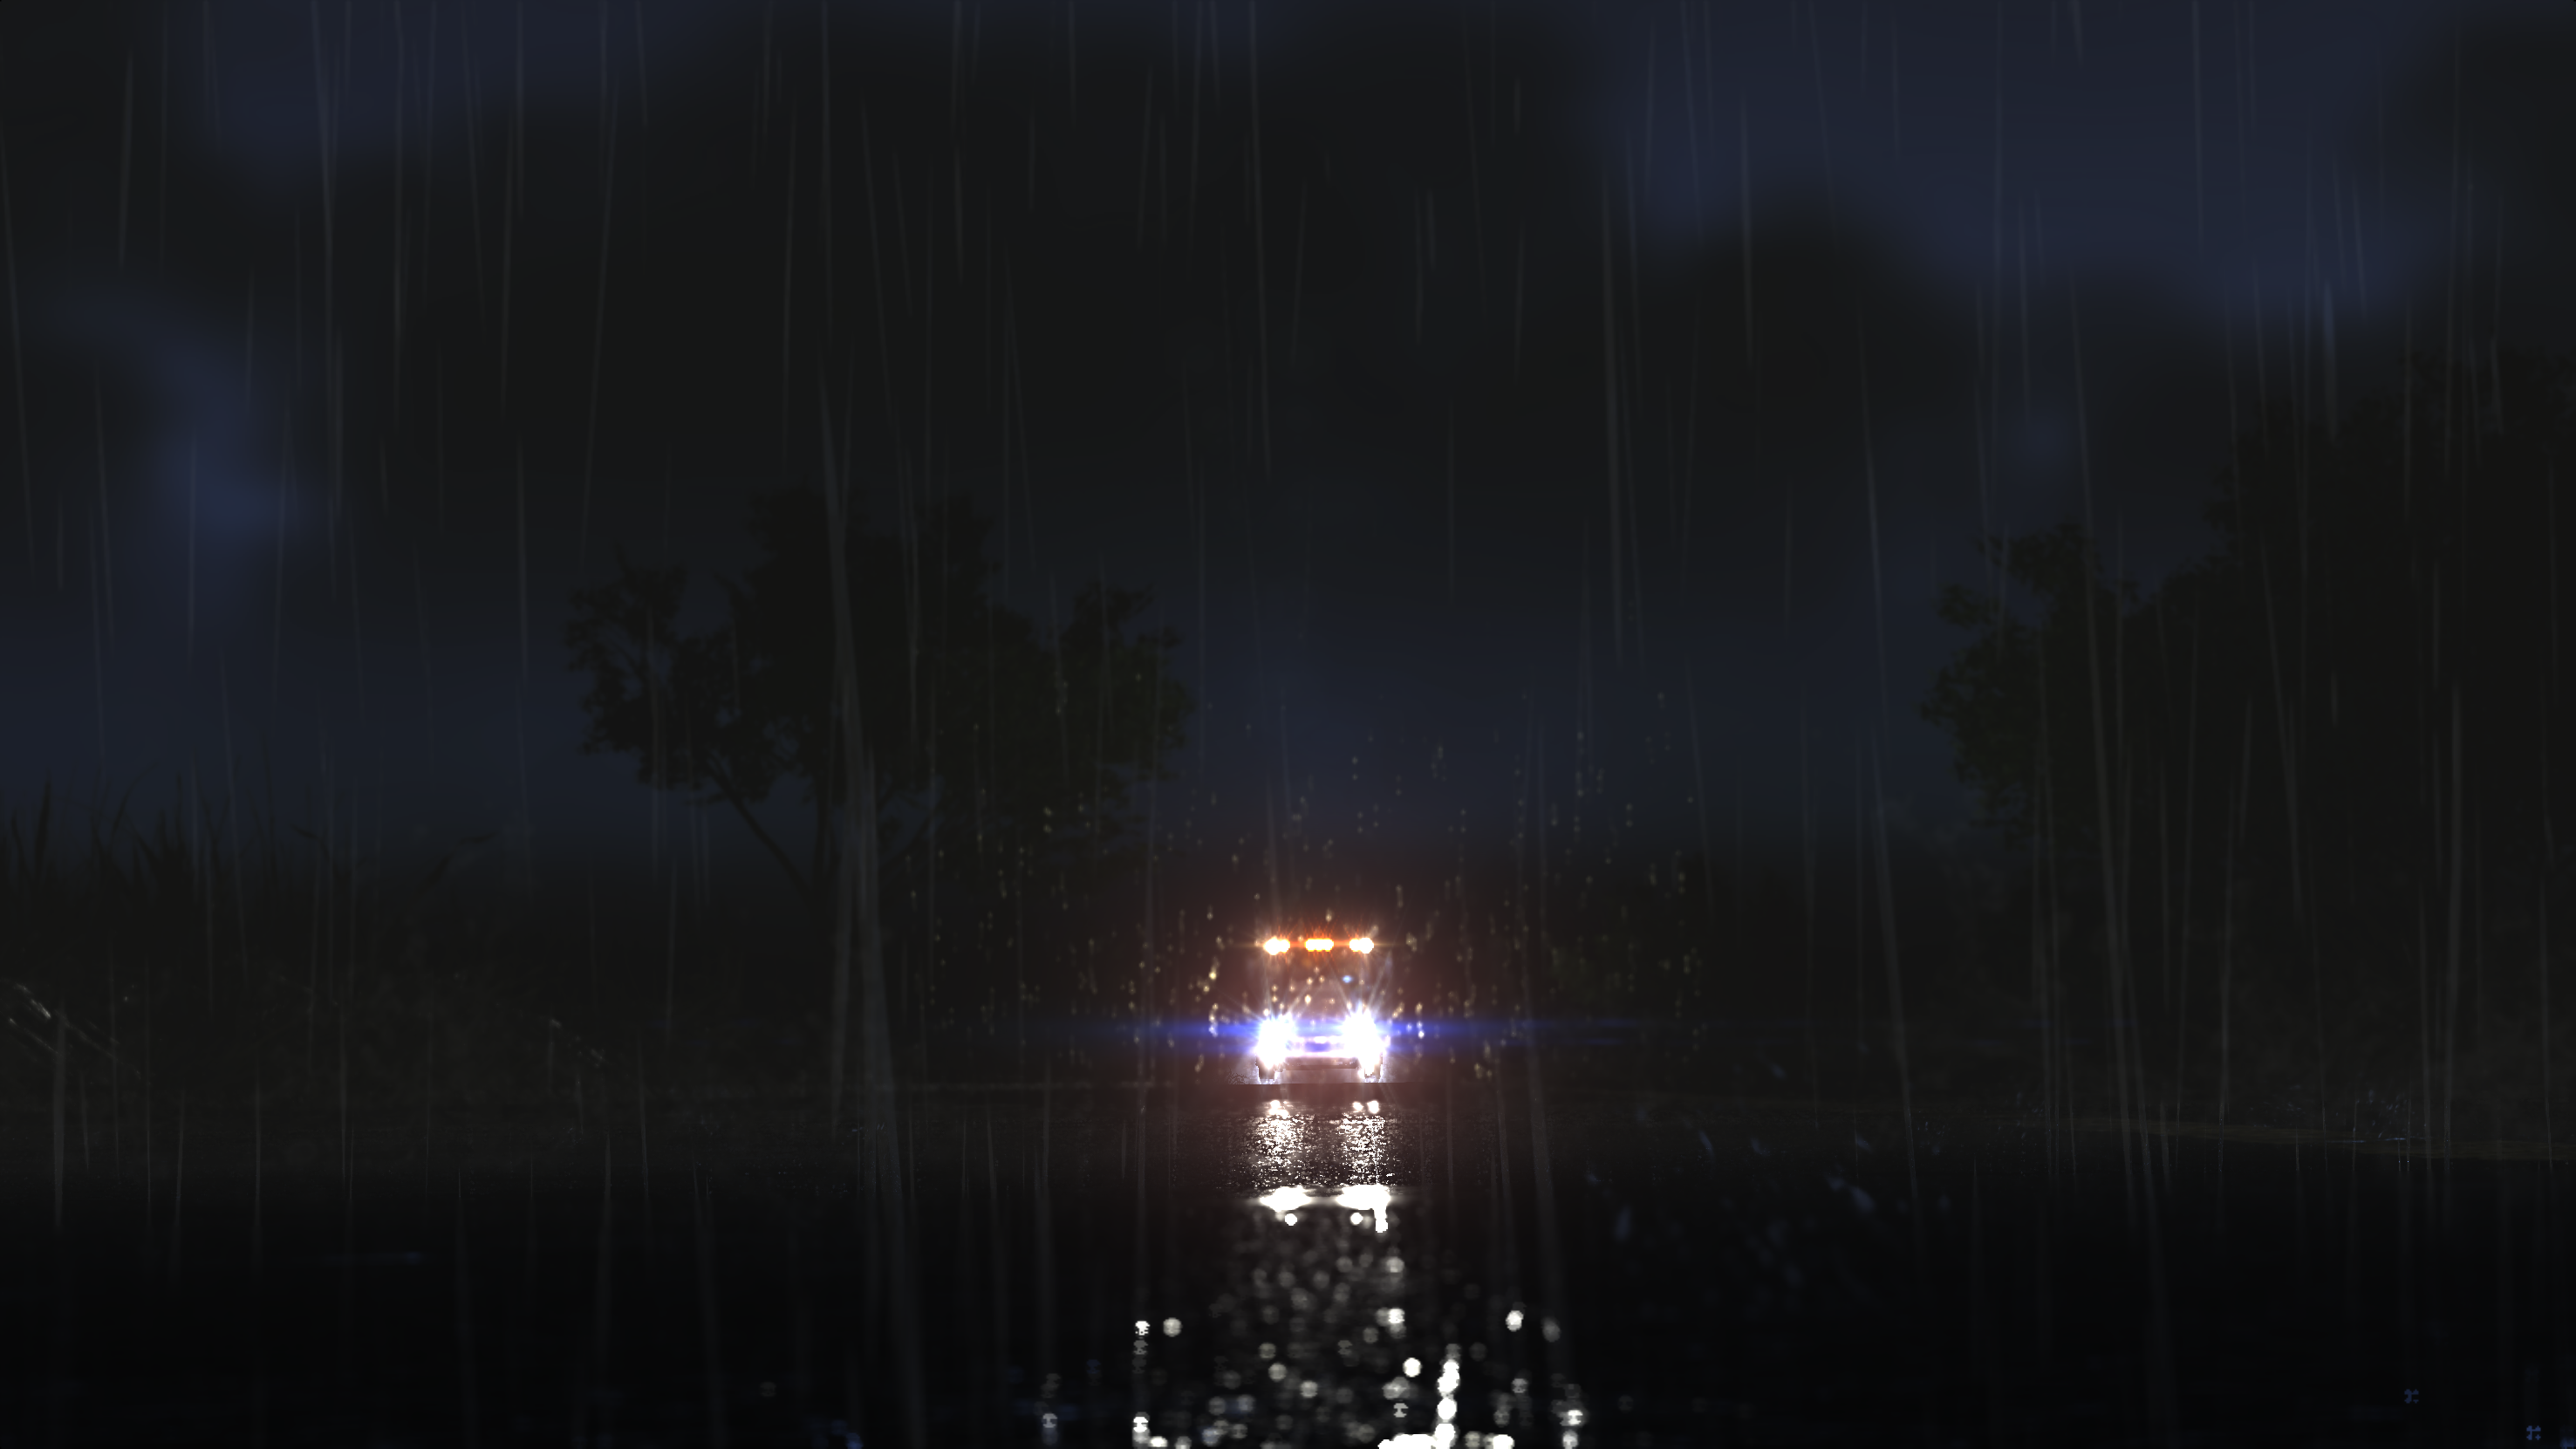

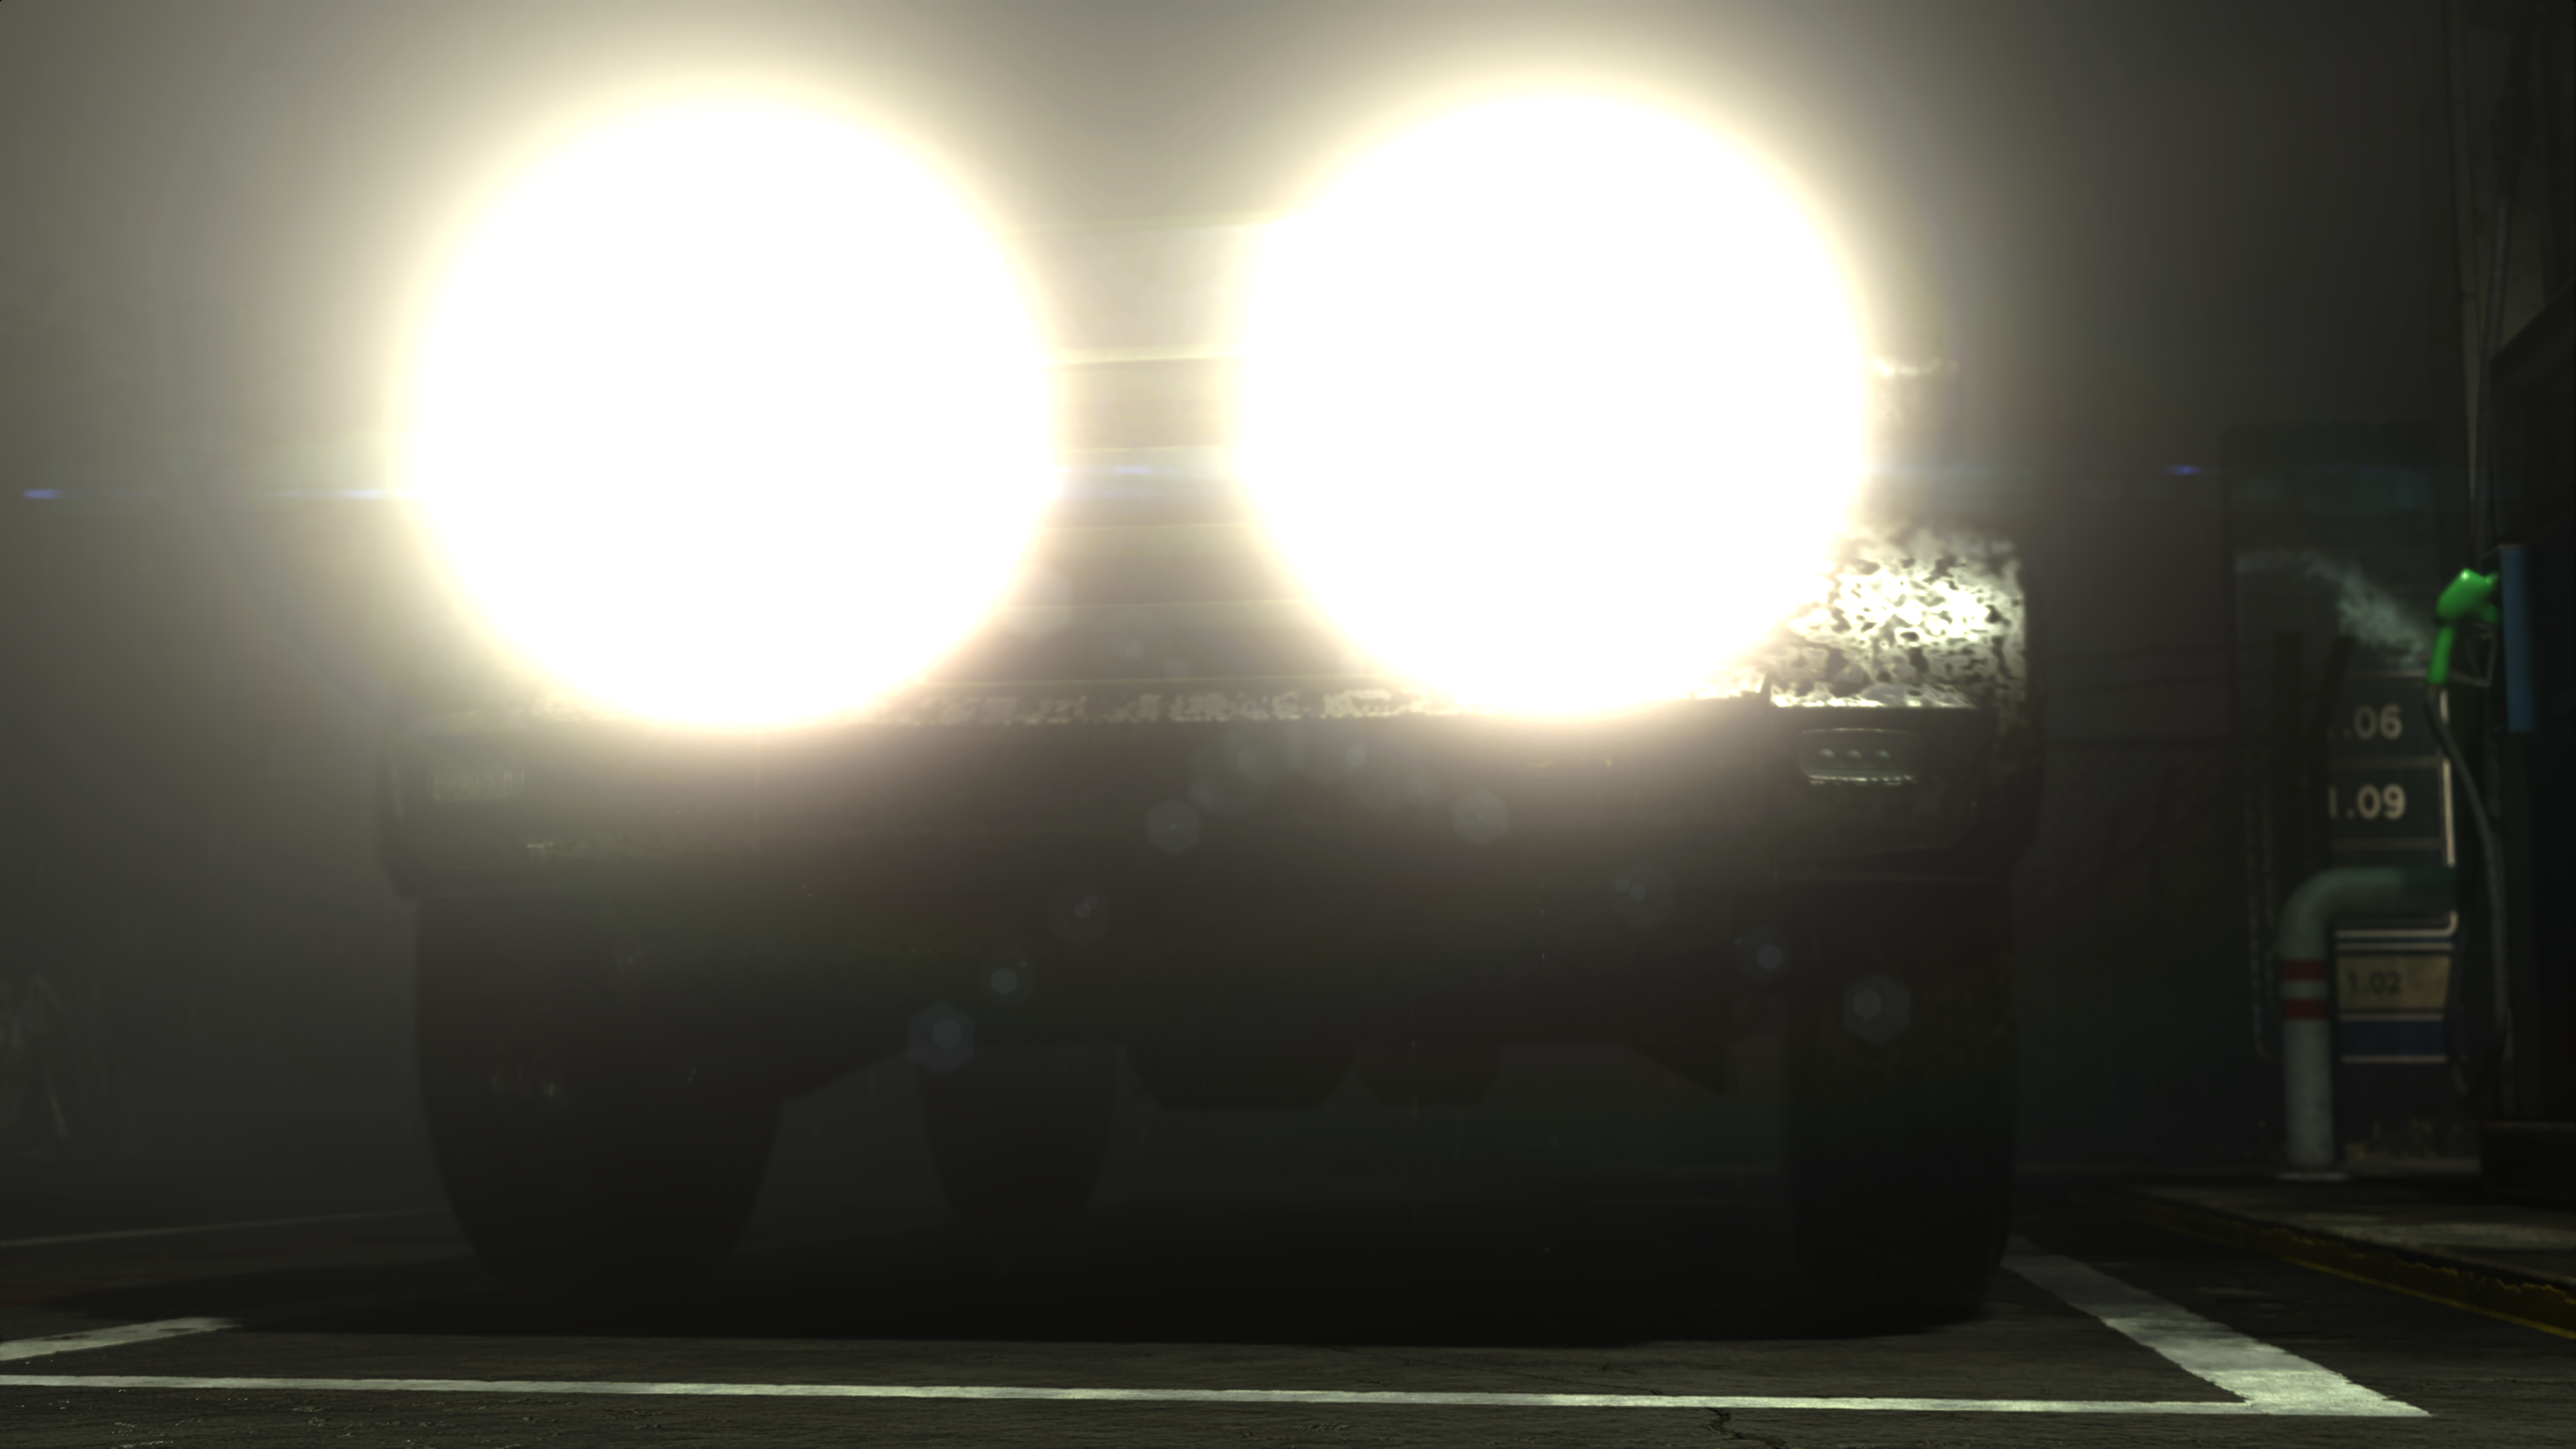
Soft Bloom
Bloom takes place on 7 steps back and forth (total of 14 steps, 7 down where dividing by 1/2, and 7 steps going back up where multiplying by 2), the output of each step, is used as an input for the following step.


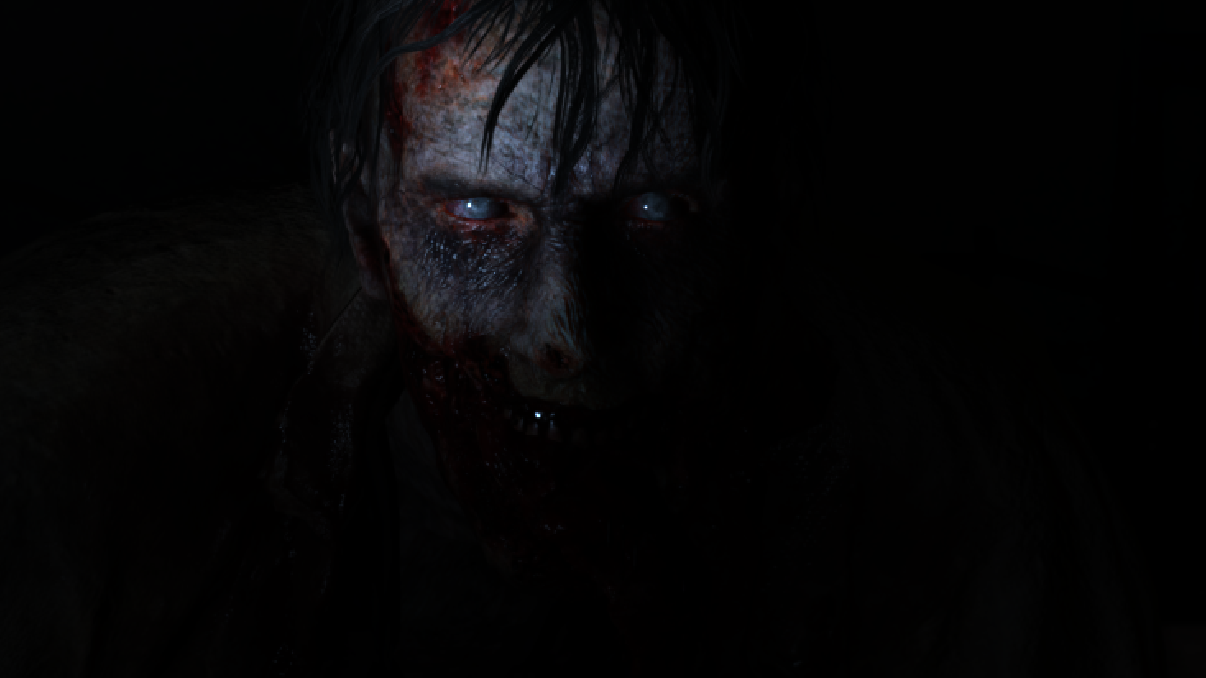

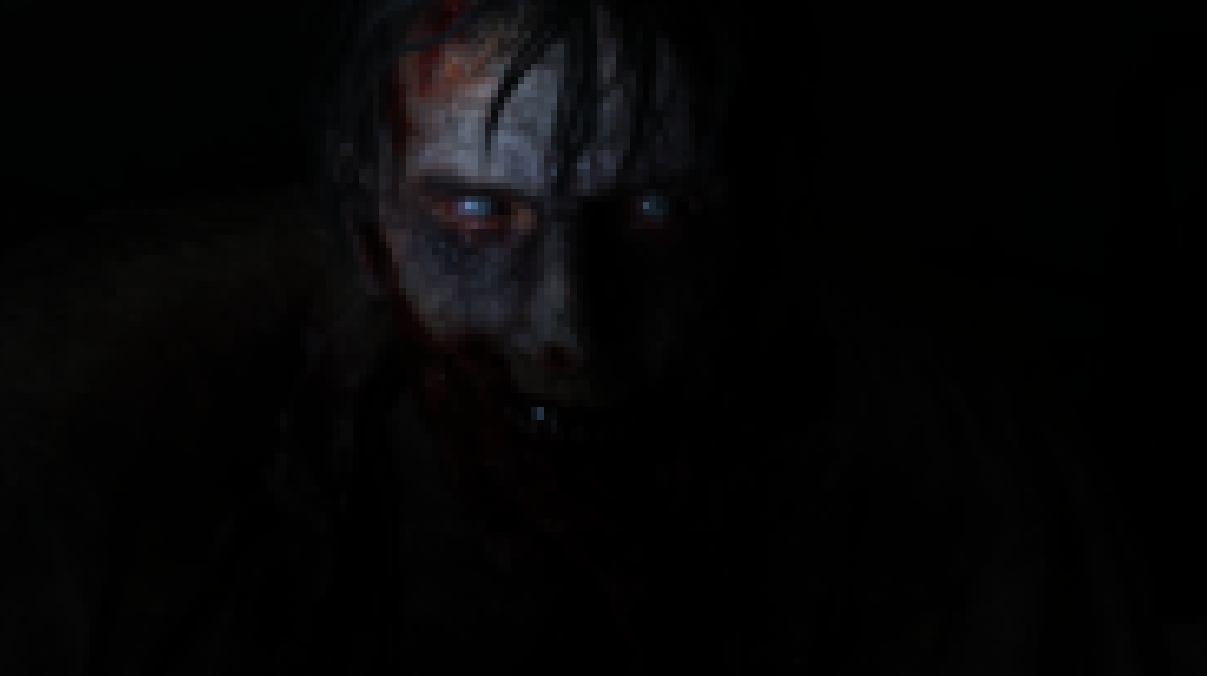


Those ones above are custom “linearly” interpolated versions of what the GPU see. I scaled them up for better clarity. But if you seeking what “exactly” seen by the shader, it’s the ones below
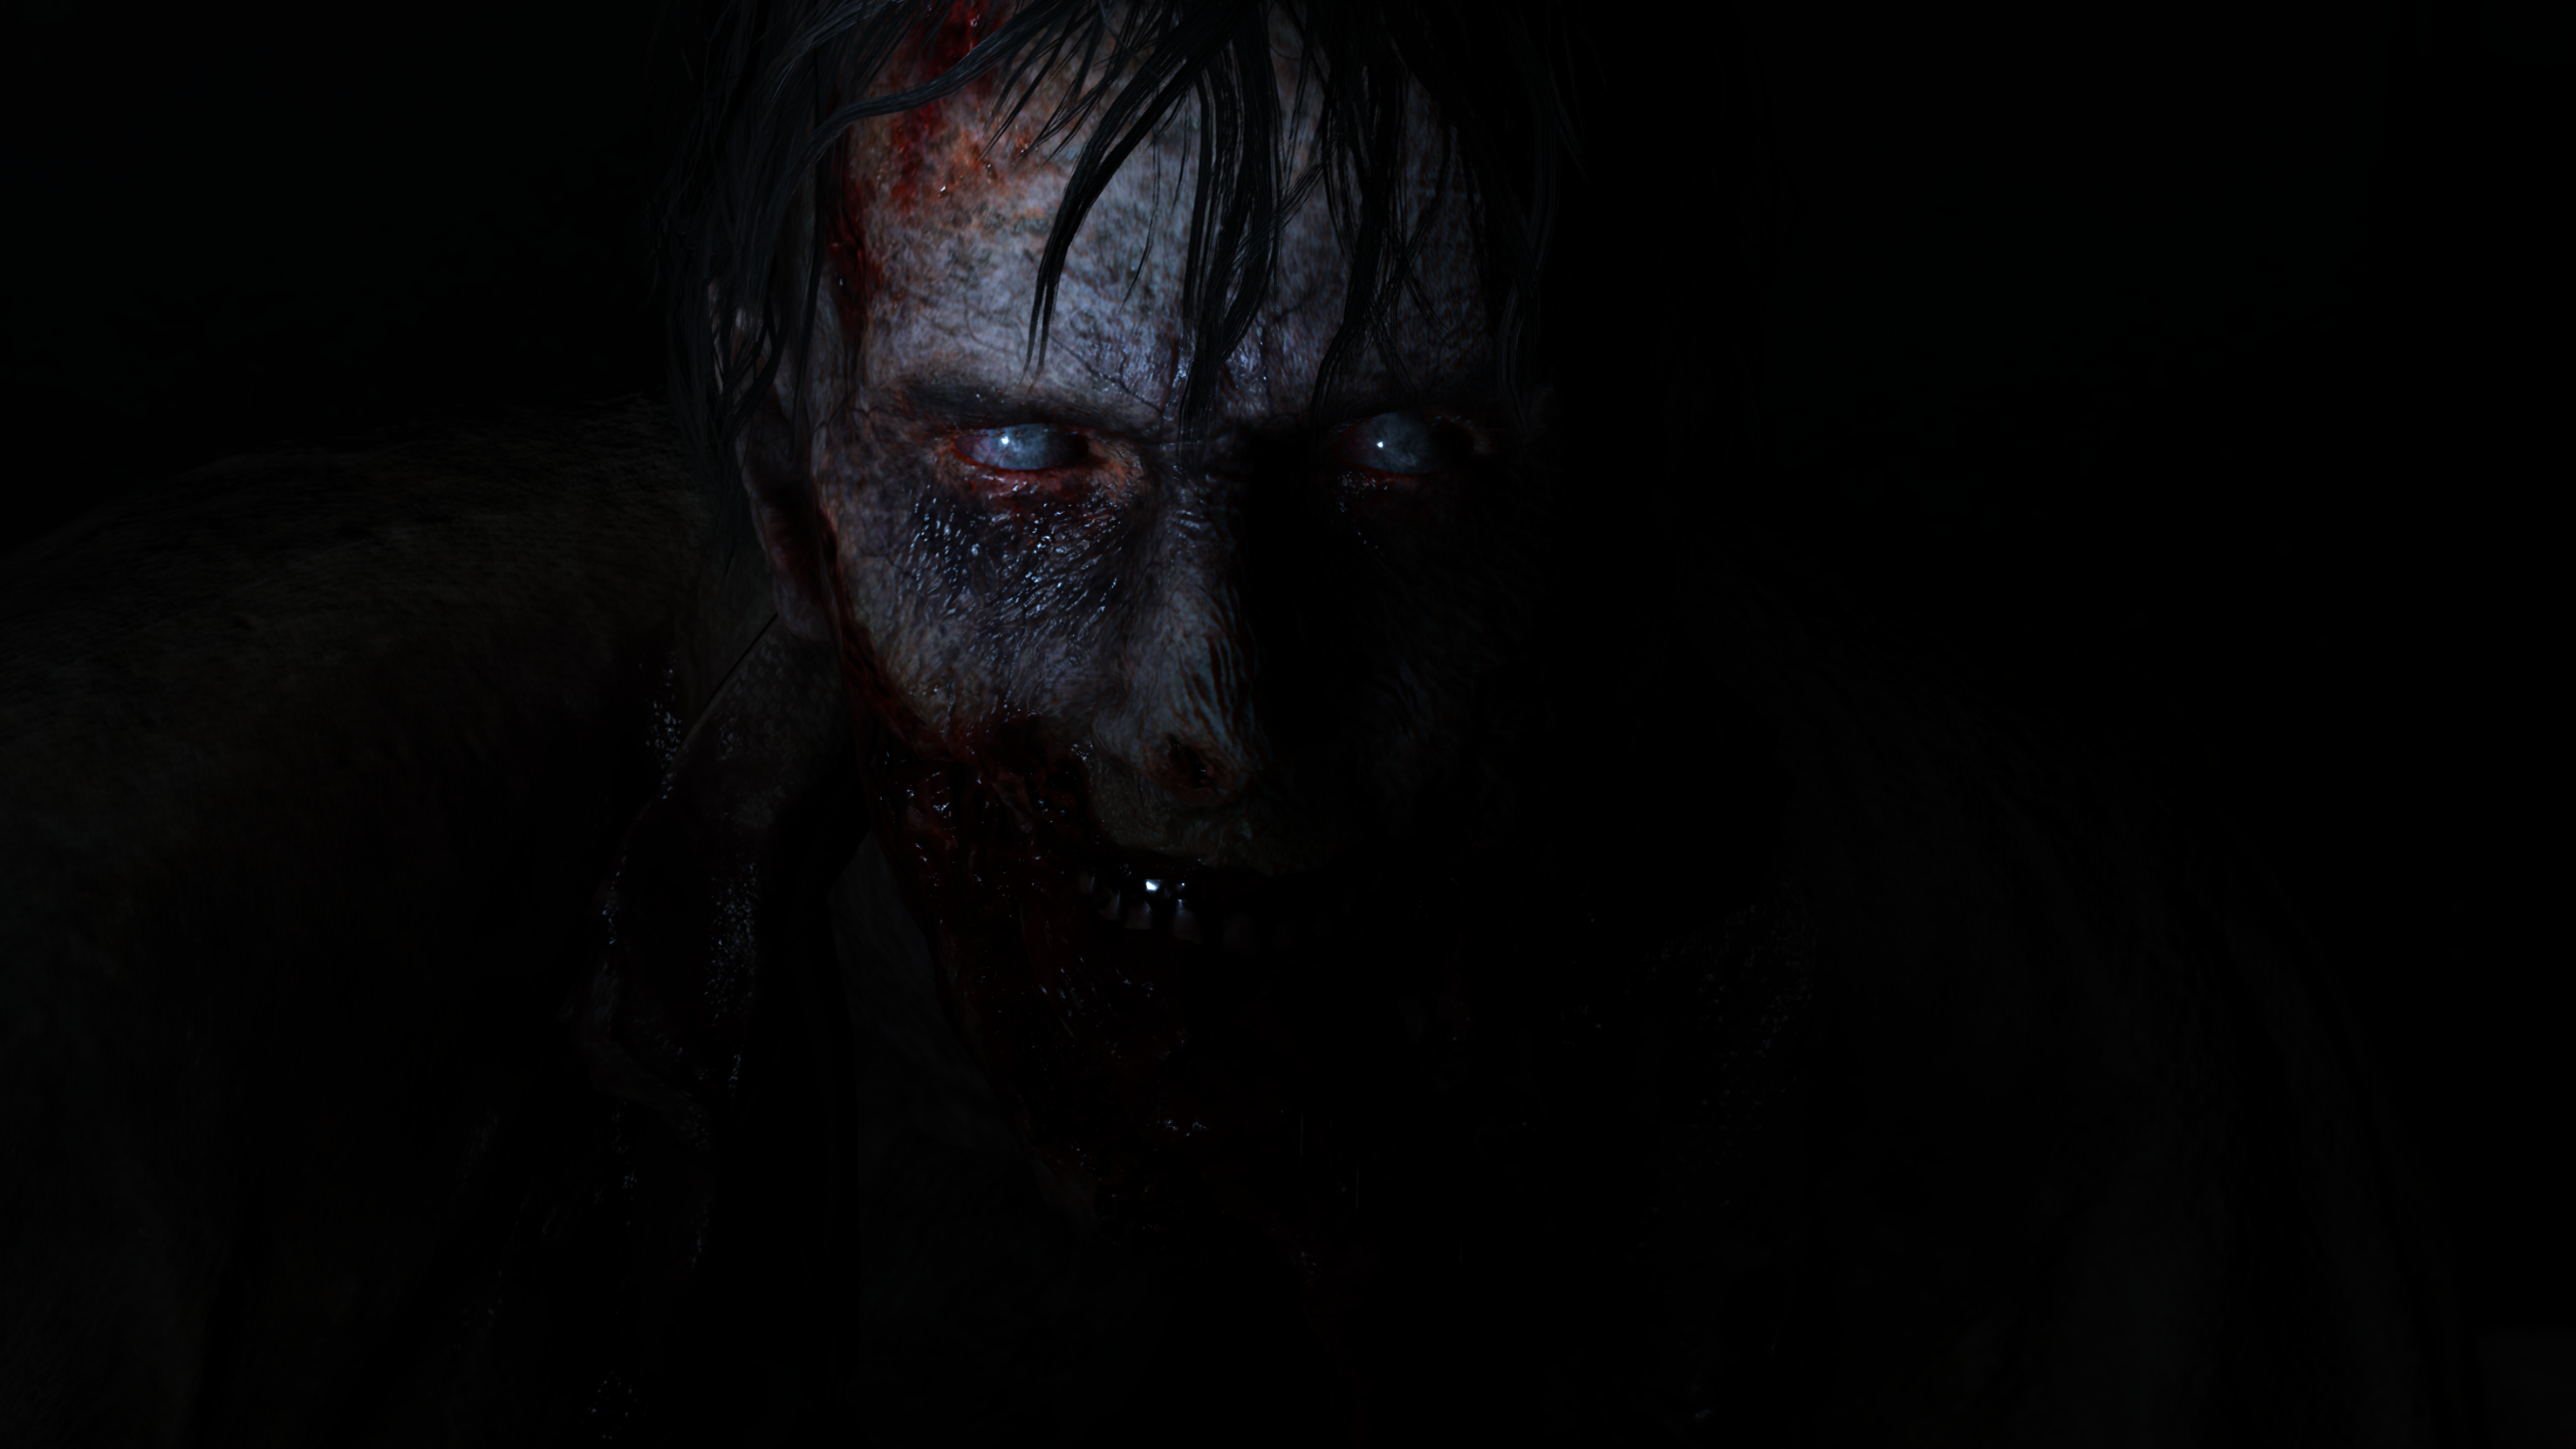


The 14th step is (as expected) giving out a render resolution (not output/present resolution) image which in my case is 2953*1661, which is slightly different from the 1st input we put into the 1st soft bloom step.


Bloom may be not very effective in such a “dark” scene, even though it is settle and can be observed, but bloom have a huge impact in such a game when needed, Bloom by heart loves bright pixels, for example in such dark game, scenes with fire, neon lights or cars headlights. Below are few examples for bloom when it really shines. The images below showing how the frame looks at the start of the bloom steps, at the end of the bloom steps as well as the final swapchain (don’t mind the lens distortion in the swapchain image).


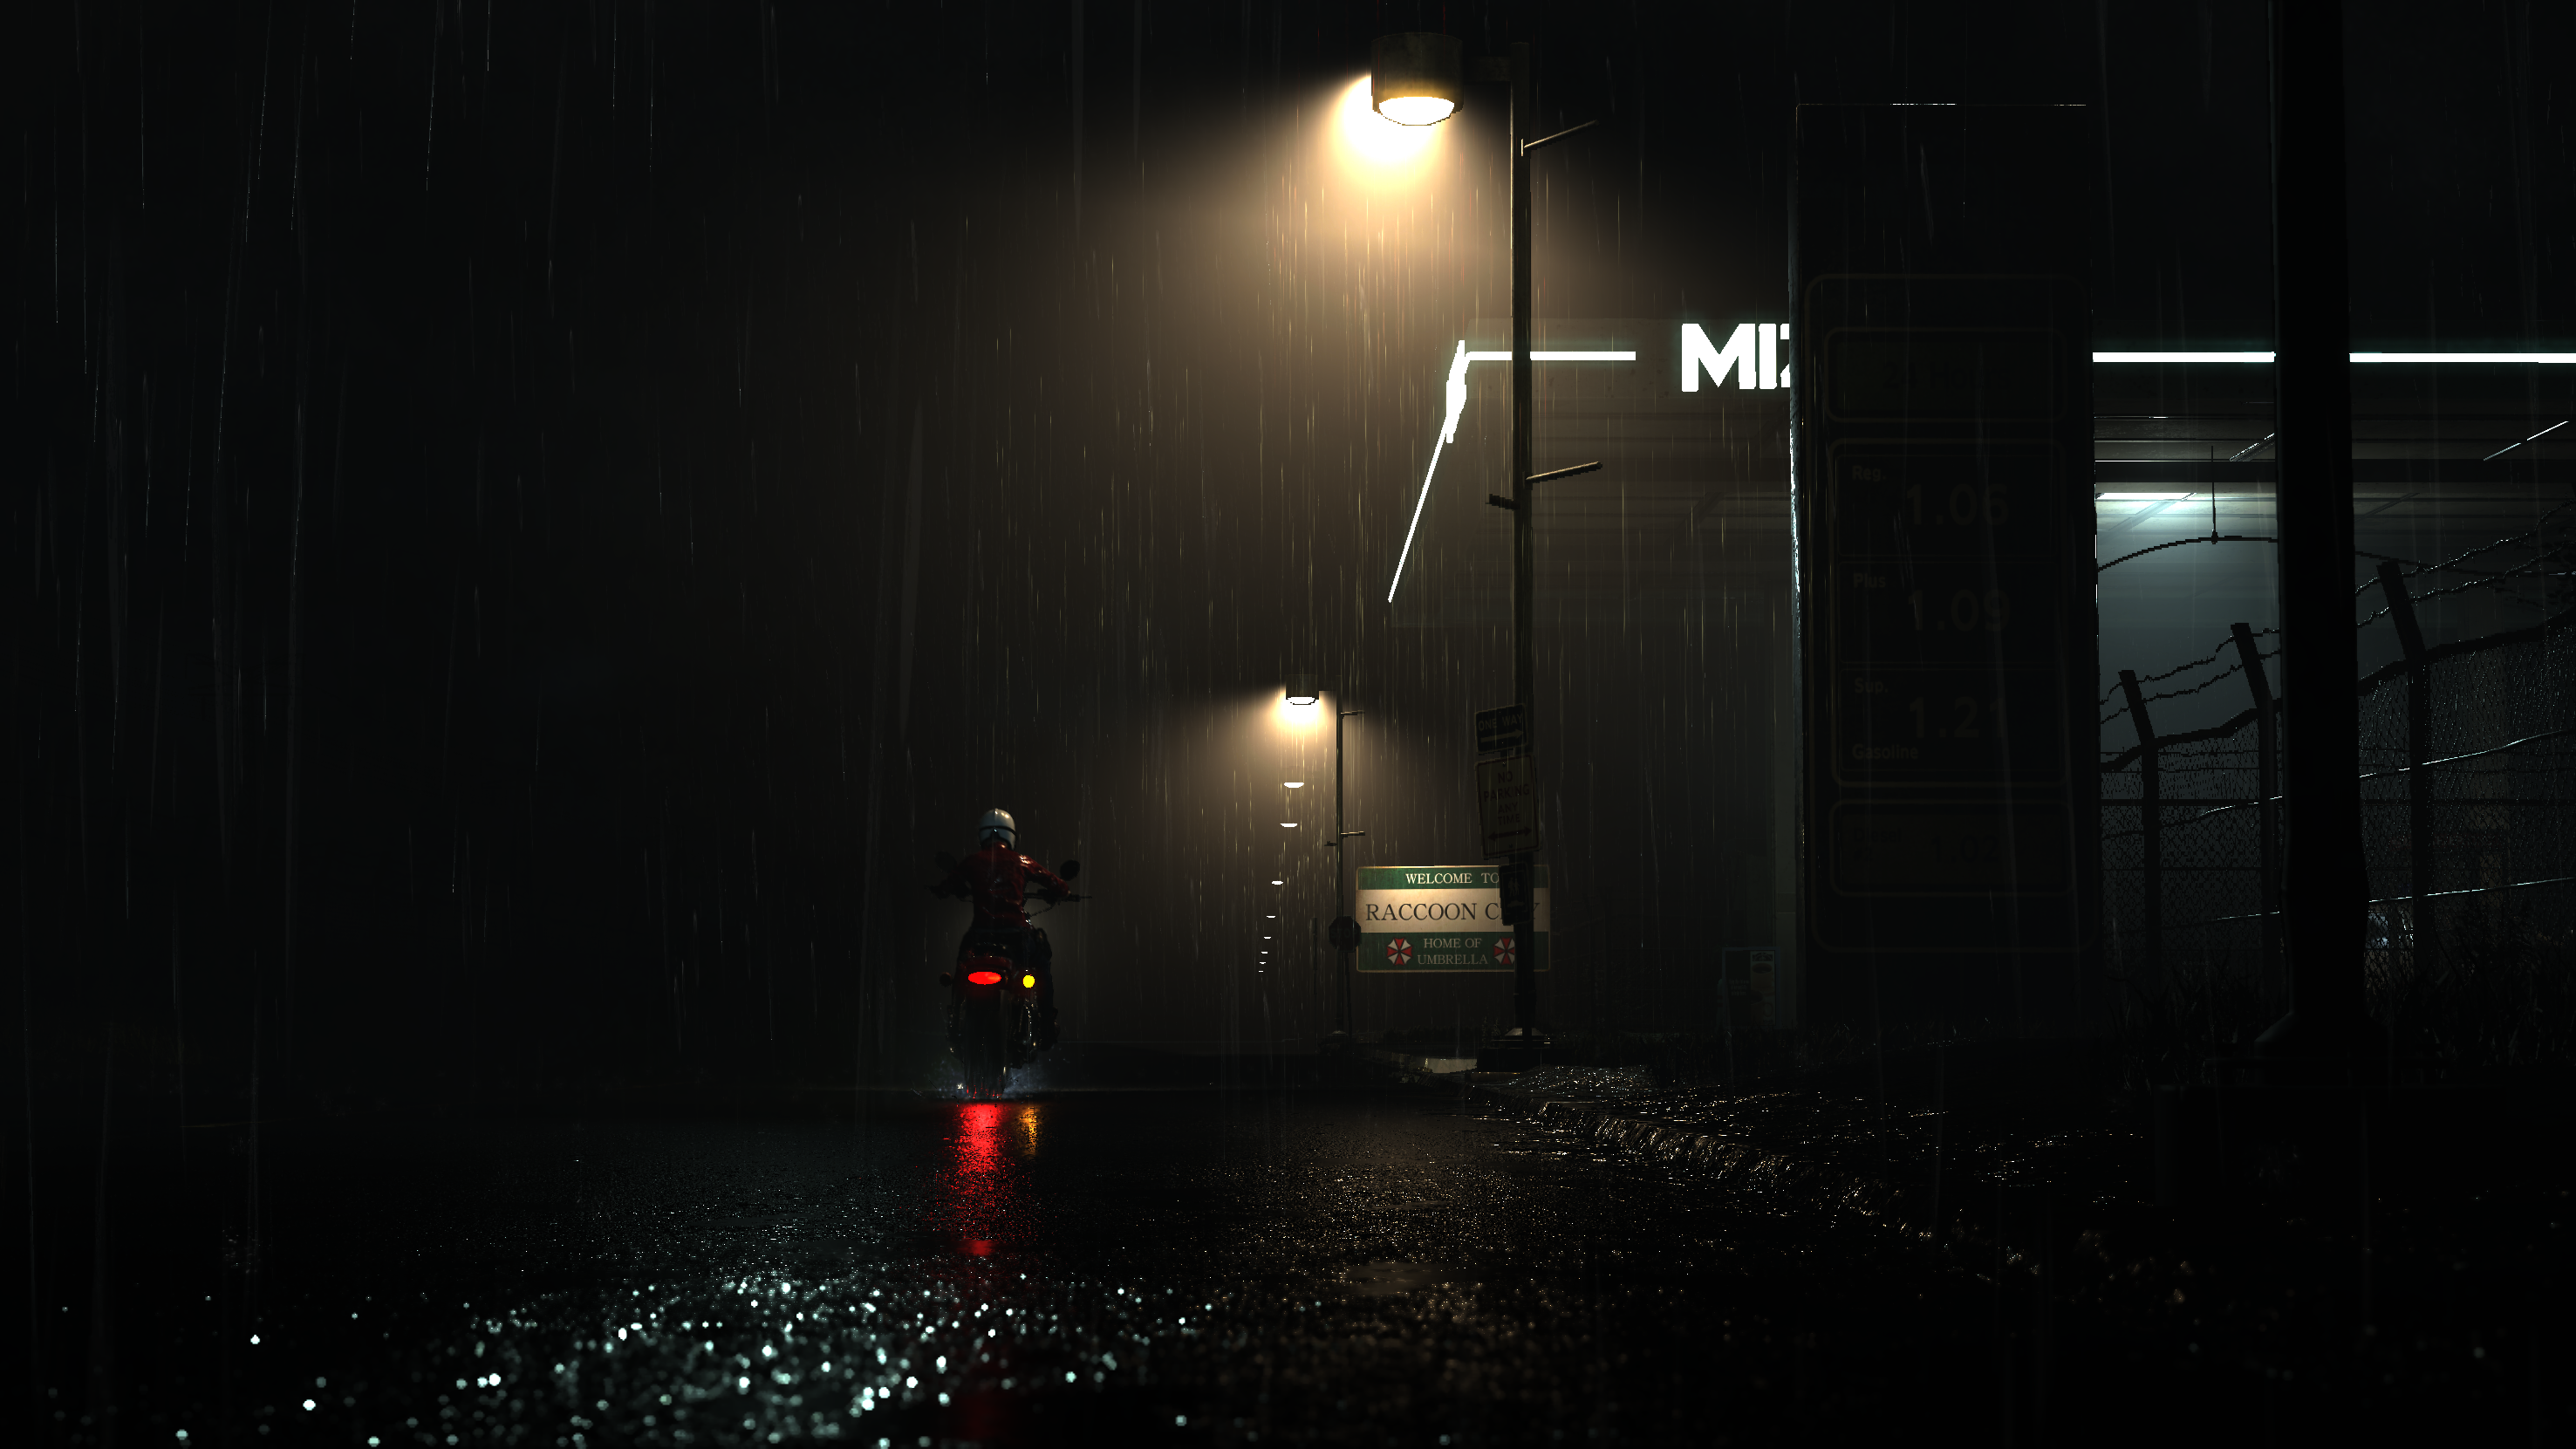
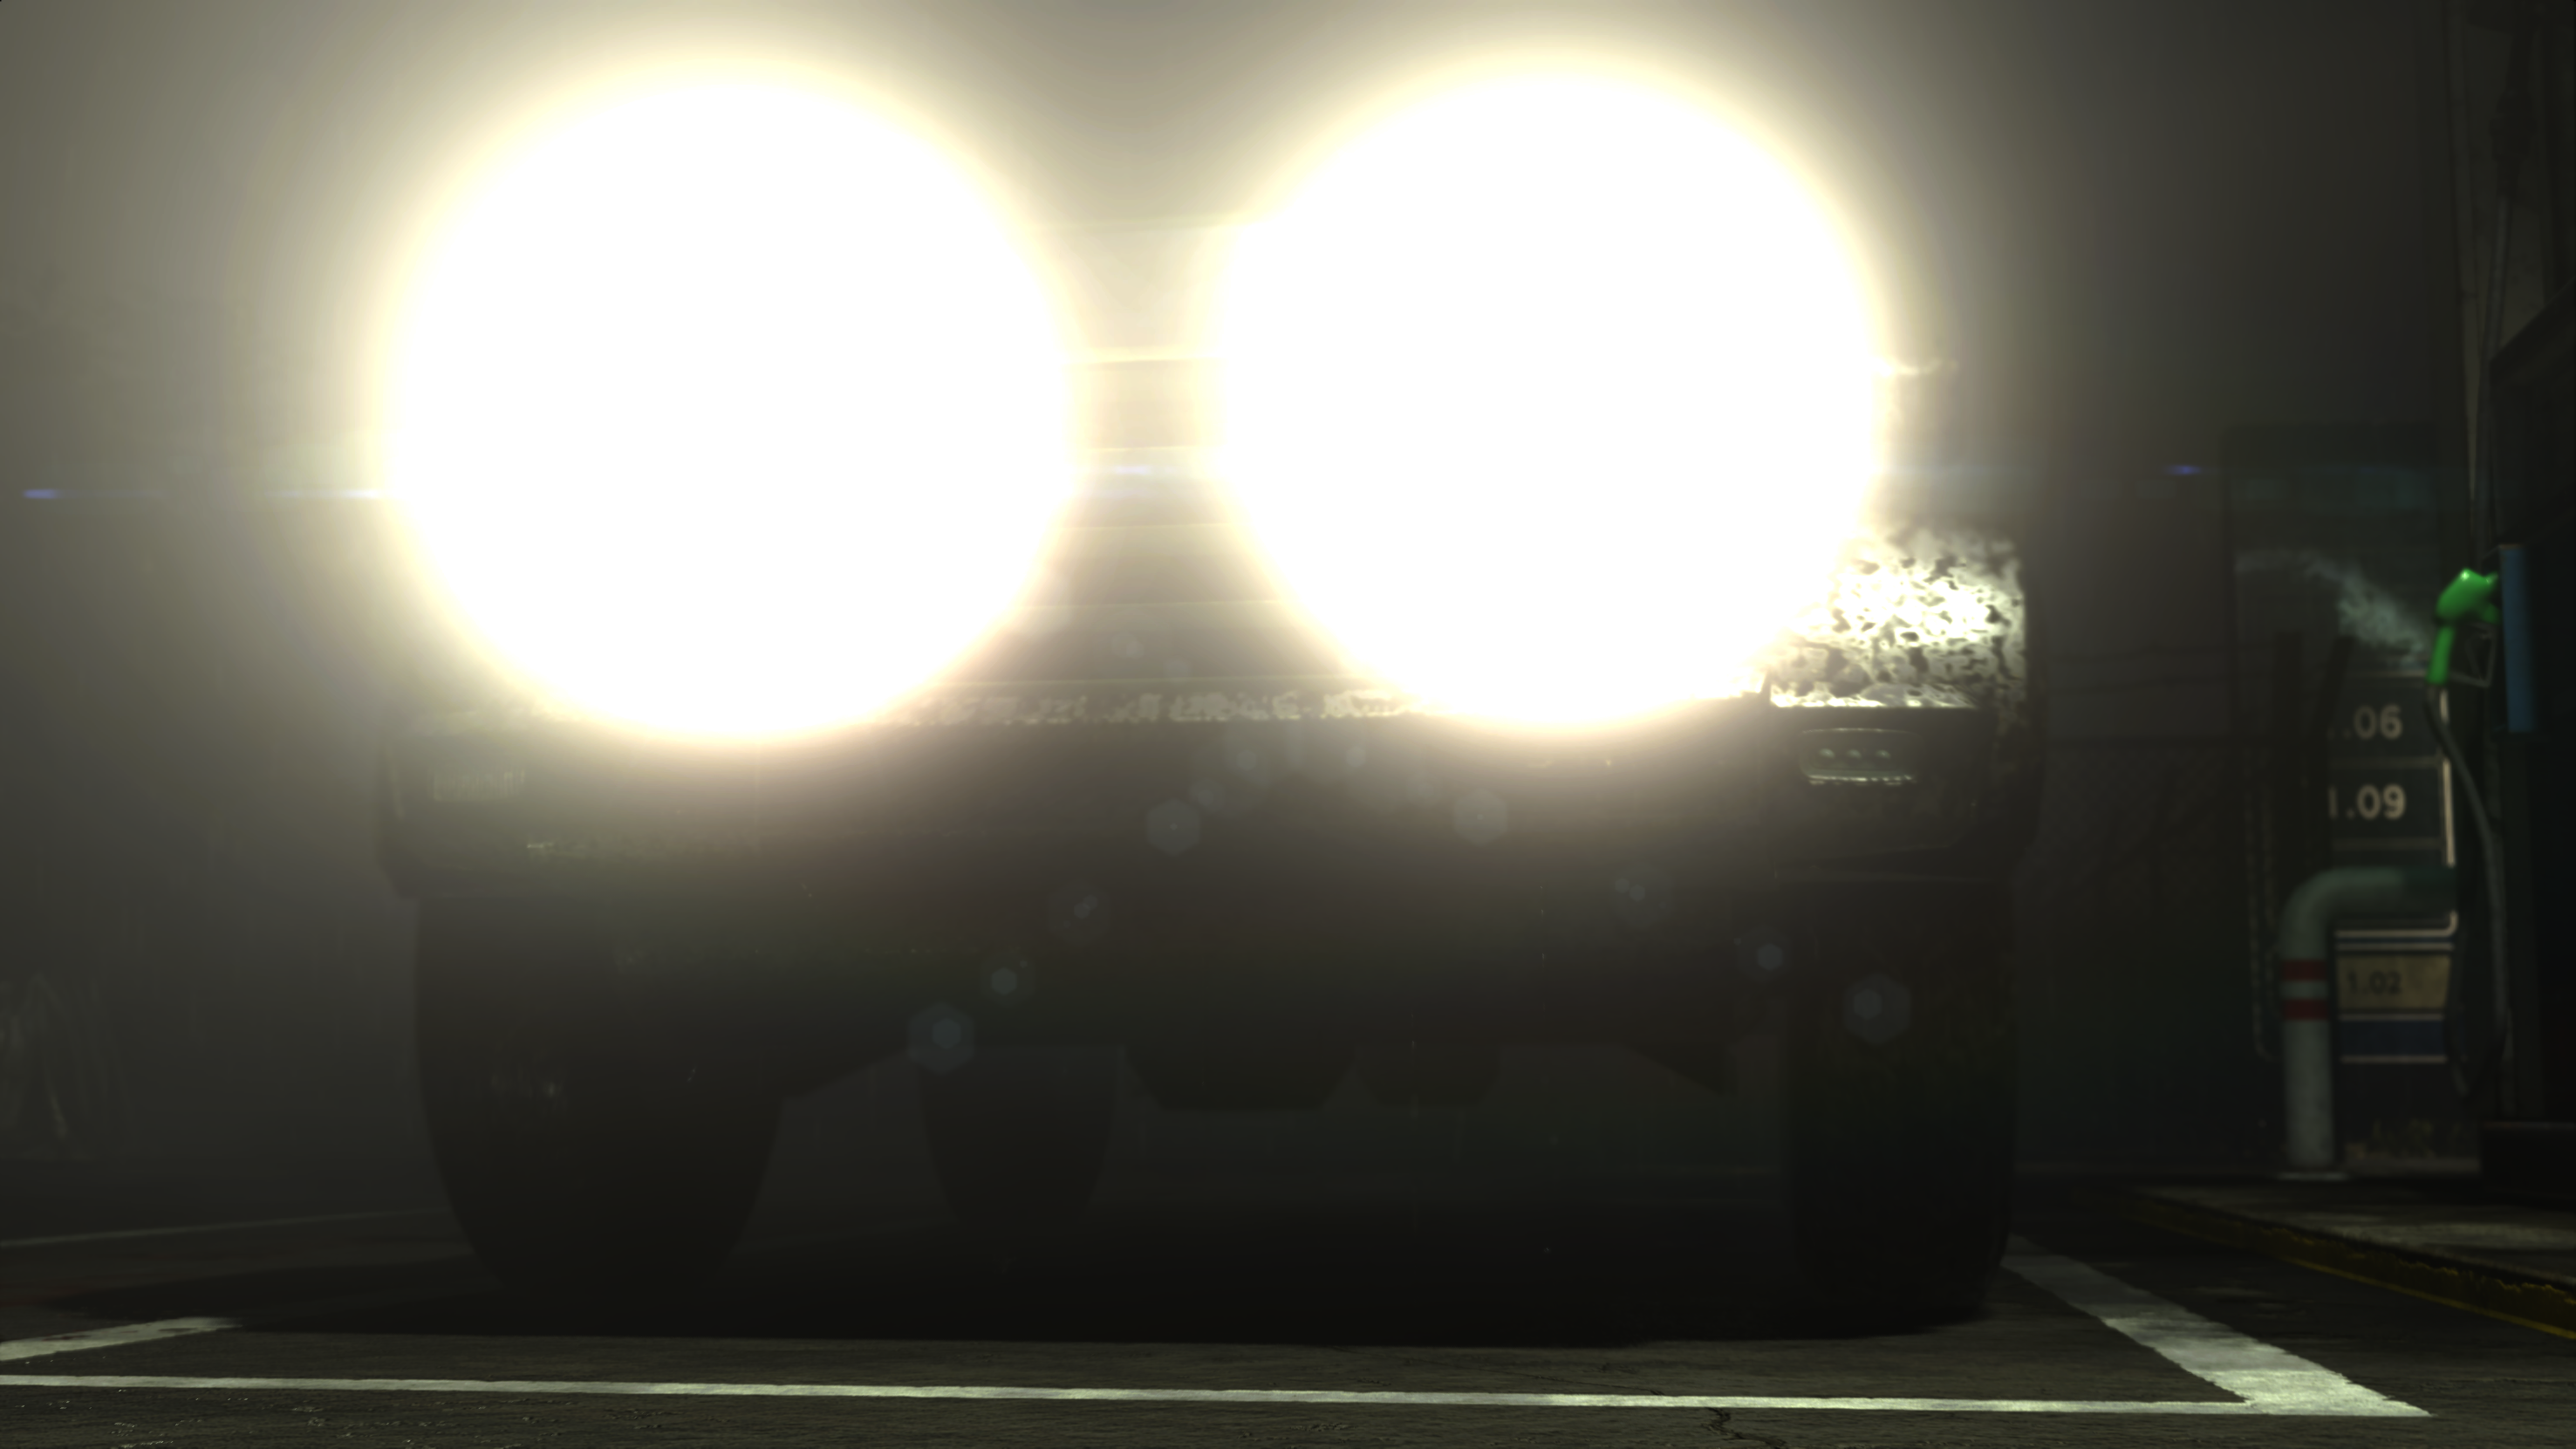


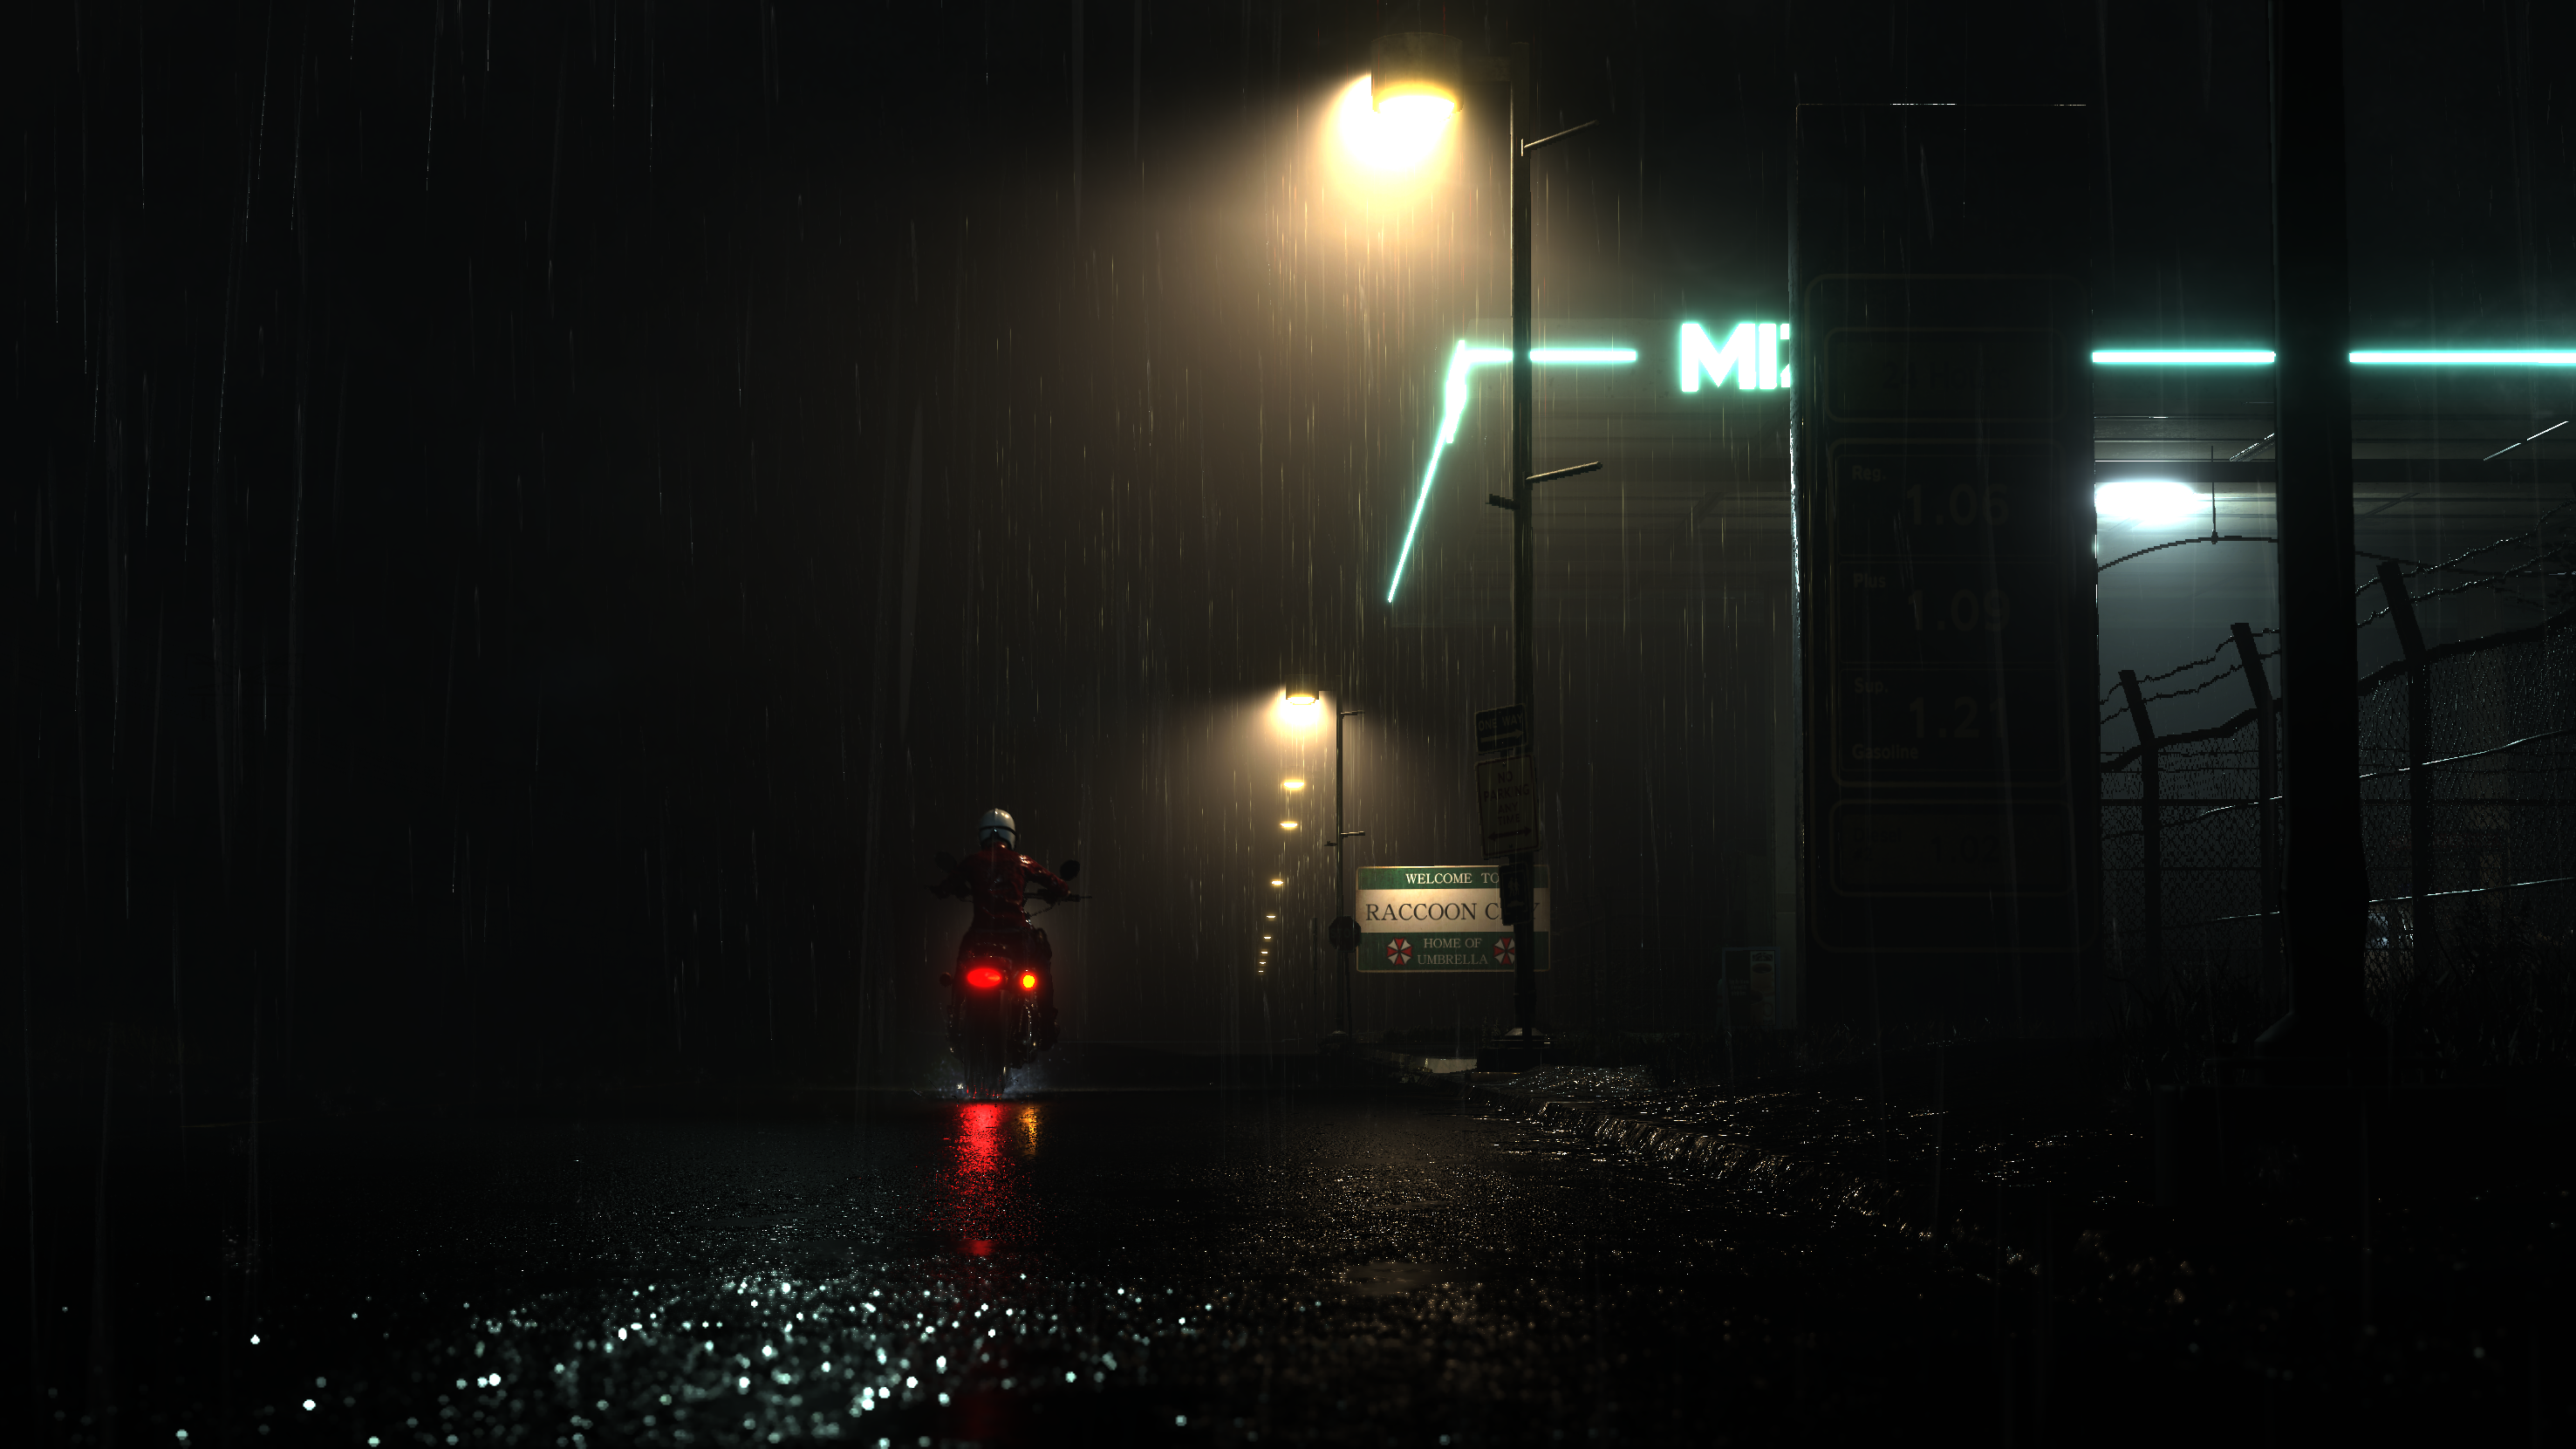

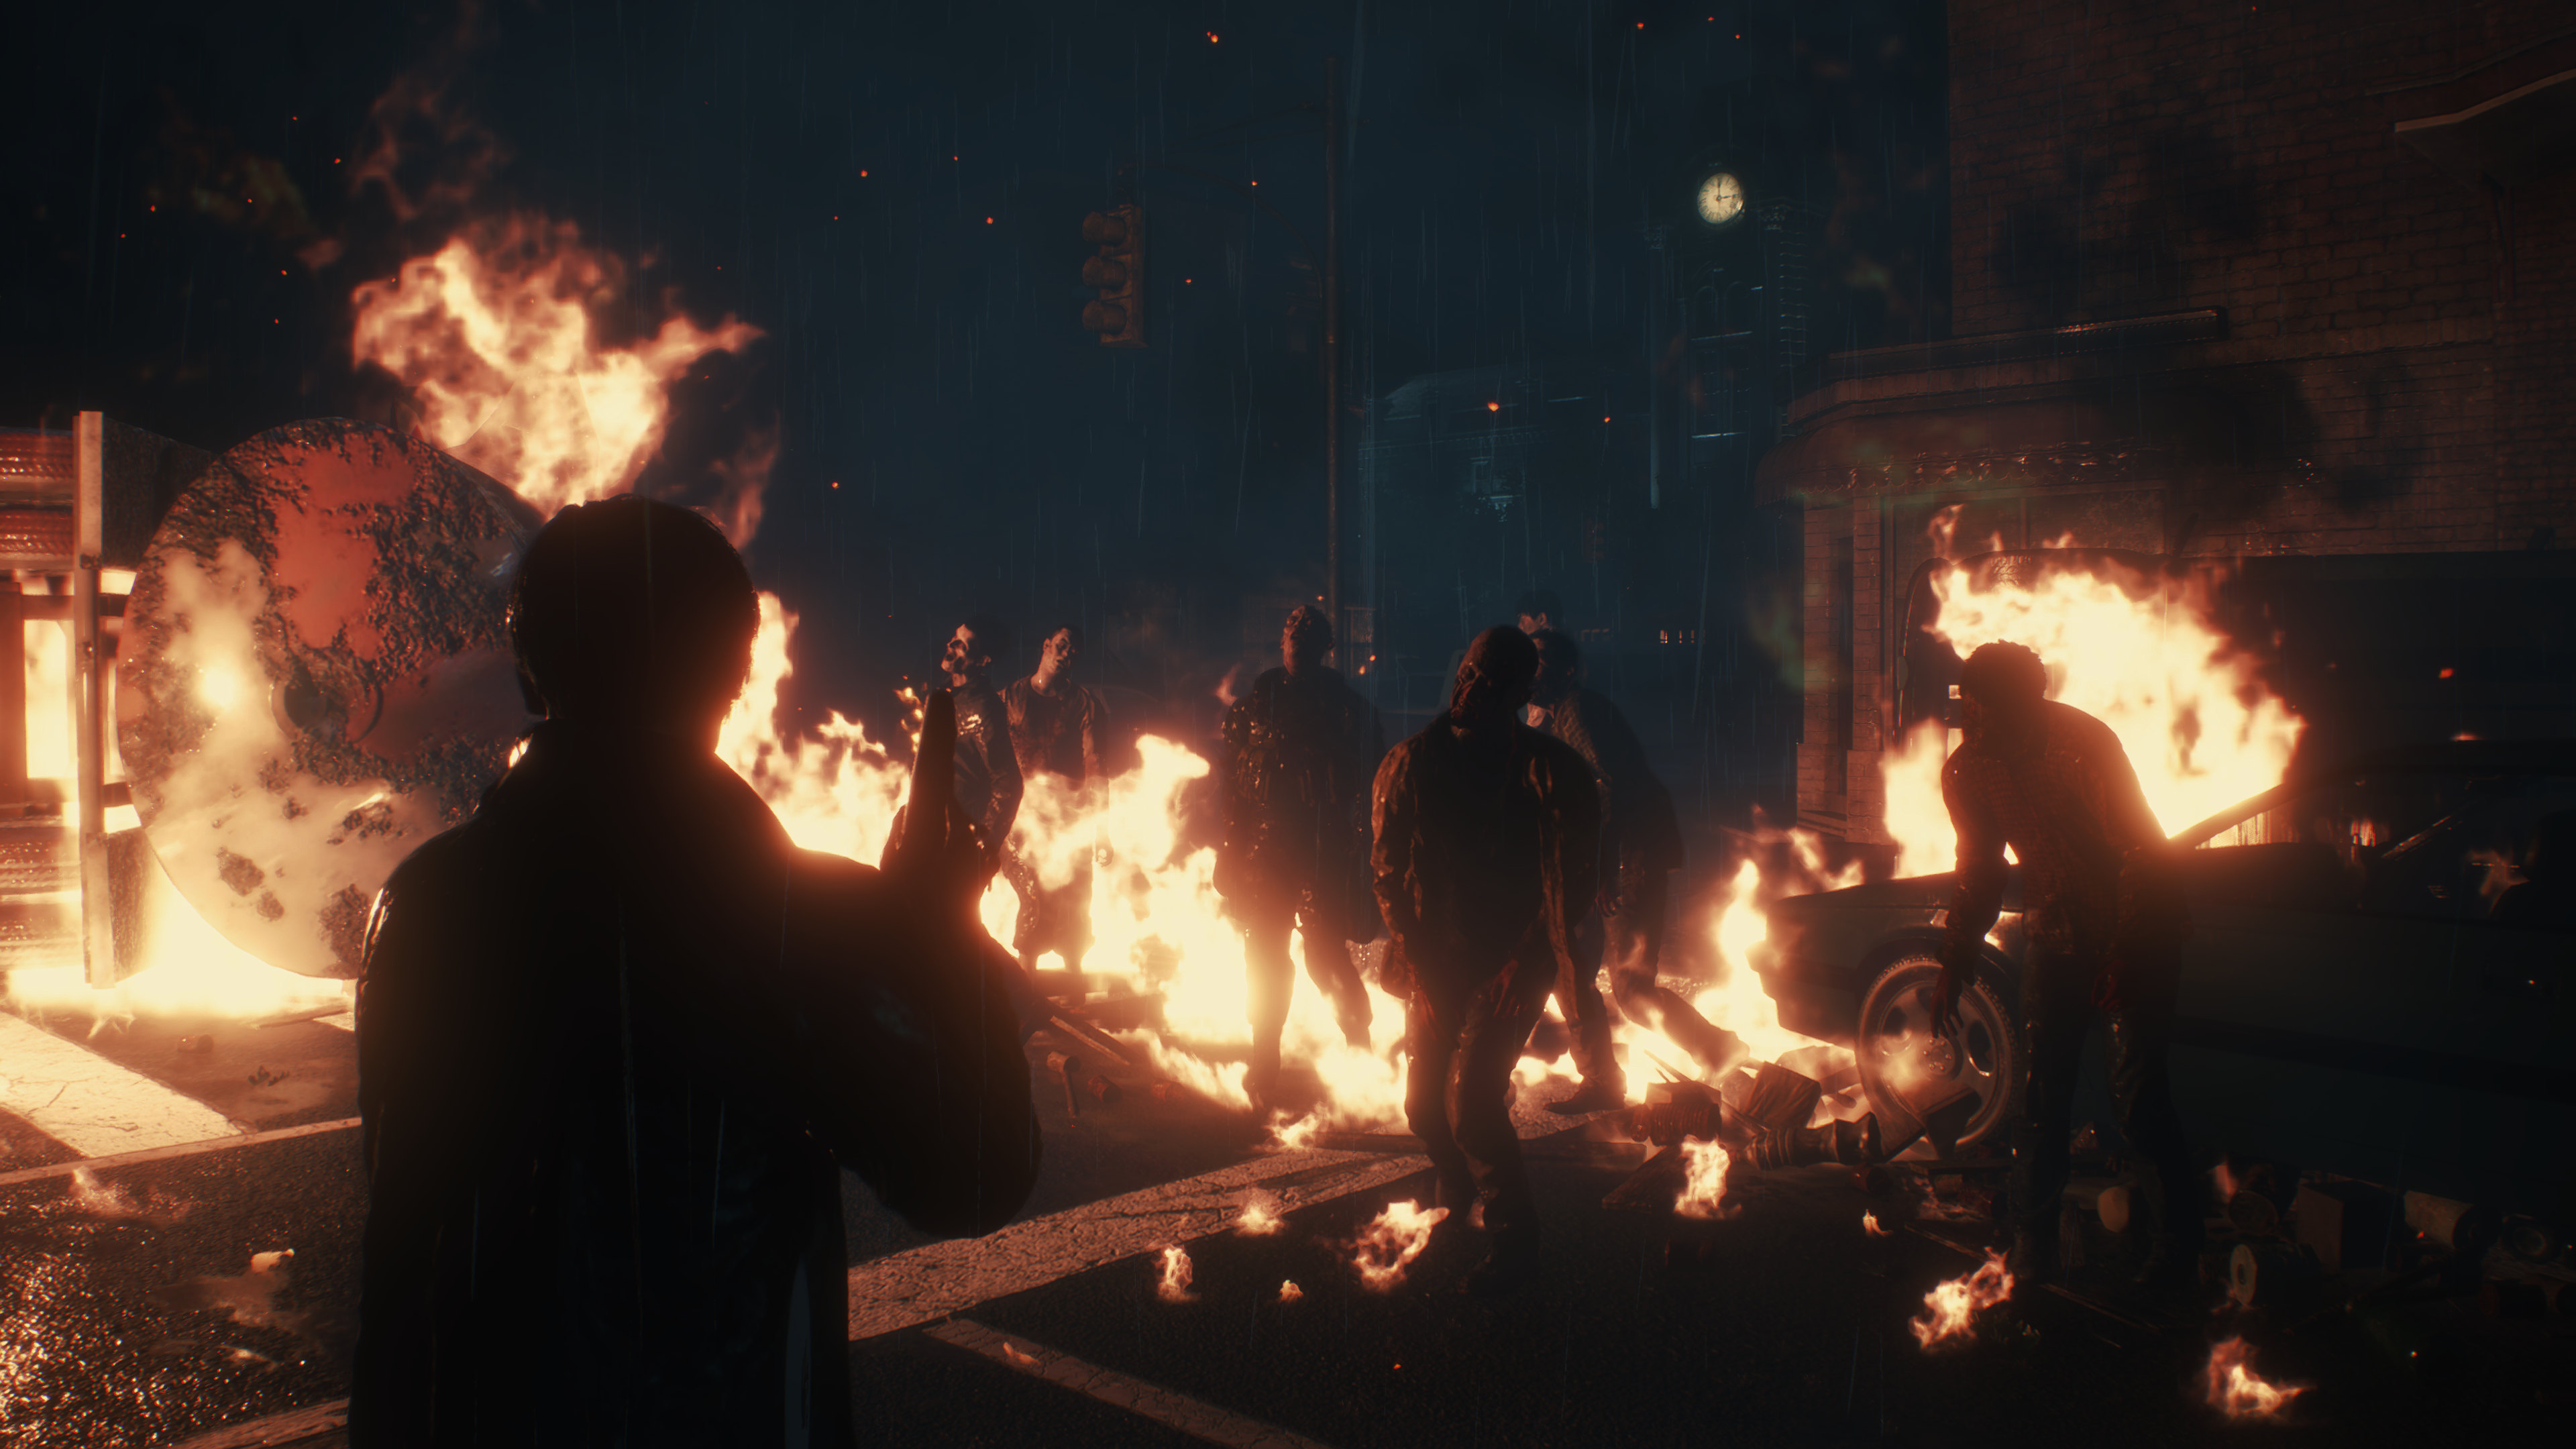
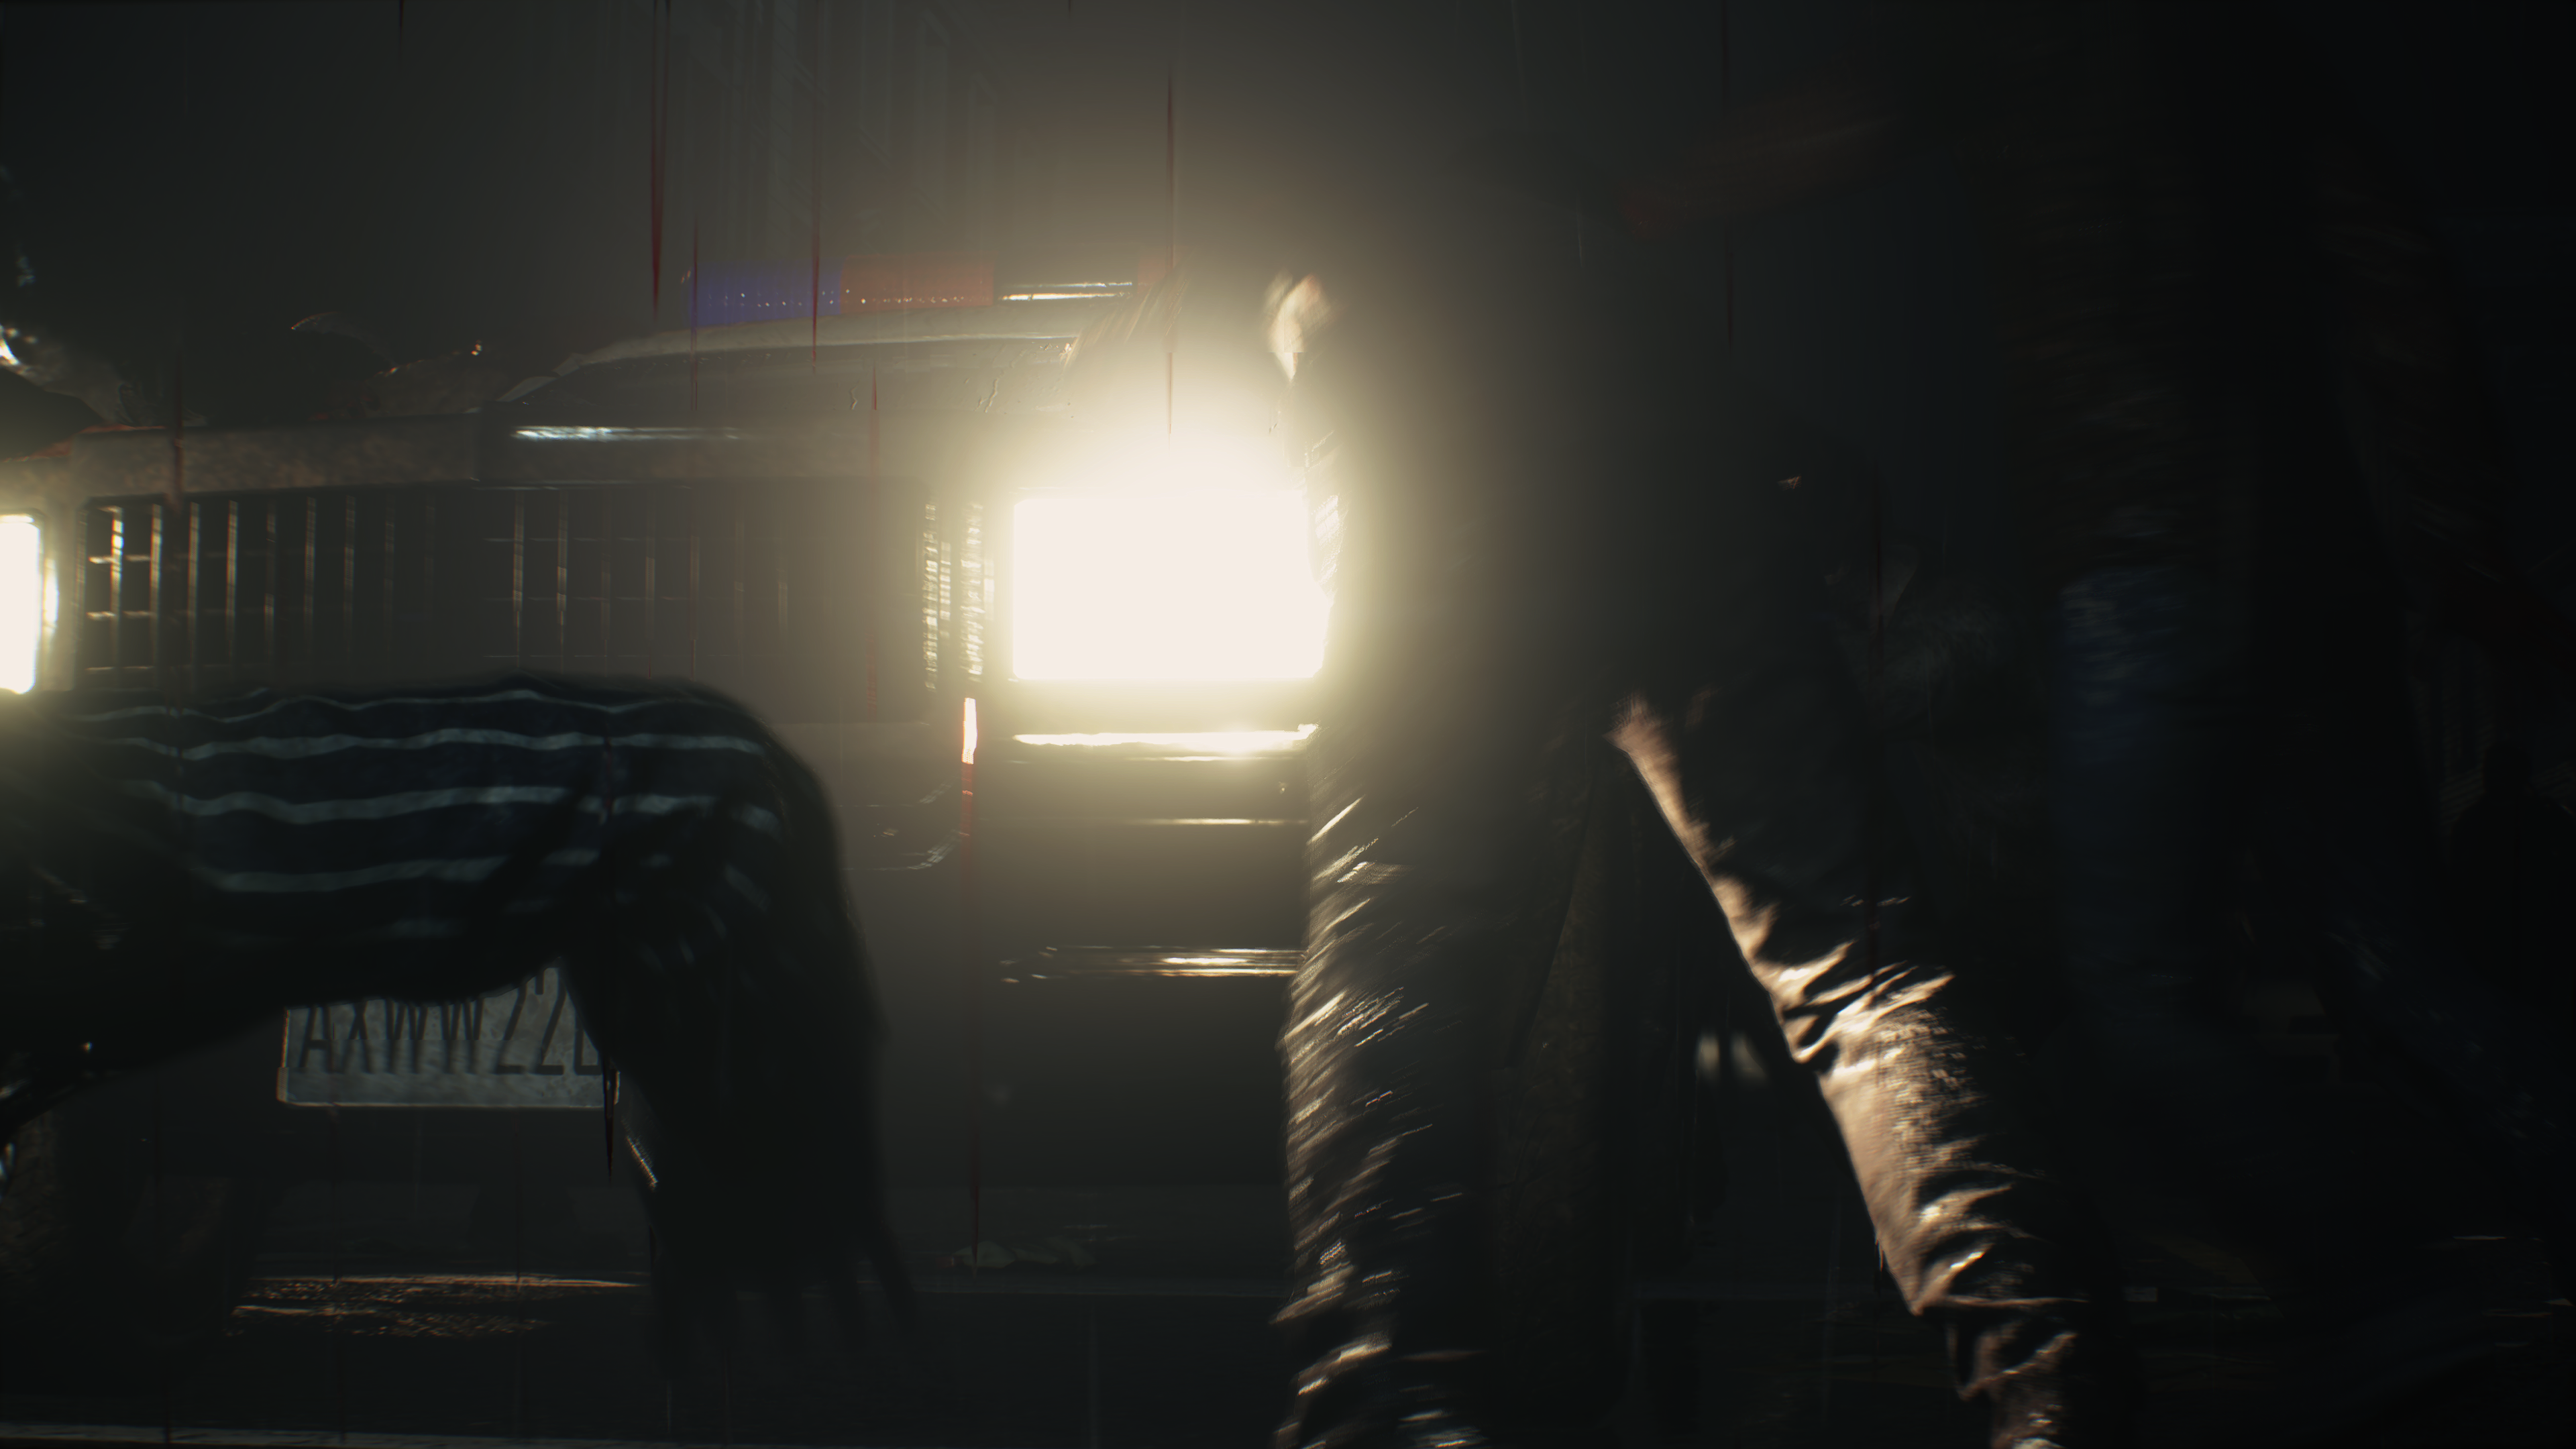

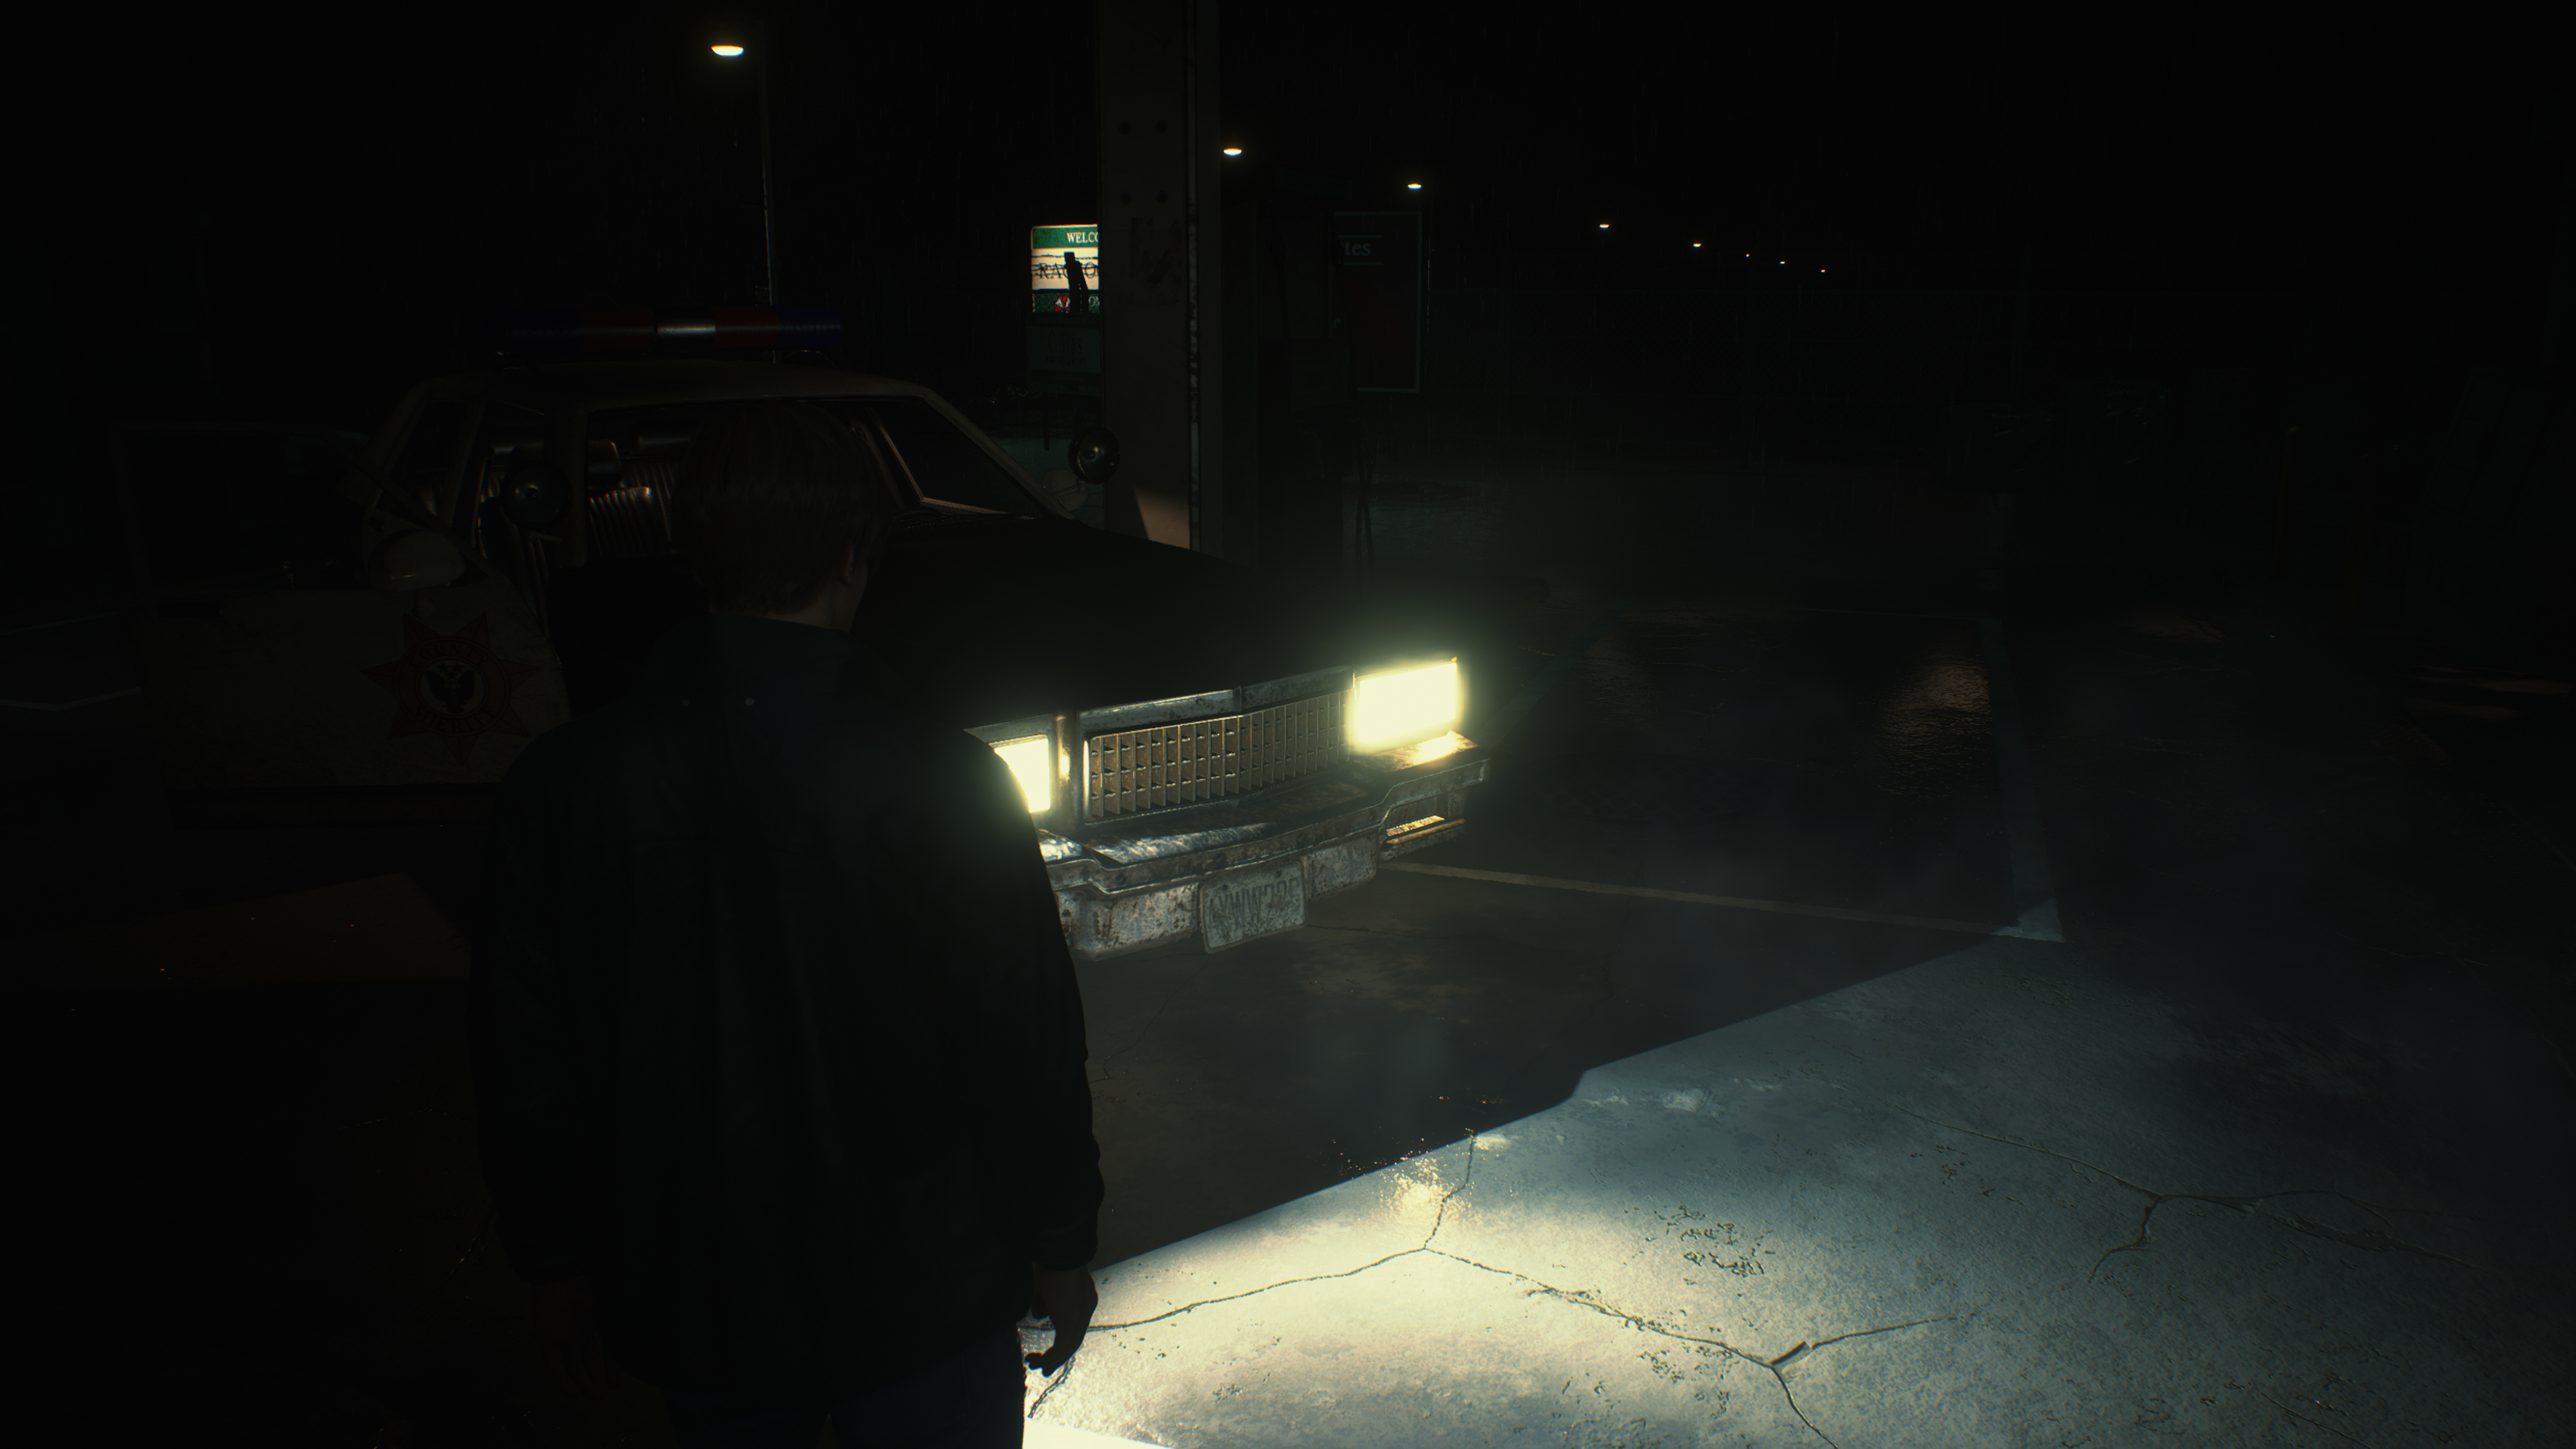
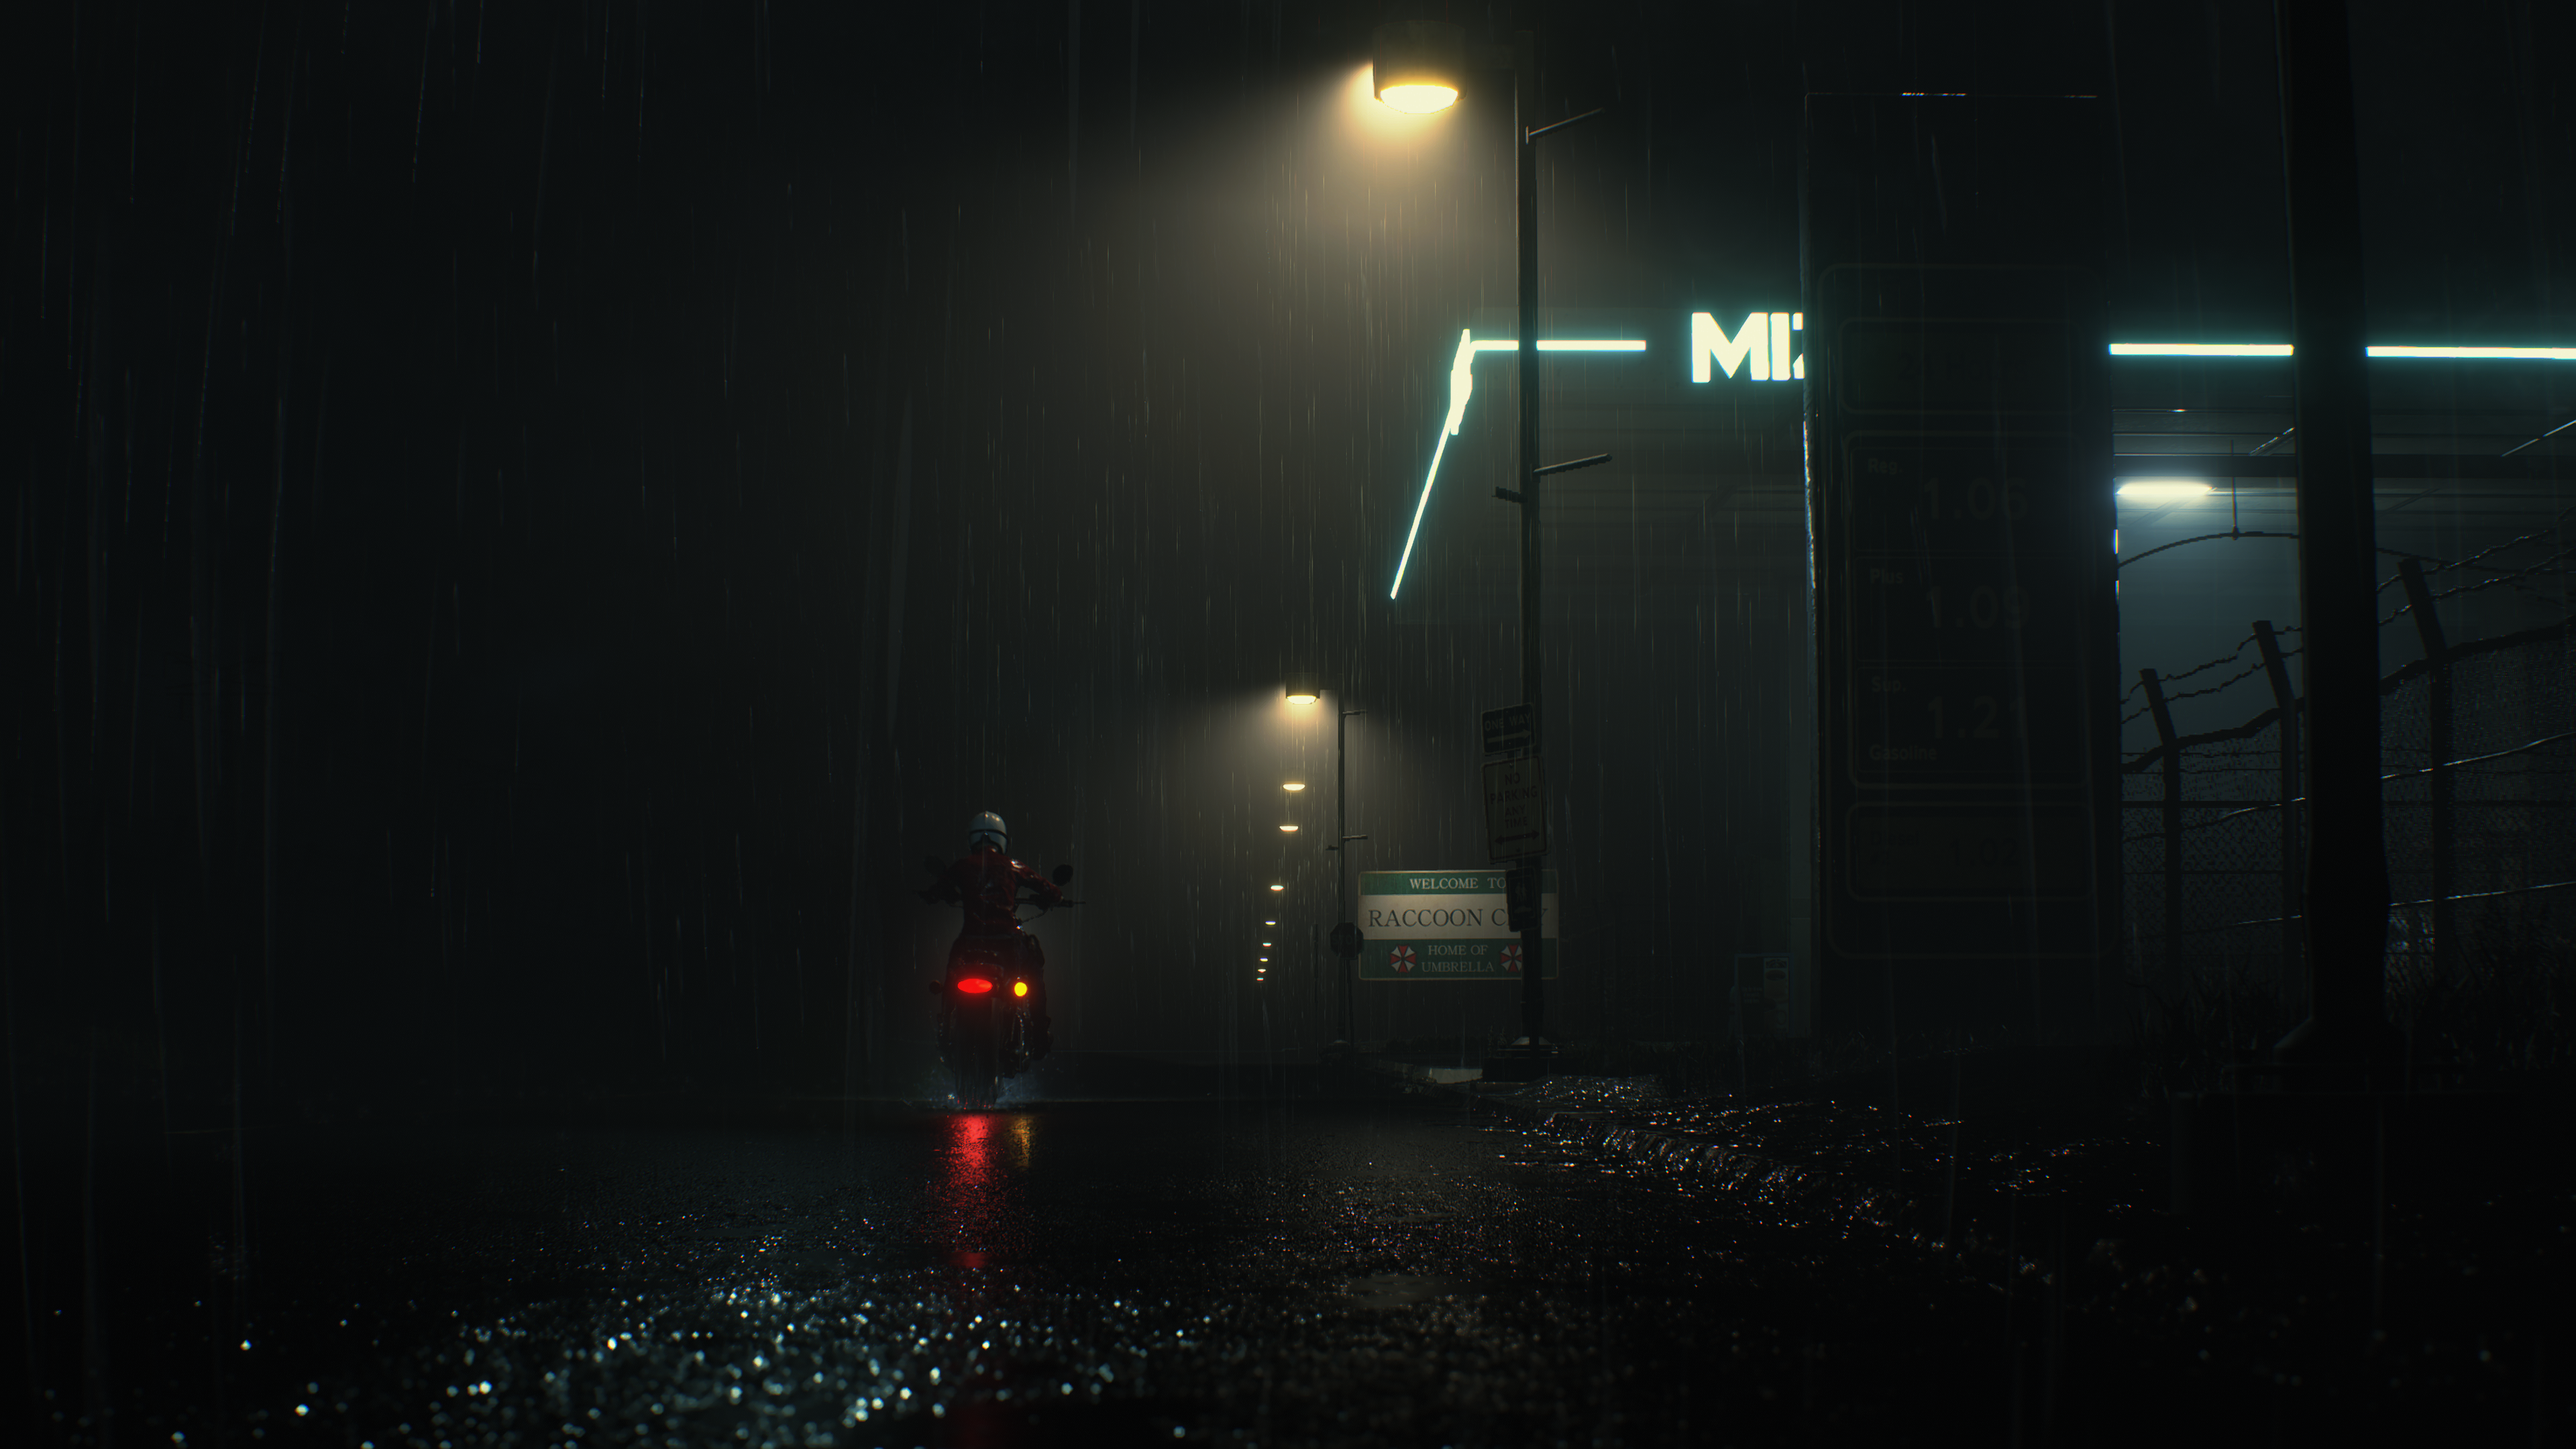
CB Soft Bloom
struct cbSoftBloom
{
	float3 cbBloomColor;
	float cbThreshold;
	float3 cbDirtMaskTintColor;
	float cbOutputRatio;
	float cbDirtMaskIntensity;
	float cbDirtMaskThreshold;
	float2 cbSoftBloomReserve;
}
CB Soft Bloom Scale
struct cbSoftBloomScale
{
	float4 sizeScale1;
	float3 sizeScale2;
	float inverseReductionBufferCount;
}
CB Soft Bloom Src Resolution
struct cbSoftBloomSrcResolution
{
	float4 cbSoftBloomSrcDimension;
}
Why an individual struct for just simple value, where it could be added to the cbSoftBloom…?! Also as you will notice later, we only rely on XY values, so why not just float2 ?!
The difference (as expected) between the bloom steps, is of course the resolution, and in every step of the bloom, the value the float4 cbSoftBloomSrcDimension is changed, so the shader can correctly down/up the given rendertarget. So in order it goes like that formula below. Keep in mind, we only care about XY values of the float4, bloom not happening neither on Z or W ^_^
Soft Bloom’s cbSoftBloomSrcDimension value per step
Between each step *2 until reaching the lowest value
Step 01 -> 0.00034, 0.0006, 4.00771E-43, 2.52436E-29
Step 02 -> 0.00068, 0.0012, 4.81488E-35, 1.43493E-42
Step 03 -> 0.00136, 0.00241, 1.00, 0.00
Step 04 -> 0.00271, 0.00483, nan, 0.00
Step 05 -> 0.00543, 0.00971, nan, 0.00
Step 06 -> 0.01087, 0.01961, nan, 2.52436E-29
Step 07 -> 0.02174, 0.04, nan, 2.52436E-29
Step 08 -> 0.04348, 0.08333, nan, 2.52436E-29
Go back up, and /2 between each steps until we reach the original given value
Step 09 -> 0.02174, 0.04, nan, 2.52436E-29
Step 10 -> 0.01087, 0.01961, nan, 2.52436E-29
Step 11 -> 0.00543, 0.00971, nan, 2.52436E-29
Step 12 -> 0.00271, 0.00483, nan, 2.52436E-29
Step 13 -> 0.00136, 0.00241, nan, 2.52436E-29
Step 14 -> 0.00068, 0.0012, 1.00, nan
Sub-Post-Processing
The engine refers to this stage as “LDR PostProcess With Tonemap“, but i prefer to call this step a sub-post-processing, as it is kinda a sub-pass. Where all previous post processing where taking place in their own dedicated passes (most of the time, things are mixed at some cases) using different shaders and different buffers of params, but here at this stage, there is a whole lot of post processors are applied all at once in a single shader, and because of that, it makes it hard to see the output of each post-processor before another one get applied, so we can have an overall view of what gets into the pass & what comes out of the pass.
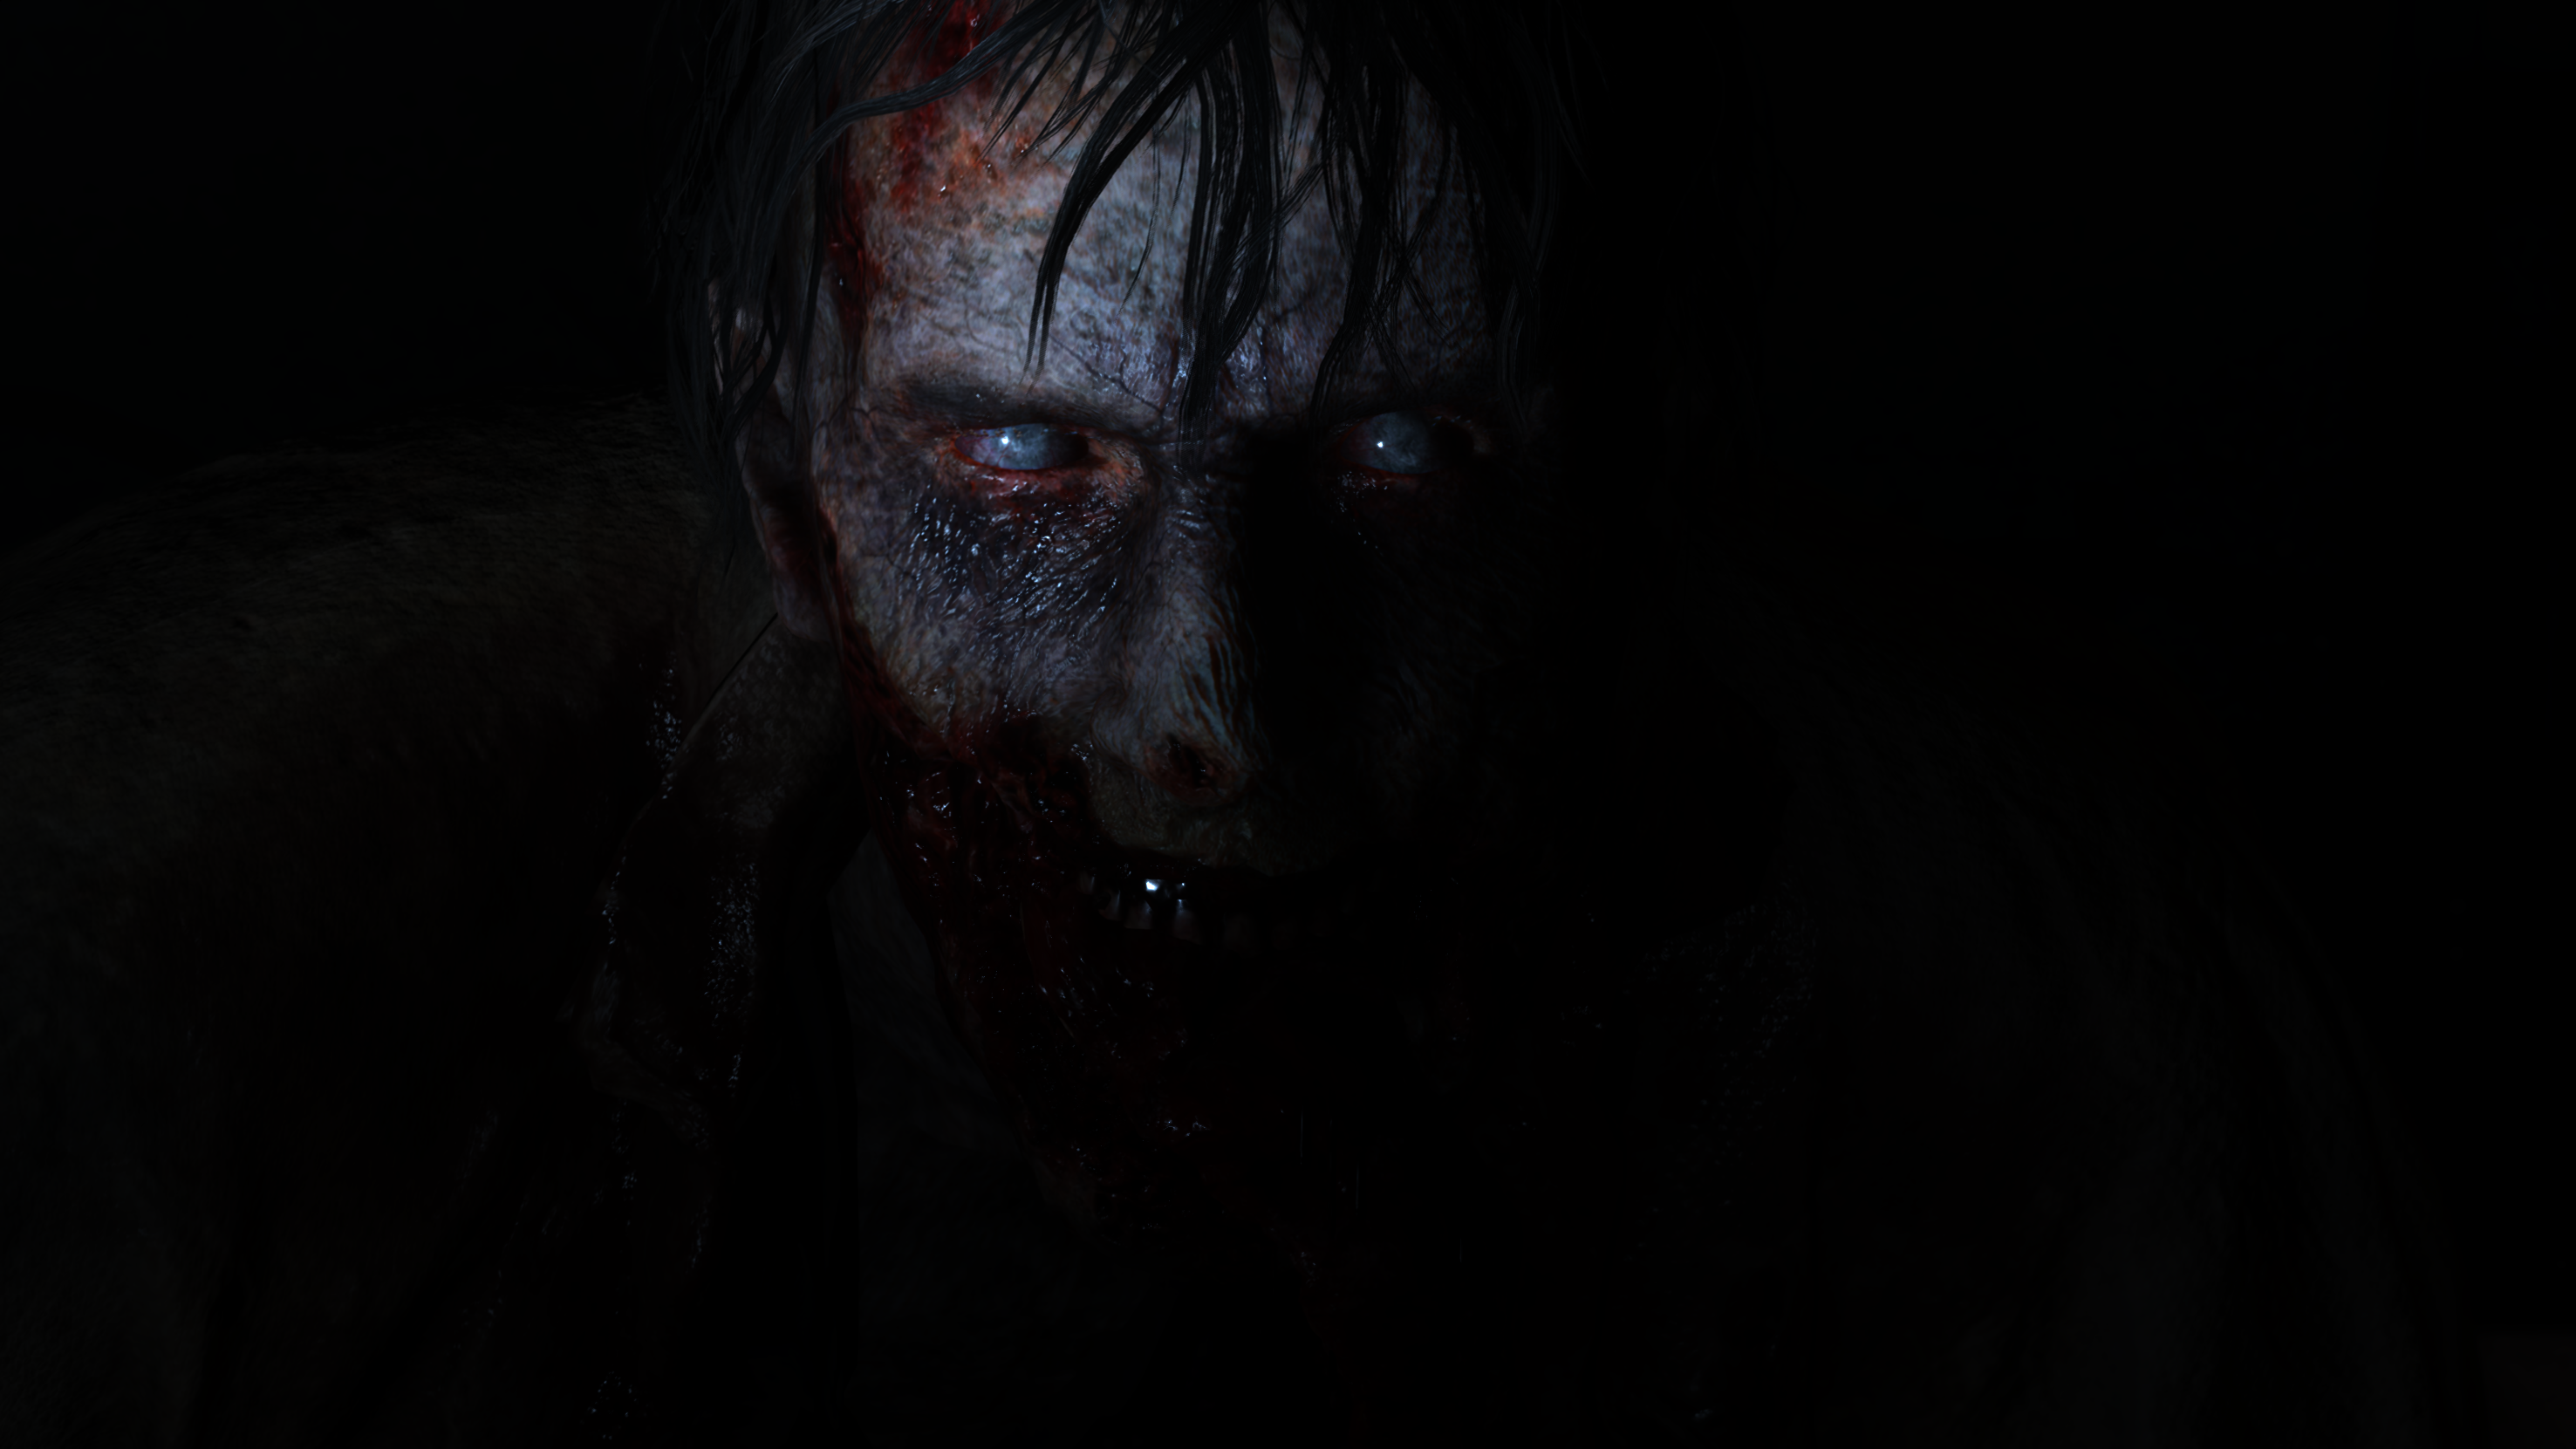

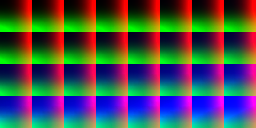

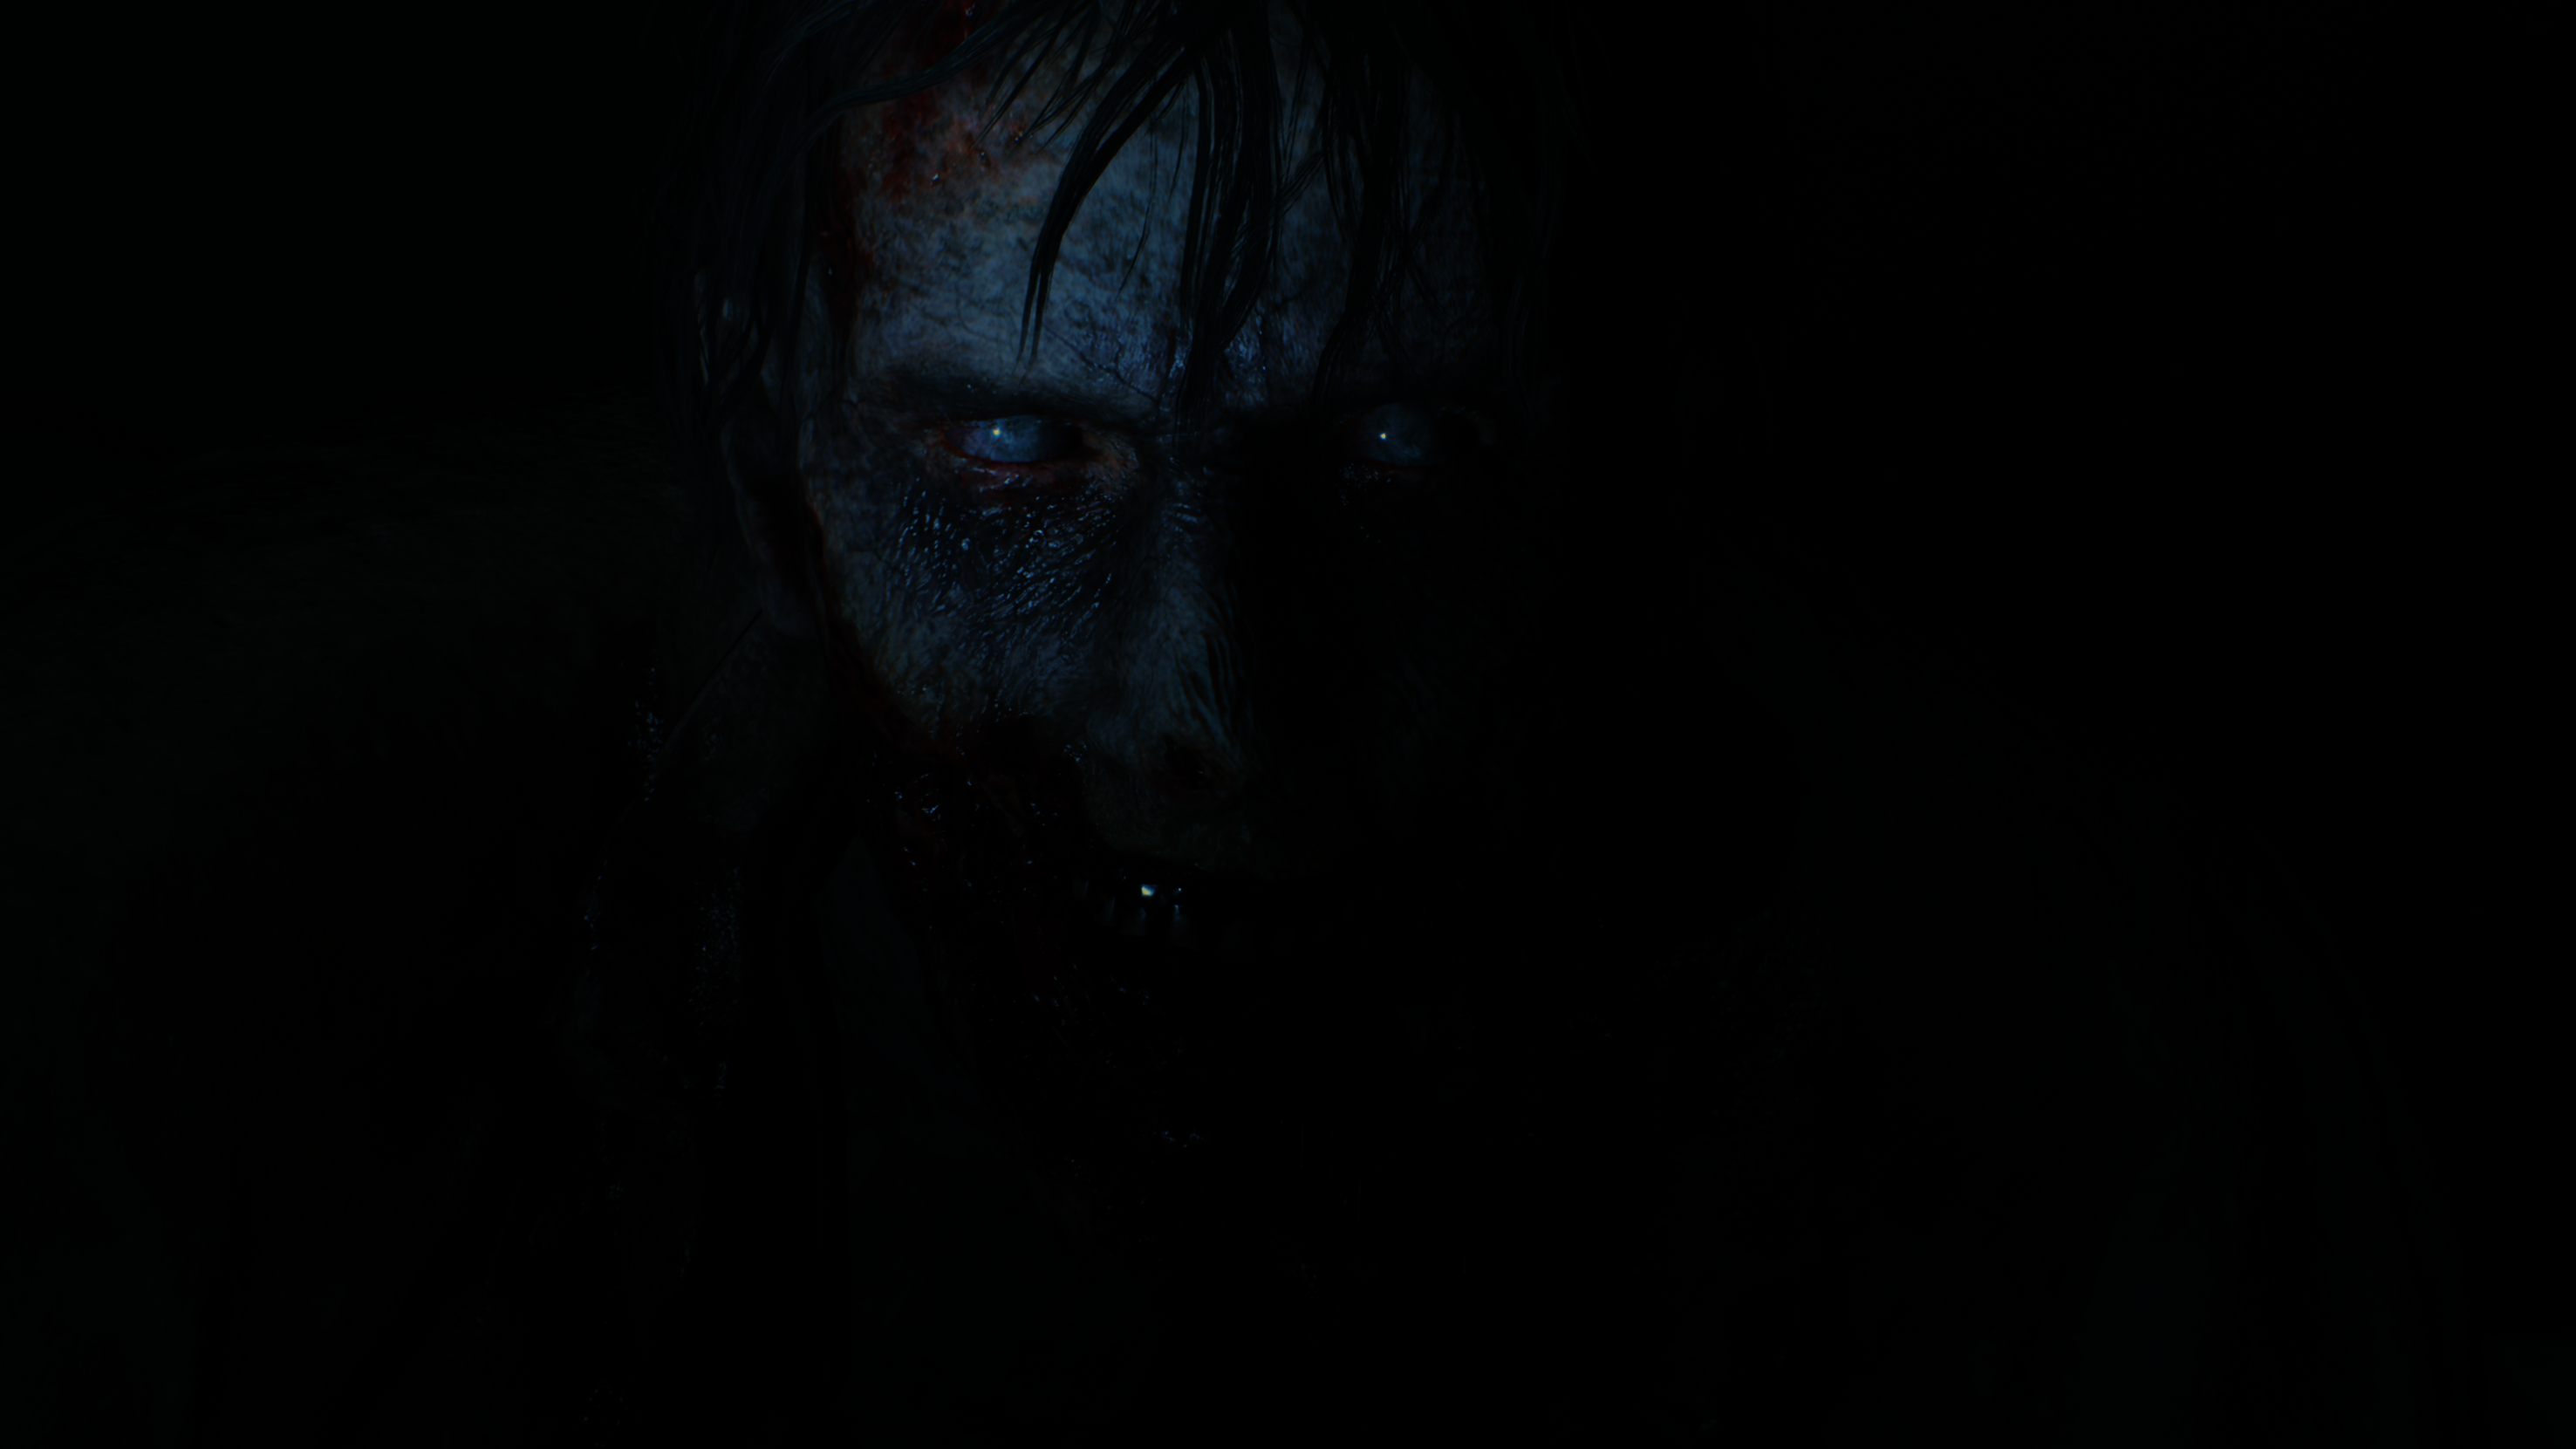
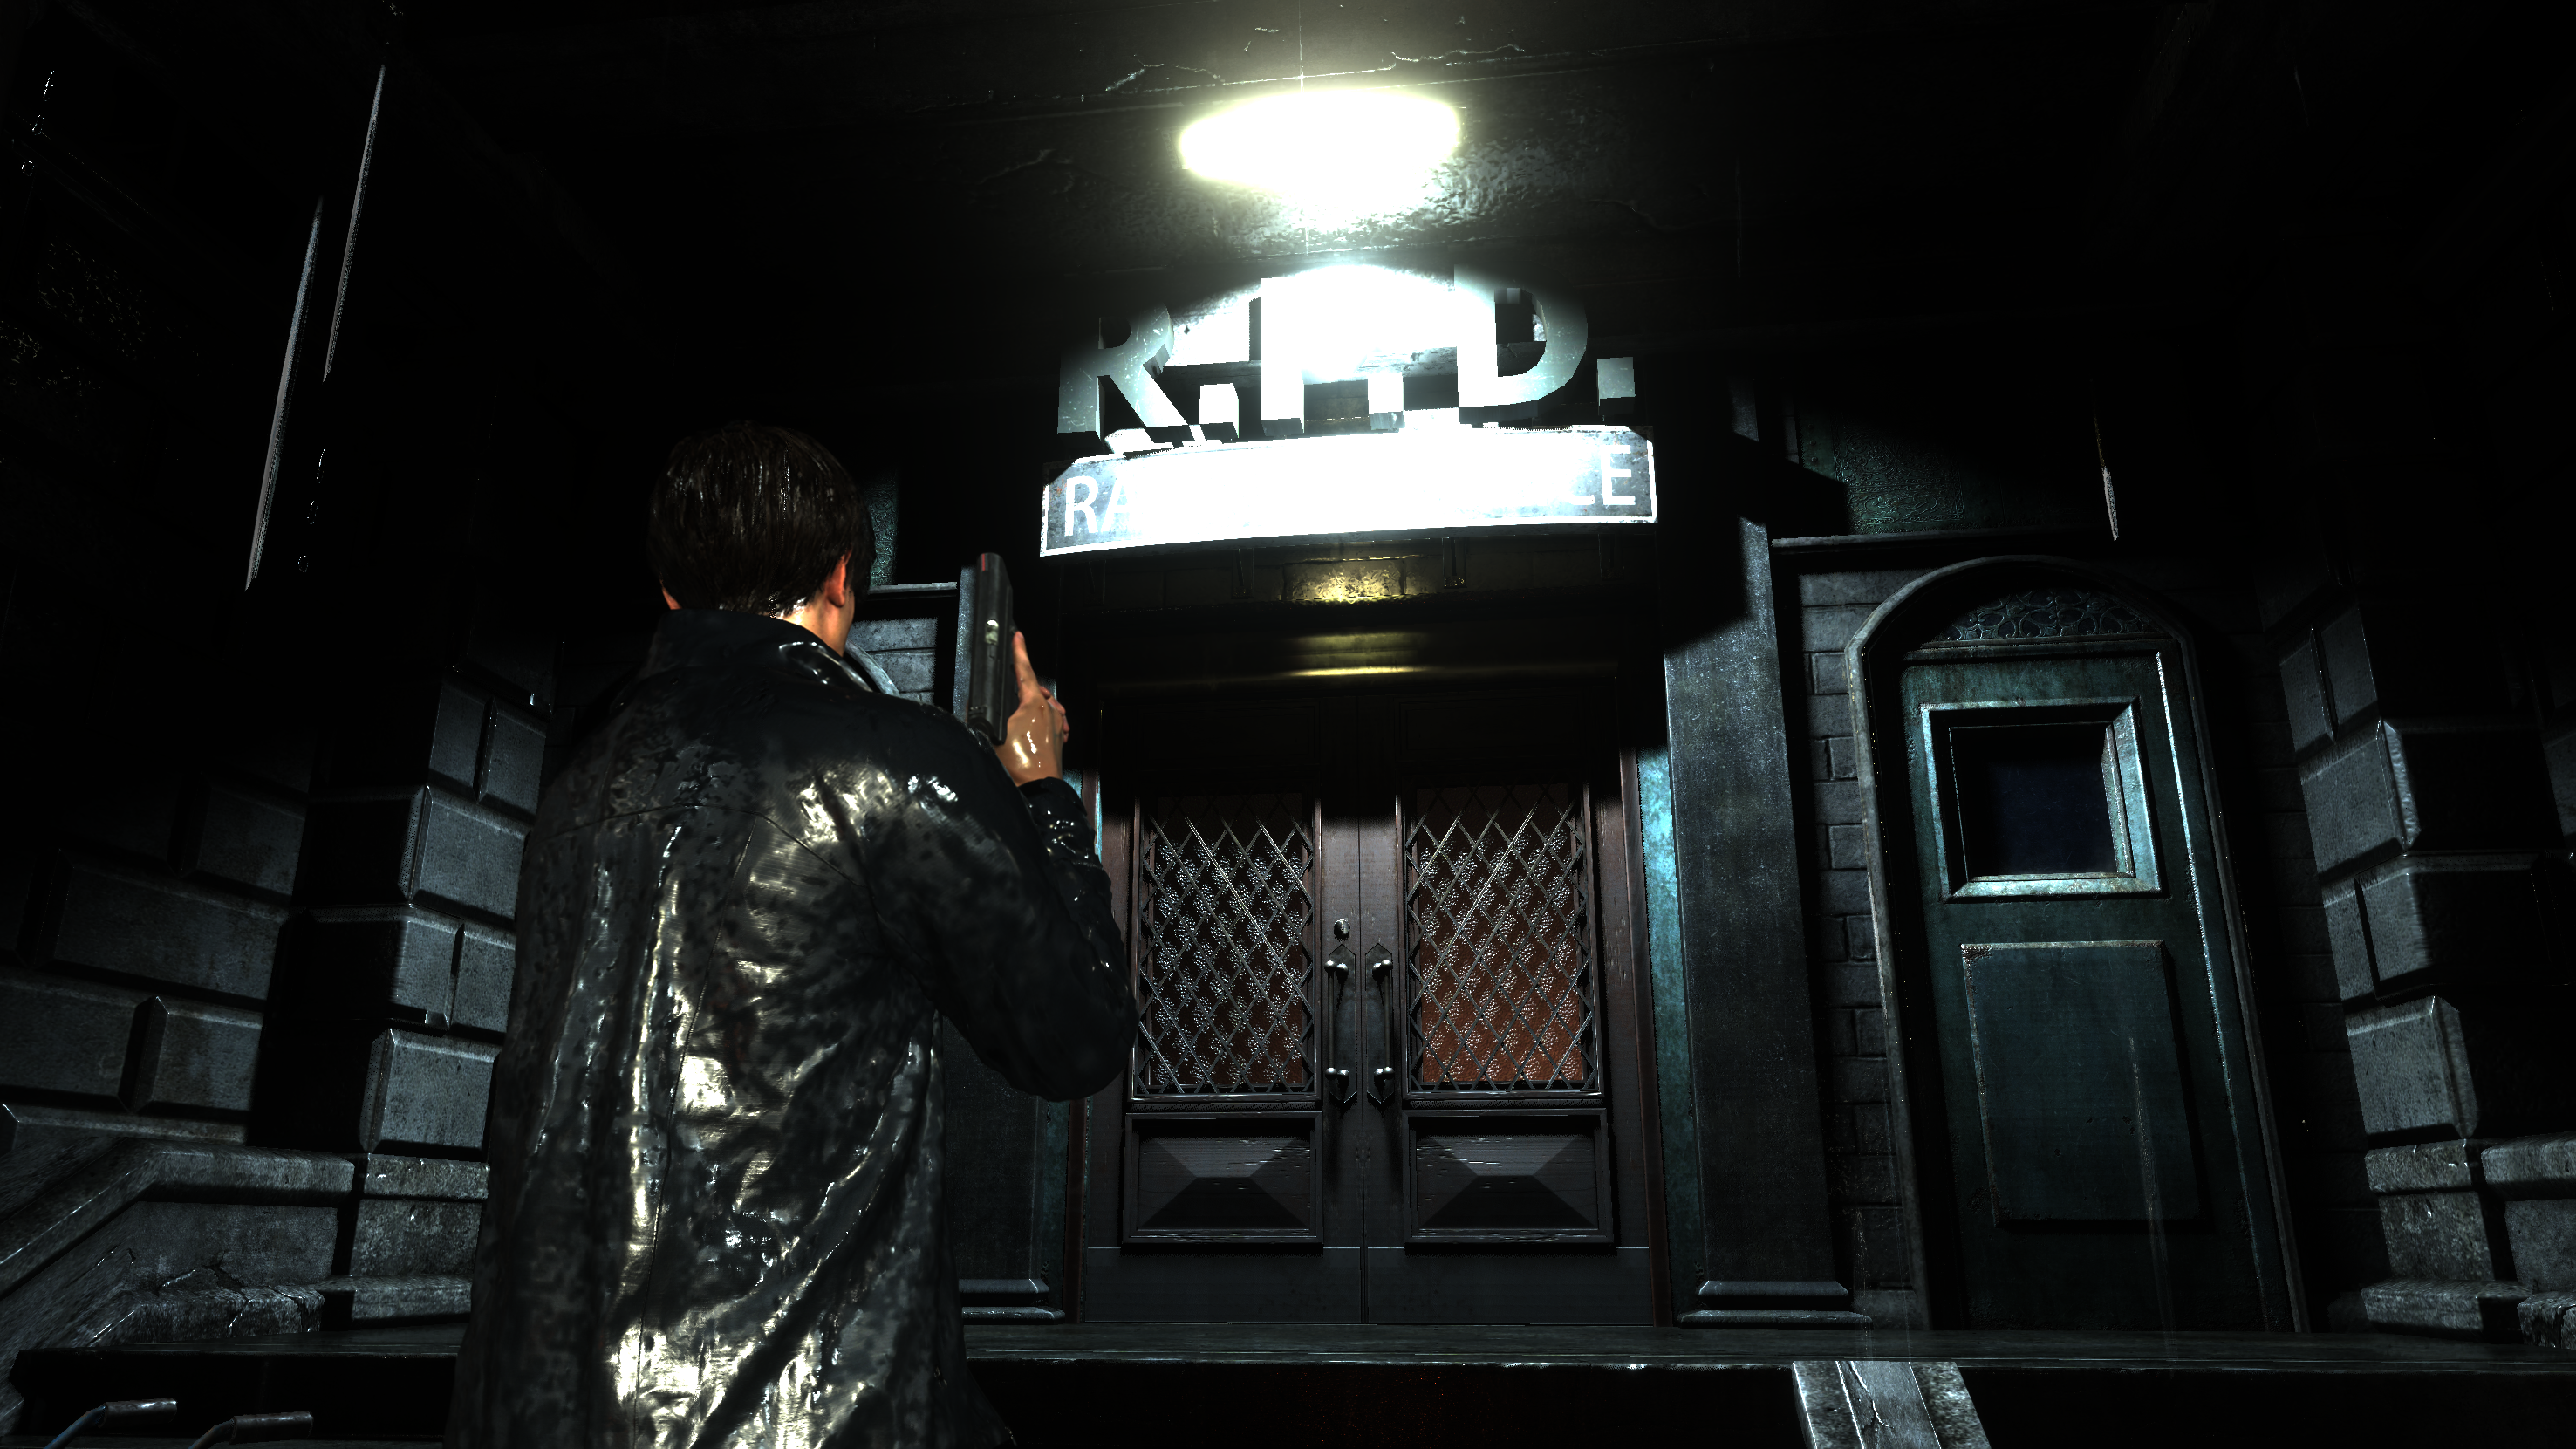


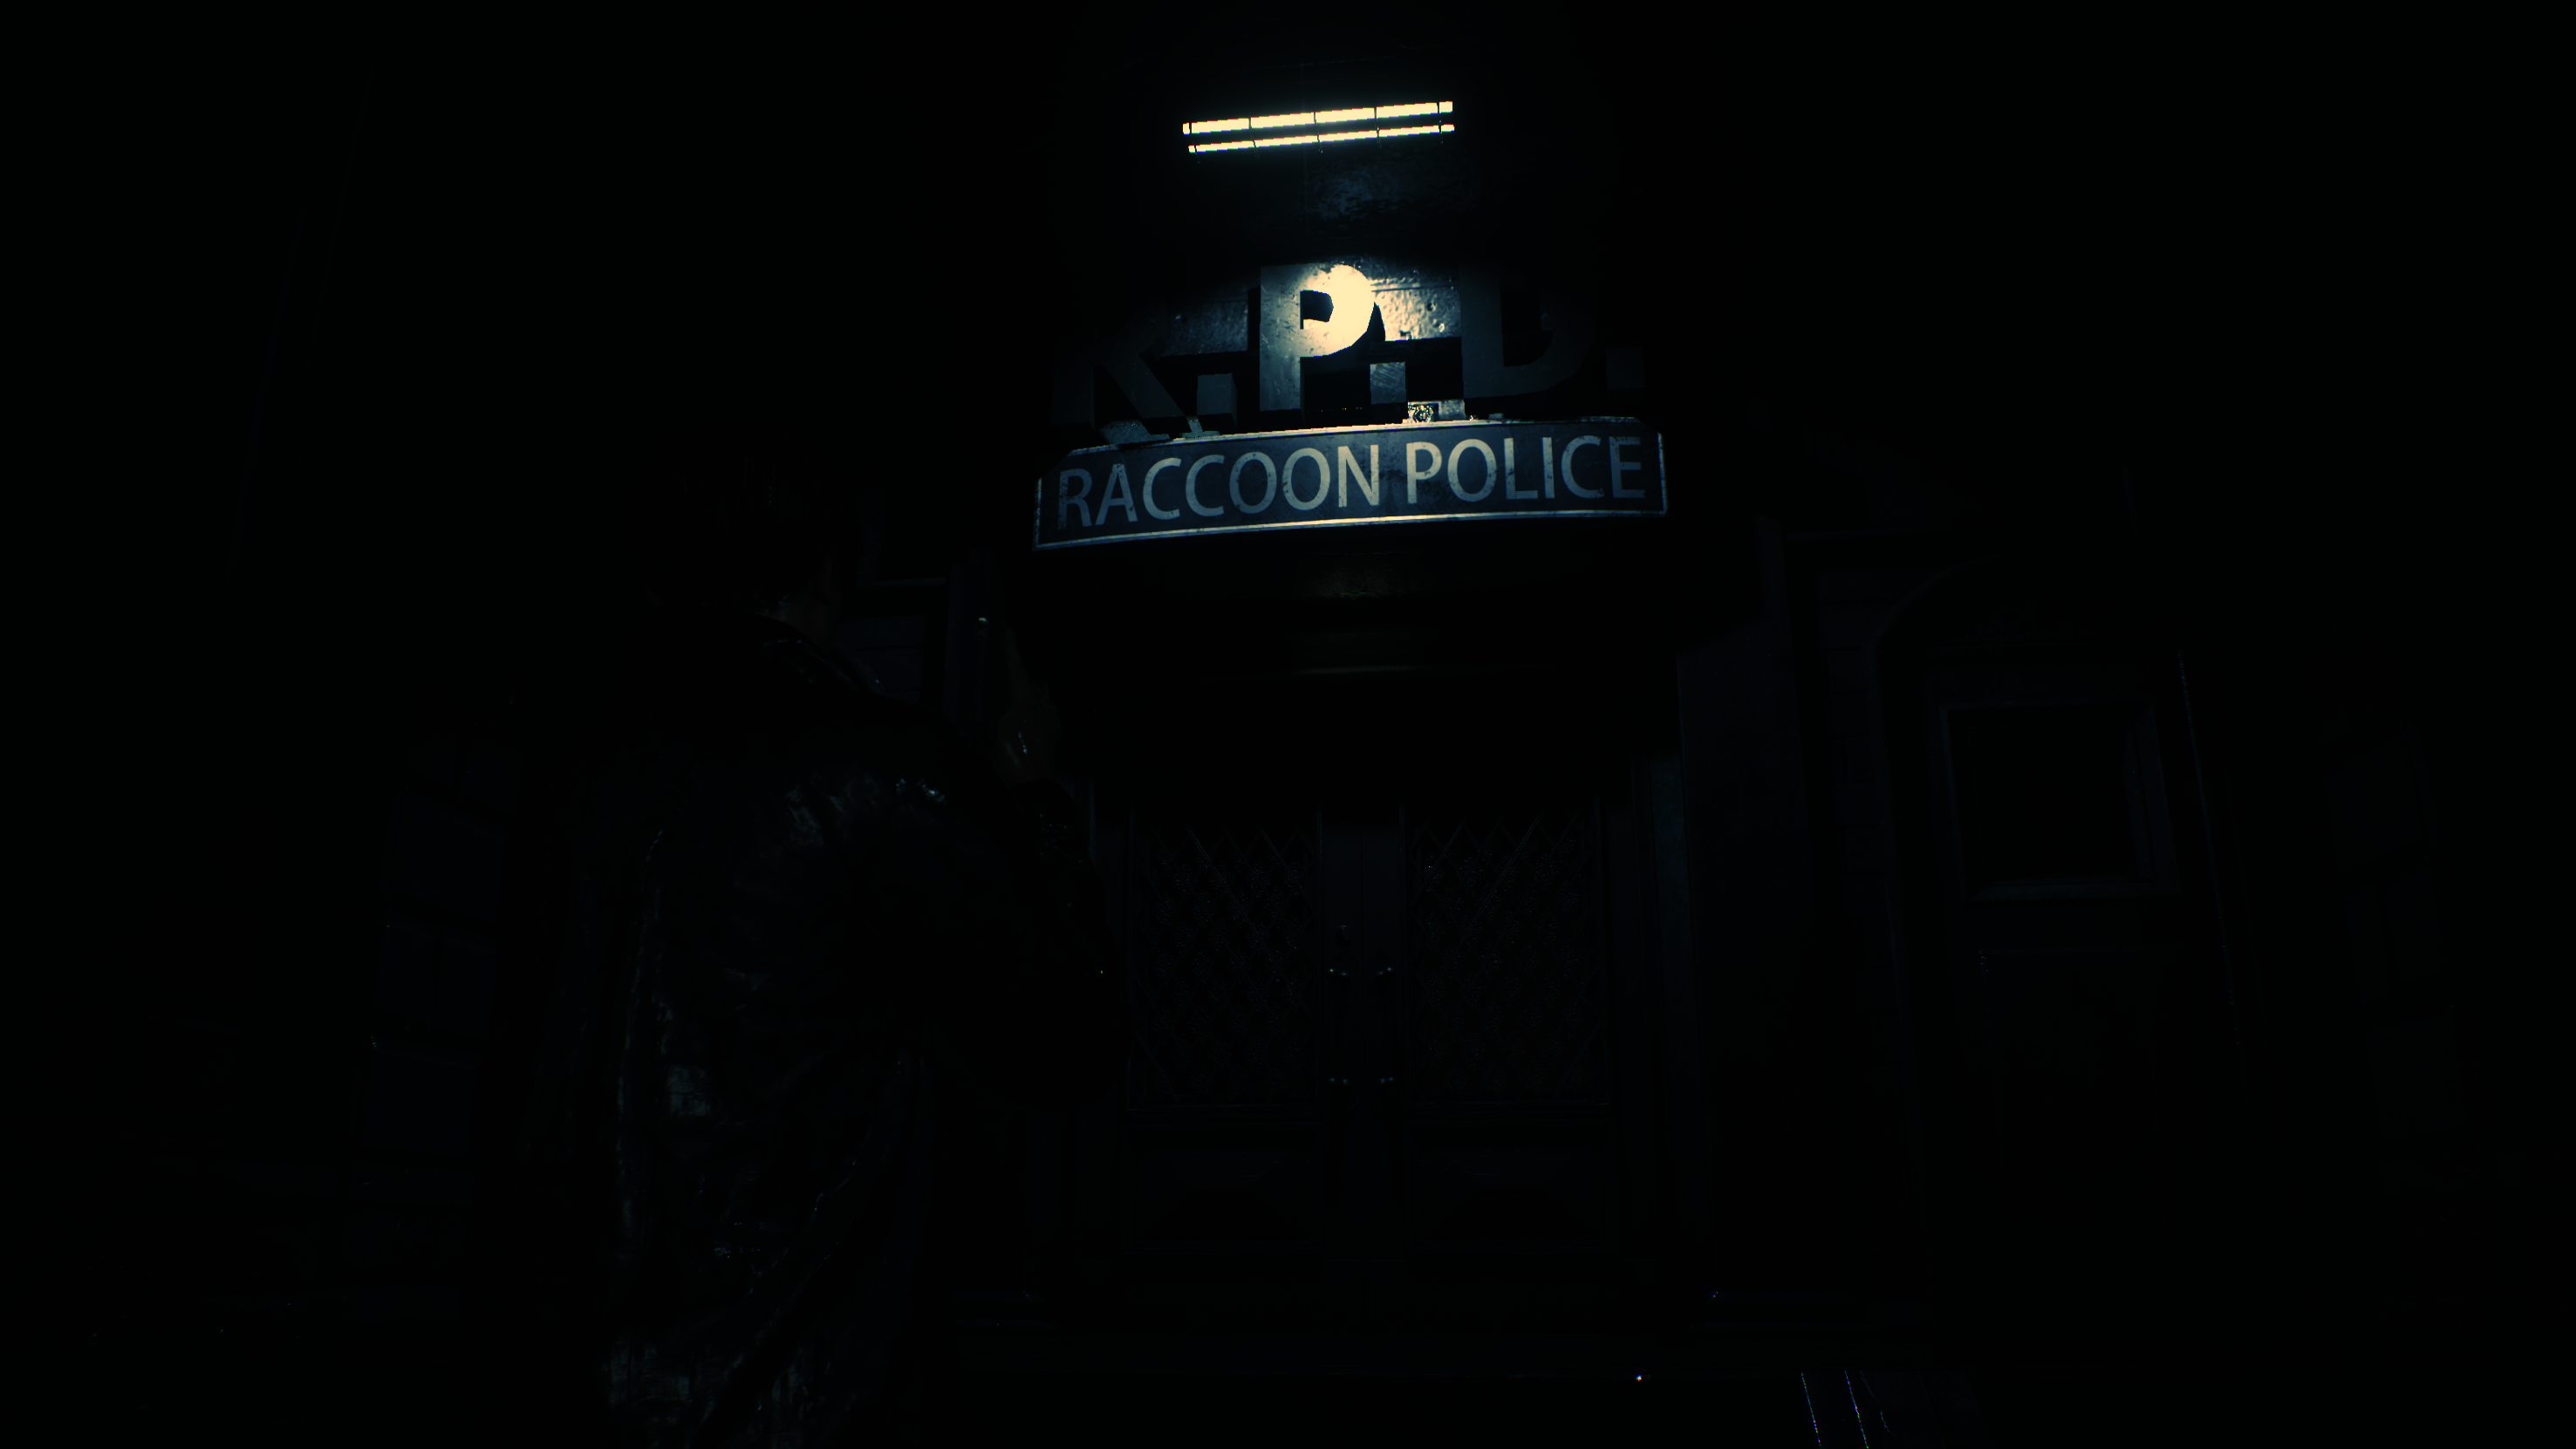
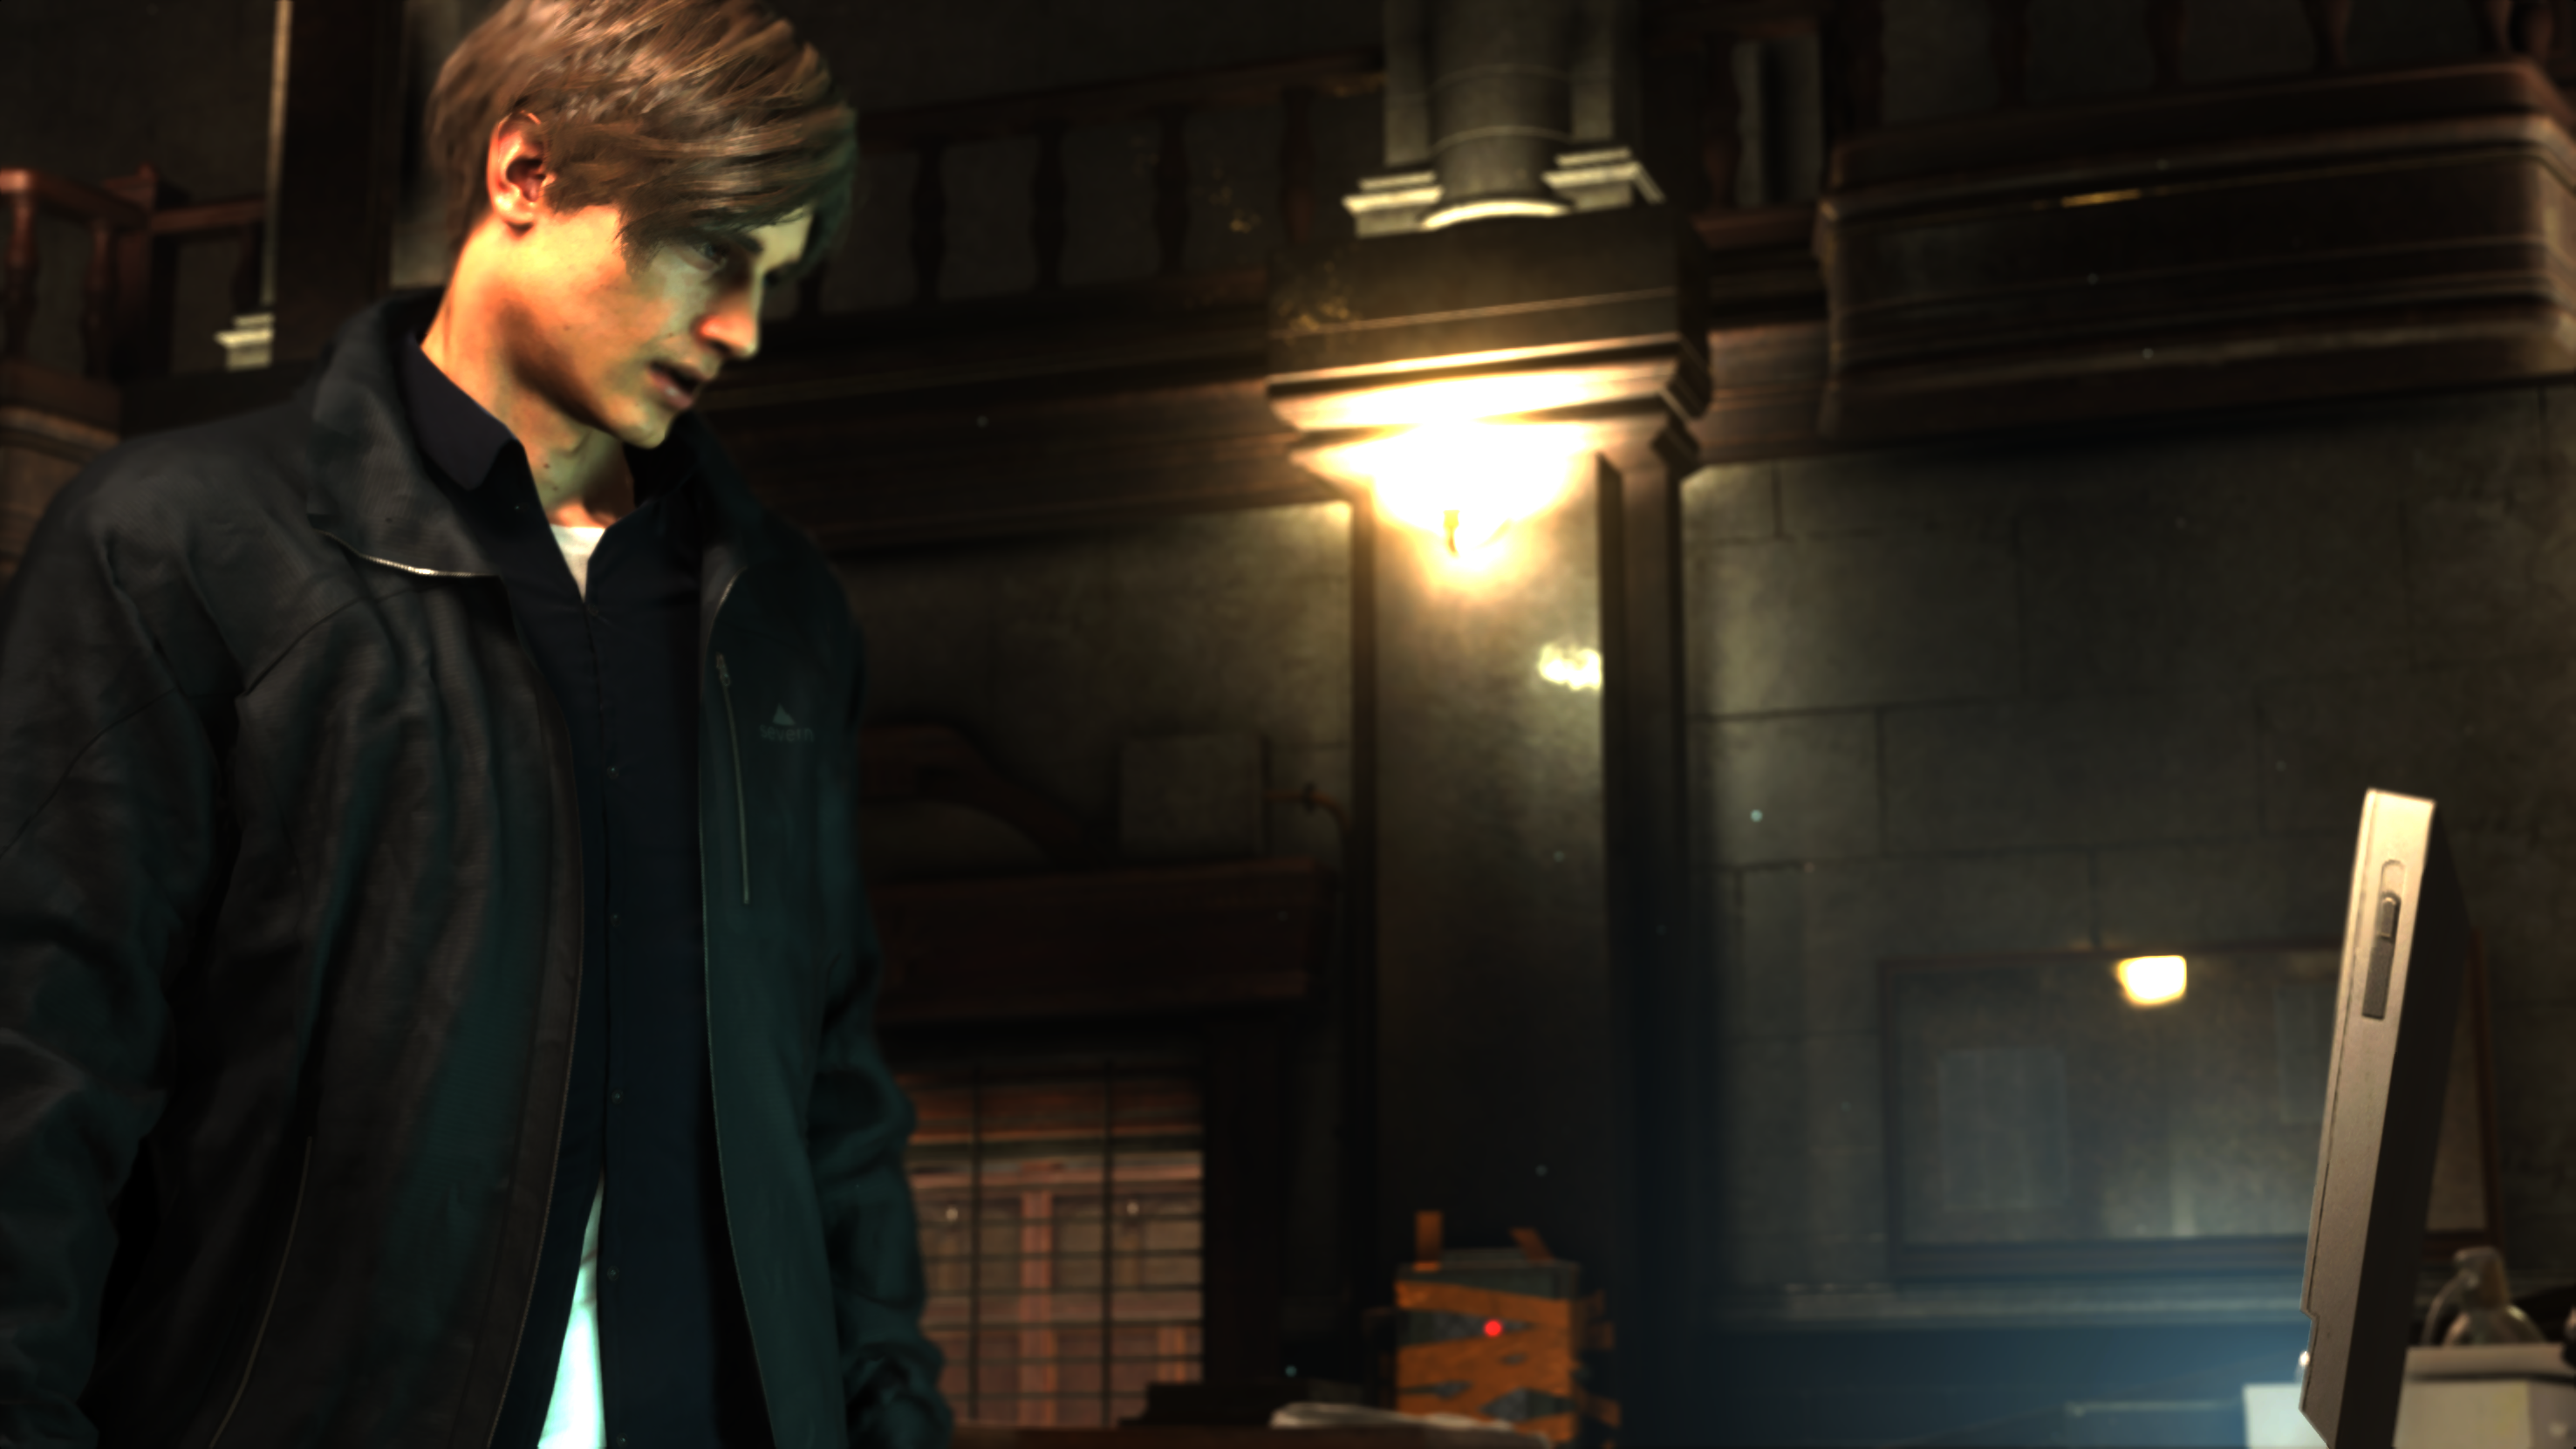

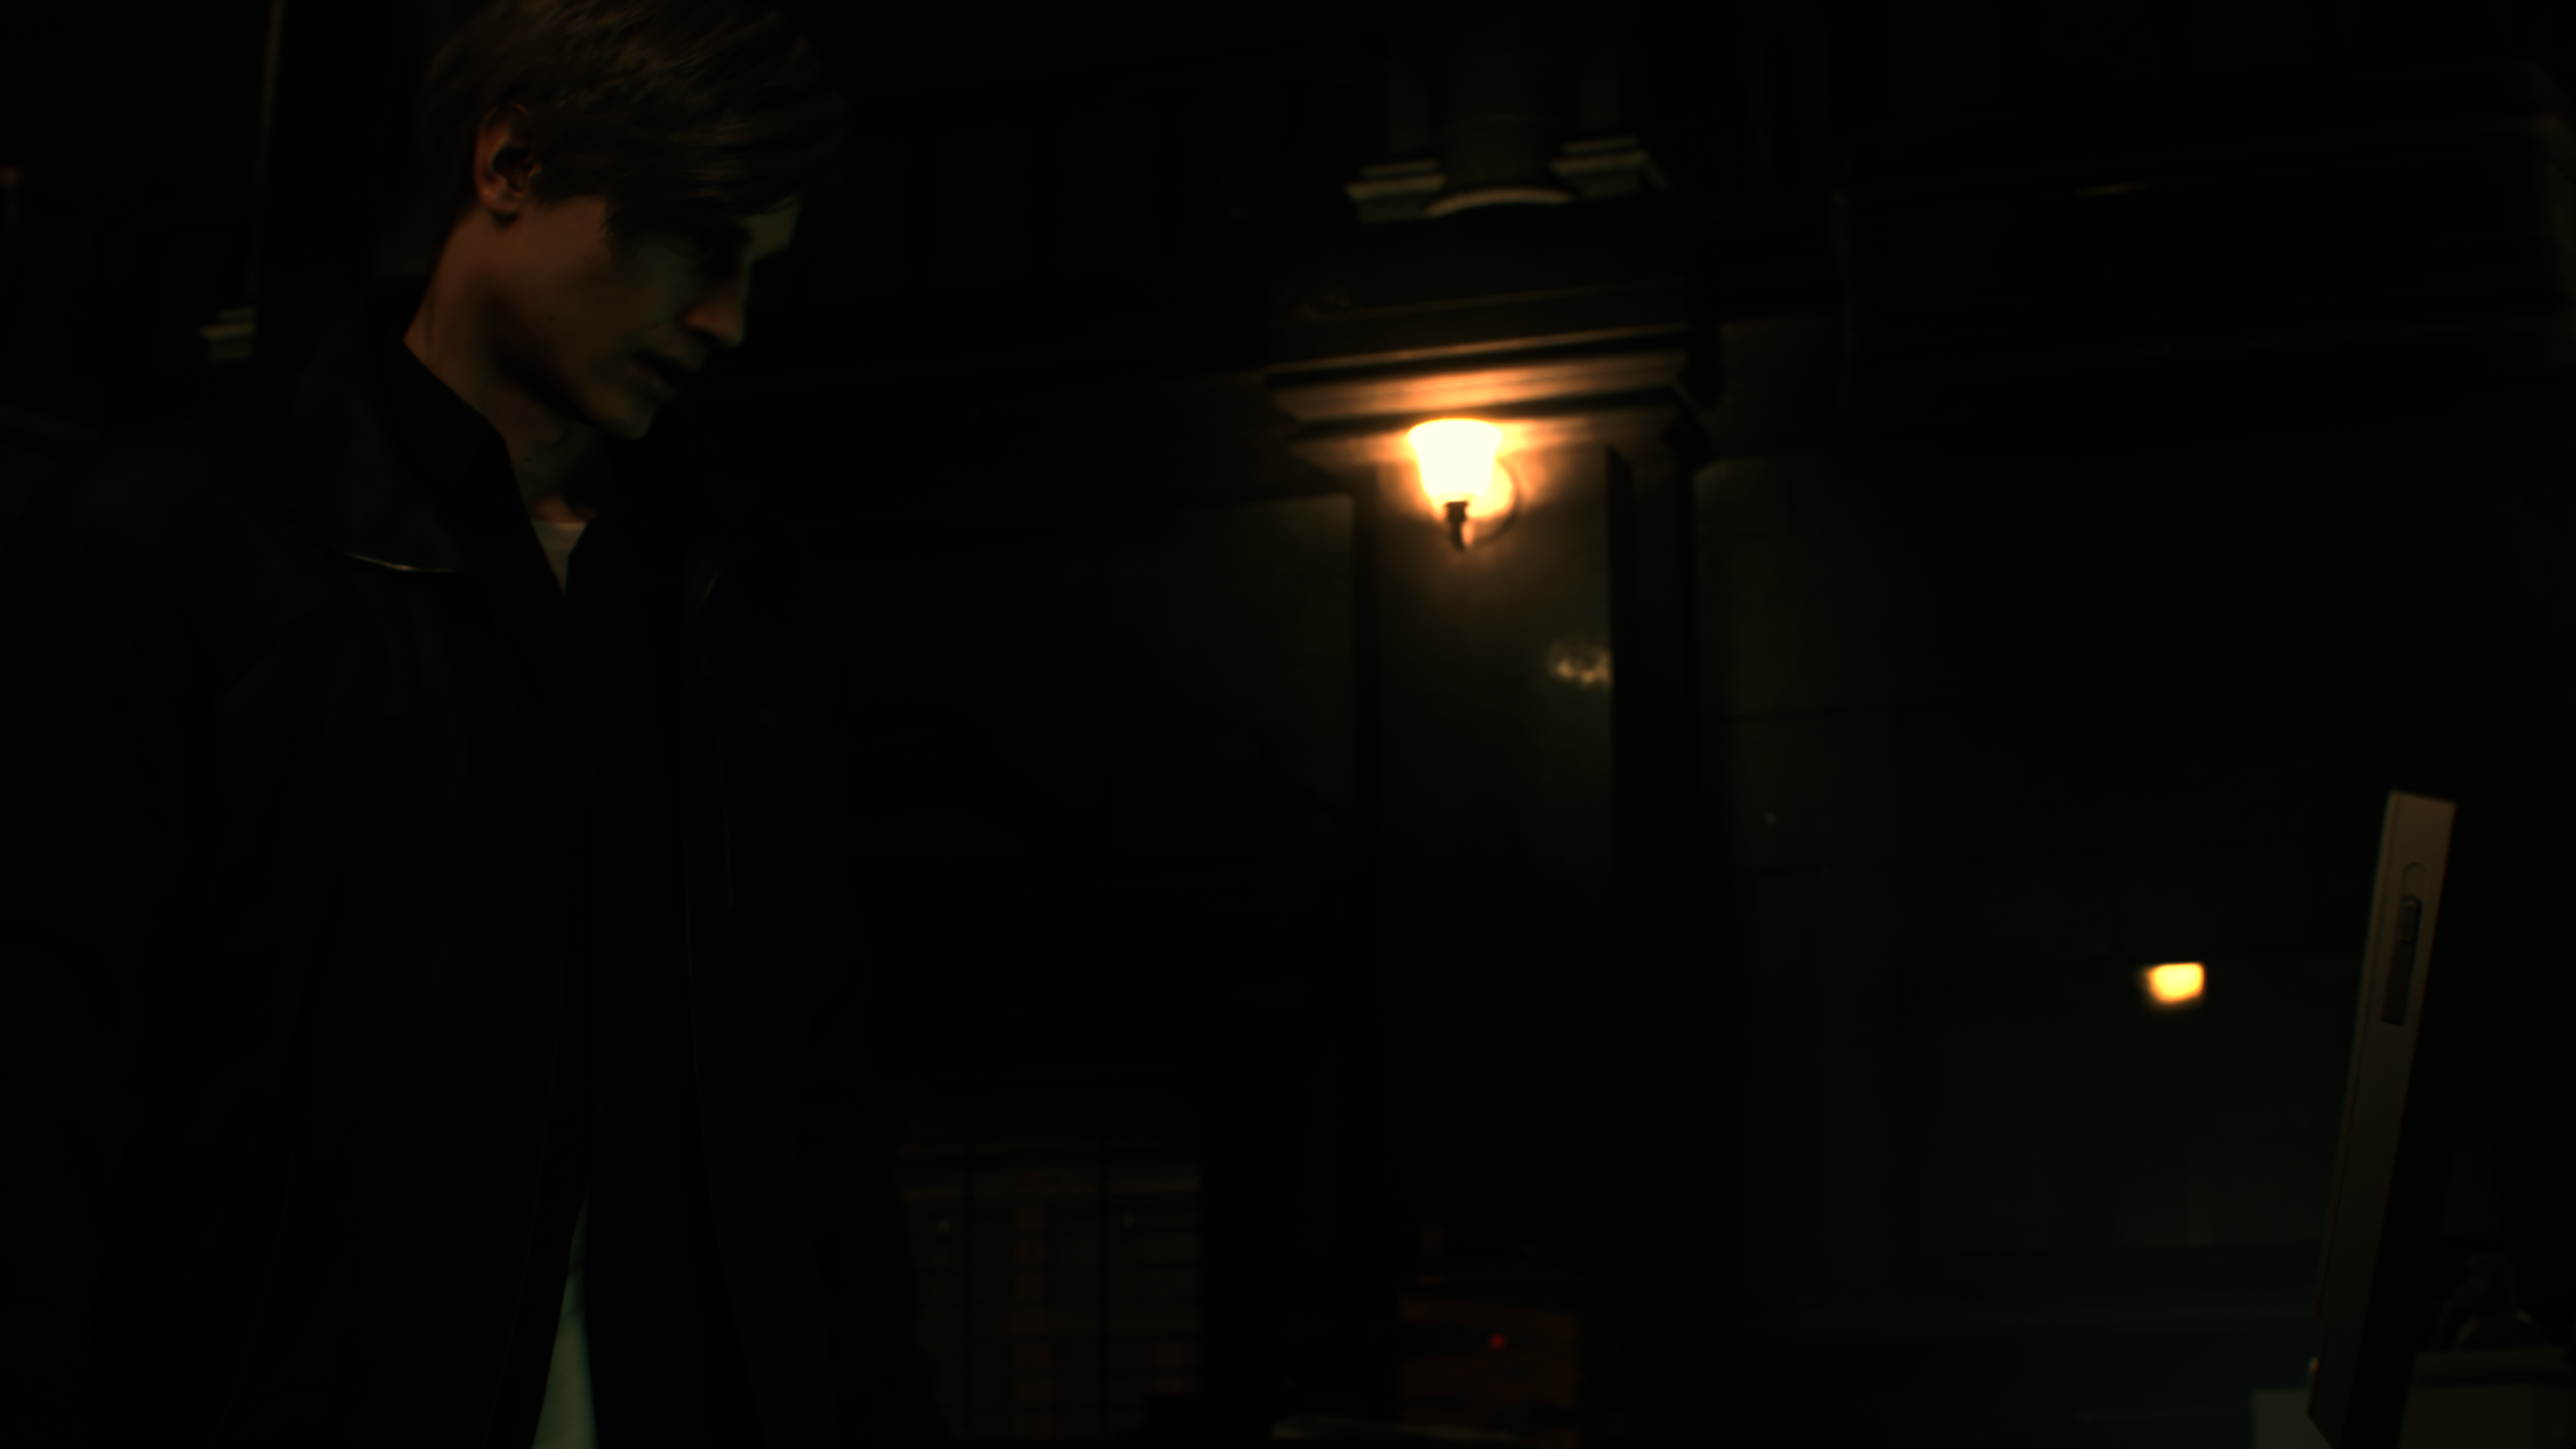


In addition to the few LUTs that goes into that pass, there is couple of 8*8 used as “Blame” texture, yet i never found any variations for those, in all my captures, those were pure white!


Each is a 8*8 – BC1_SRGB. The 1st is color where the later used as alpha
Those post-processors are all self explanatory by their names. That post-processing stack includes (in no specific order with the data passed to the shader that is related to each)
Panini Projection
Panini Projection Param
struct PaniniProjectionParam
{
	float4 fOptimizedParam;
}
Radial Blur
Radial Blur Compute Result SRV
struct RadialBlurComputeResult
{
	float computeAlpha;
}
Radial Blur Render Param
struct RadialBlurRenderParam
{
	float4 cbRadialColor;
	float2 cbRadialScreenPos;
	float2 cbRadialMaskSmoothstep;
	float2 cbRadialMaskRate;
	float cbRadialBlurPower;
	float cbRadialSharpRange;
	uint cbRadialBlurFlags;
	float cbRadialReserve0;
	float cbRadialReserve1;
	float cbRadialReserve2;
}
Film Grain
FilmGrainParam
struct FilmGrainParam
{
	float2 fNoisePower;
	float2 fNoiseUVOffset;
	float fNoiseDensity;
	float fNoiseContrast;
	float fBlendRate;
	float fReverseNoiseSize;
}
Color Correct
Color Correct Texture
struct ColorCorrectTexture
{
	float fTextureSize;
	float fTextureBlendRate;
	float fTextureBlendRate2;
	float fTextureInverseSize;
	float4x4 fColorMatrix;
}
Color Deficient
Color Deficient Table
struct ColorDeficientTable
{
	float4 cvdR;
	float4 cvdG;
	float4 cvdB;
}
Color Levels
Image Plane Param
struct ImagePlaneParam
{
	float4 ColorParam;
	float Levels_Rate;
	float Levels_Range;
	uint Blend_Type;
}
Strange struct name..huh!
Camera Kerare (Vignette)
I’ve worked in China for over a decade, but never saw tech terms been translated in code to the “sound/pronunciation ” of the native language ^_^ the term either written in English as is, or written in Chinese. Anyways, Kerare is the sound/pronunciation of the word ケラレ in Japanese, which means Vignette. This is bizarre, and was fun to spot!
Camera Kerare
struct CameraKerare
{
	float kerare_scale;
	float kerare_offset;
	float kerare_brightness;
}
Tone Mapping
Tonemap Param
struct TonemapParam
{
	float contrast;
	float linearBegin;
	float linearLength;
	float toe;
	float maxNit;
	float linearStart;
	float displayMaxNitSubContrastFactor;
	float contrastFactor;
	float mulLinearStartContrastFactor;
	float invLinearBegin;
	float madLinearStartContrastFactor;
}
Lens Distortion
Lens Distortion Param
struct LensDistortionParam
{
	float fDistortionCoef;
	float fRefraction;
	uint aberrationEnable;
	uint distortionType;
	float fCorrectCoef;
	uint reserve1;
	uint reserve2;
	uint reserve3;
}
AMD Fidelity FX [Compute]
i guess i would call that section AMD Fidelity FX Cart, not because i only L💘VE AMD Fidelity FX family of features, but i do believe this is what someone at RE Engine team wanted or planned. An isolation bucket for the AMD Fidelity FX post processors integrations for good… That way (almost) all Fidelity FX features can be together and follow eachother in the rendering pipeline (or cmd Queue or whatever you call it). And because of that shopping cart, they can easily go around the AMD shopping center, and easily remove or add new AMD items (if possible) into the shopping cart, or even remove all of them altogether at once with the least troubles. AMD stuff works great with other AMD stuff! I like the idea, and can see it in few projects already! Anyways, let’s see what other (apart from previously CACAO) AMD Fidelity FX features are supported yet in RE Engine (btw, shopping cart is what came to my mind once i saw that pattern, so it’s just personal taste in naming things)
FSR
If FSR is enabled, it takes place right away after the post processing. The result frame of the post processing get copied, and then FSR runs to output from the 2953*1661 of the format R11G11B10_FLOAT a new 3840*2160 of the same format. The resulted frame from FSR is not only larger, but also a little bit “smoother”. here are few examples for gameplay & cinematic frames before & after FSR


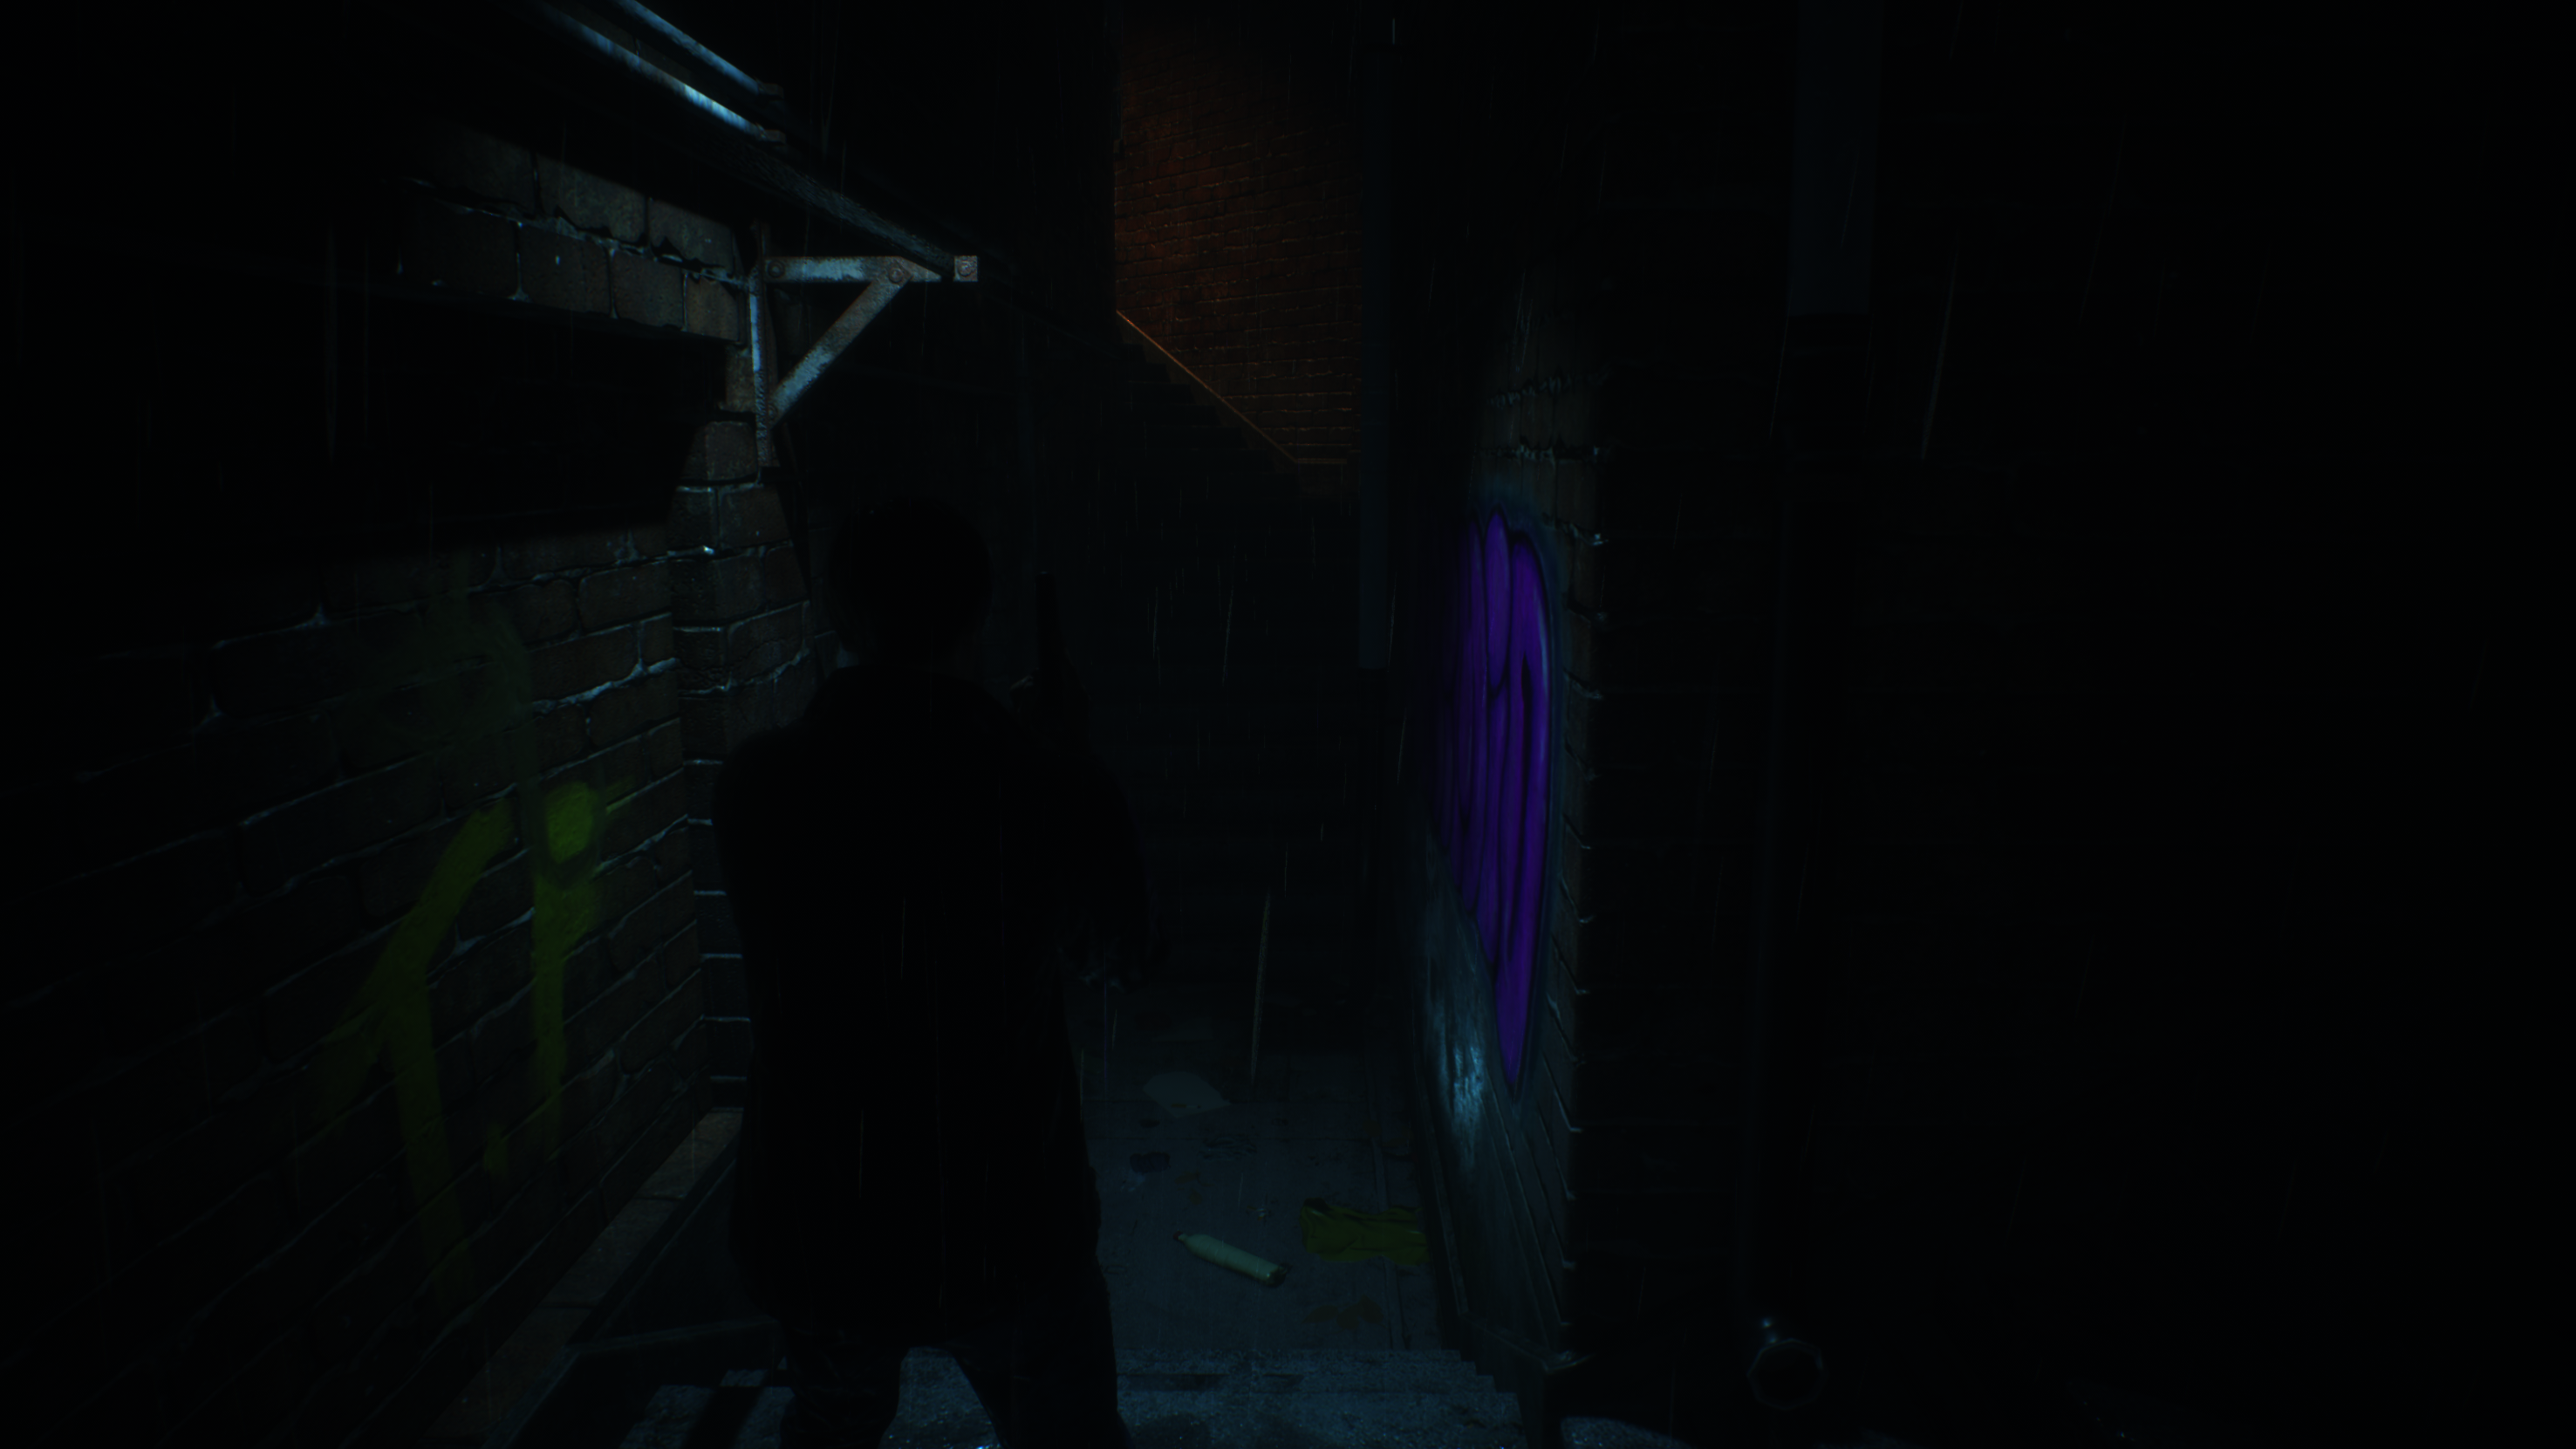

Totally Not Confirmed Note
When Anti-Aliasing is turned On and set to SMAA, it also happens roughly around that time.
CAS
After FSR, yet another AMD implementation kicks in the pipeline. yet another compute dispatch runs on the current SrcImage that just came out of FSR, this time it is the “Contrast Adaptive Sharpening” or CAS for short. While the impact of CAS is not very clear or even noticeable during cinematics, it is more obvious during gameplay.
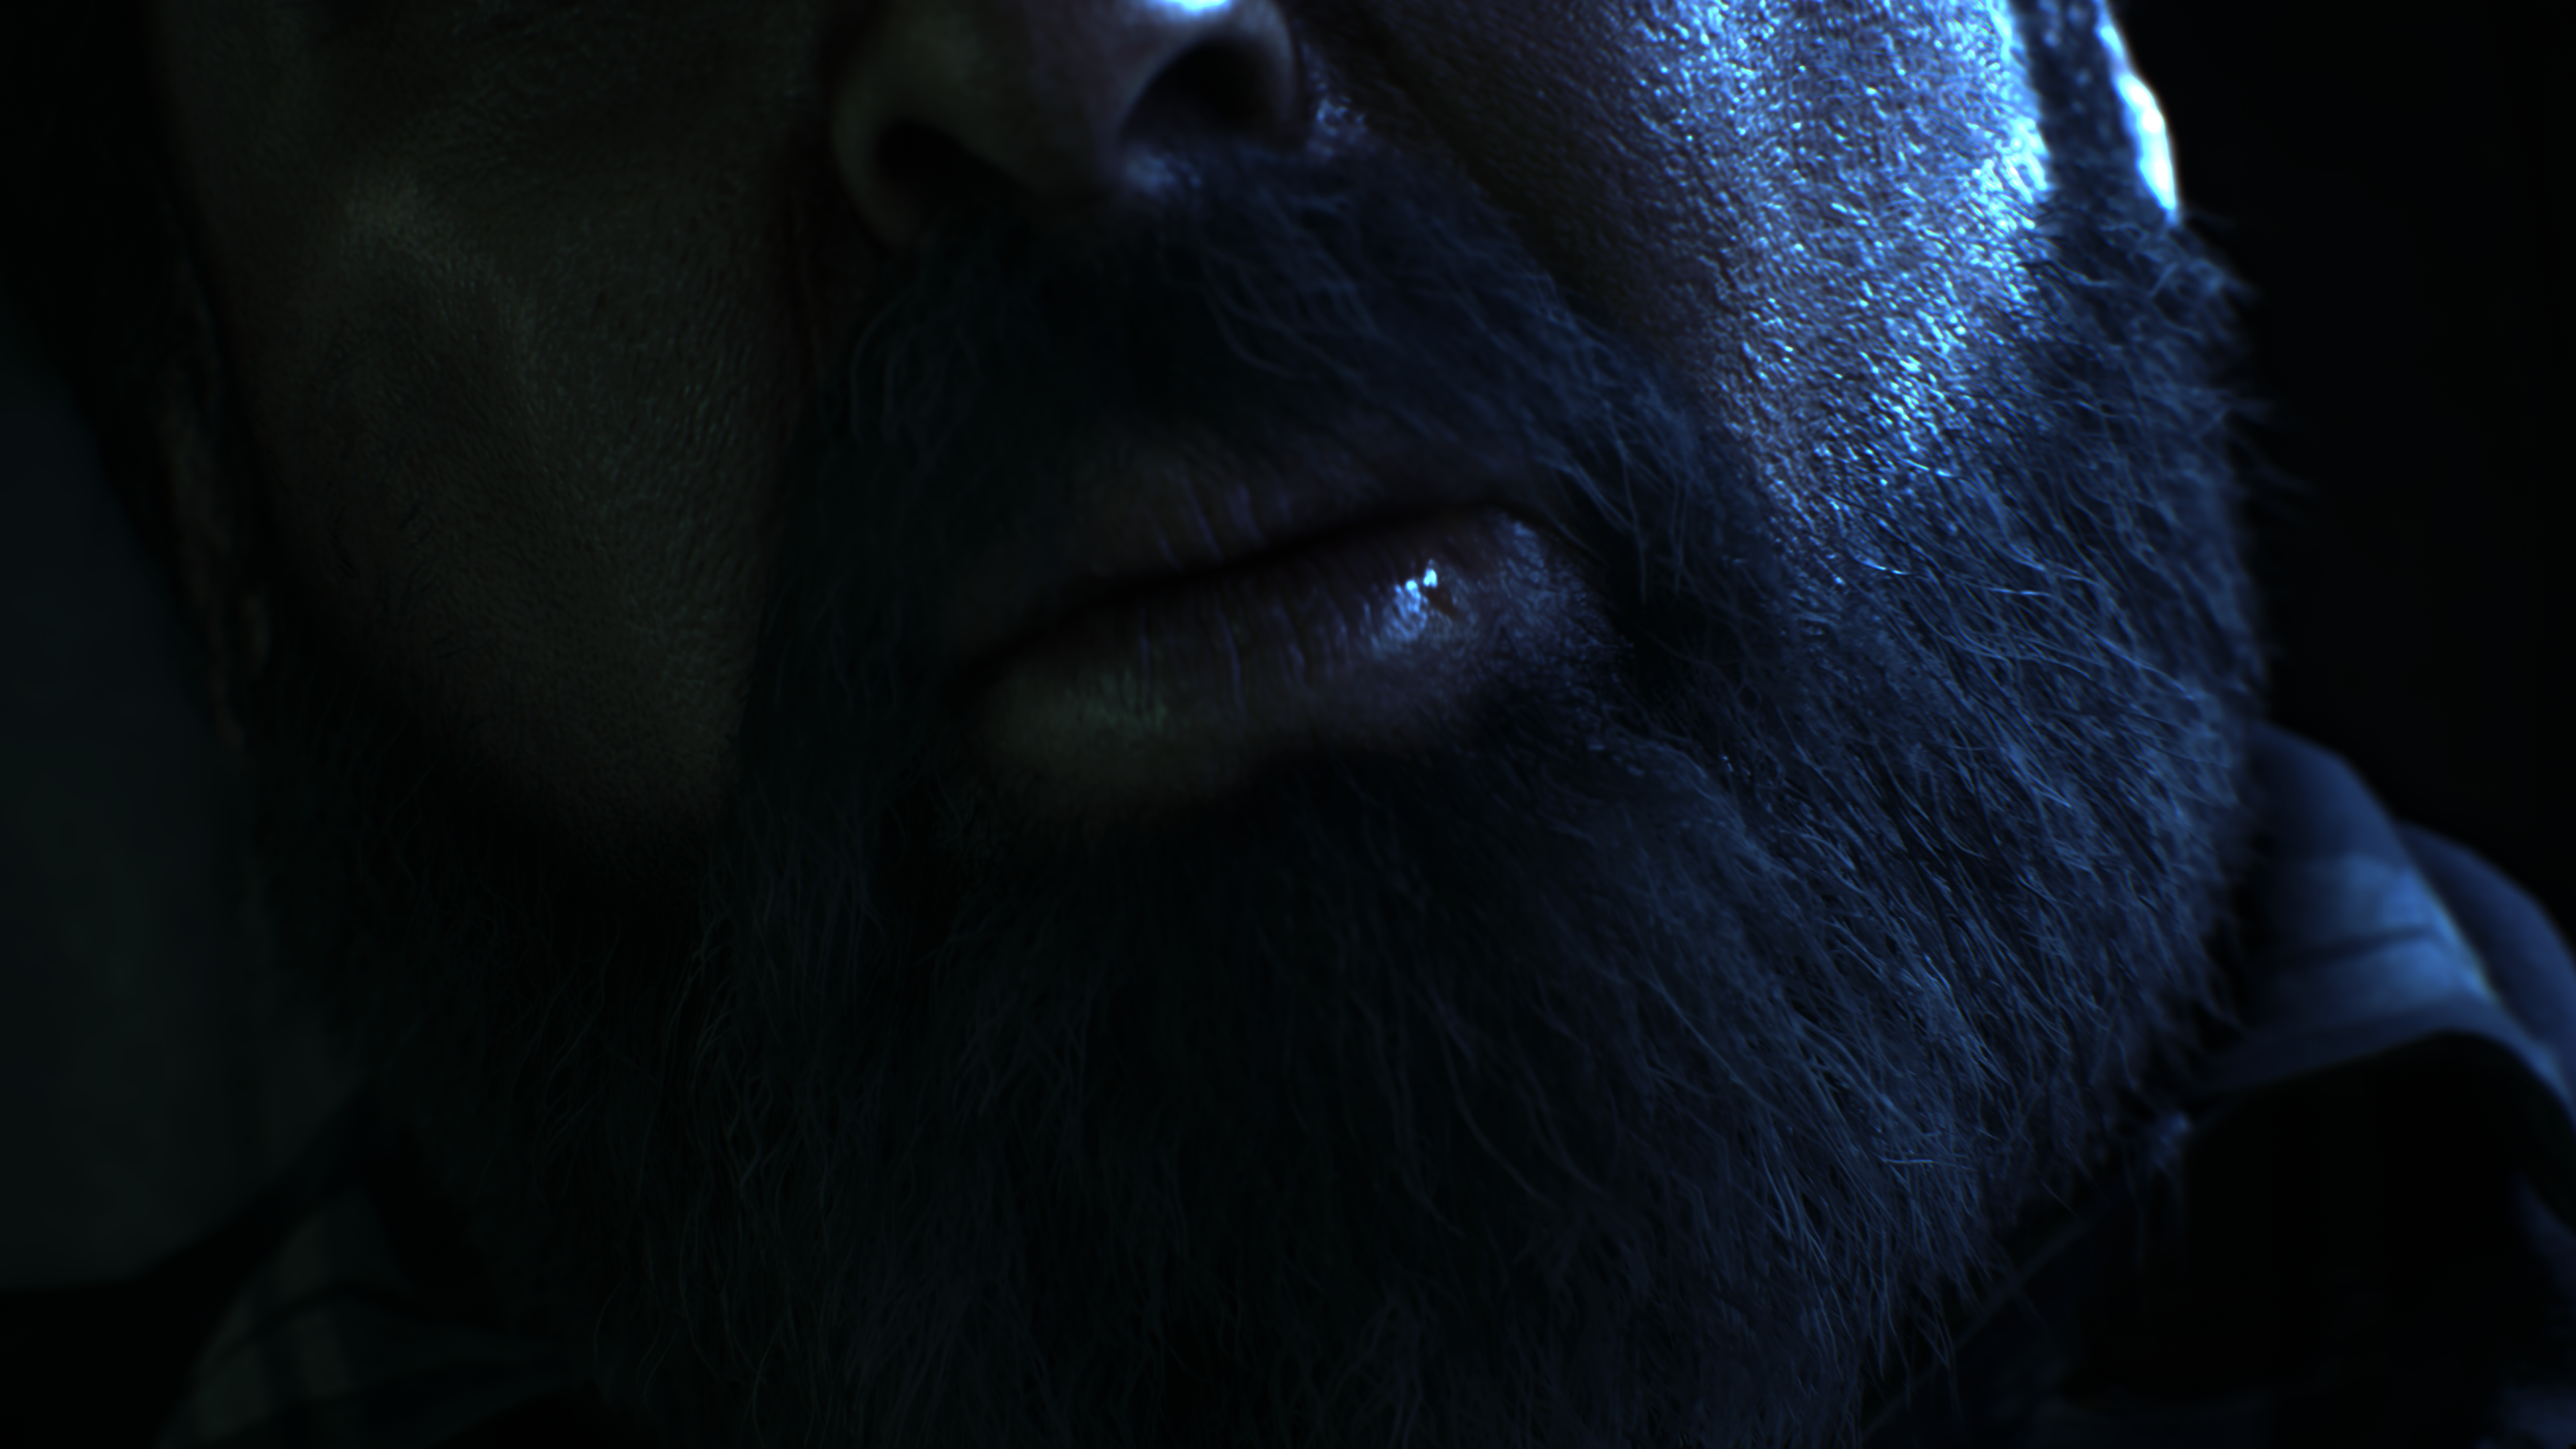


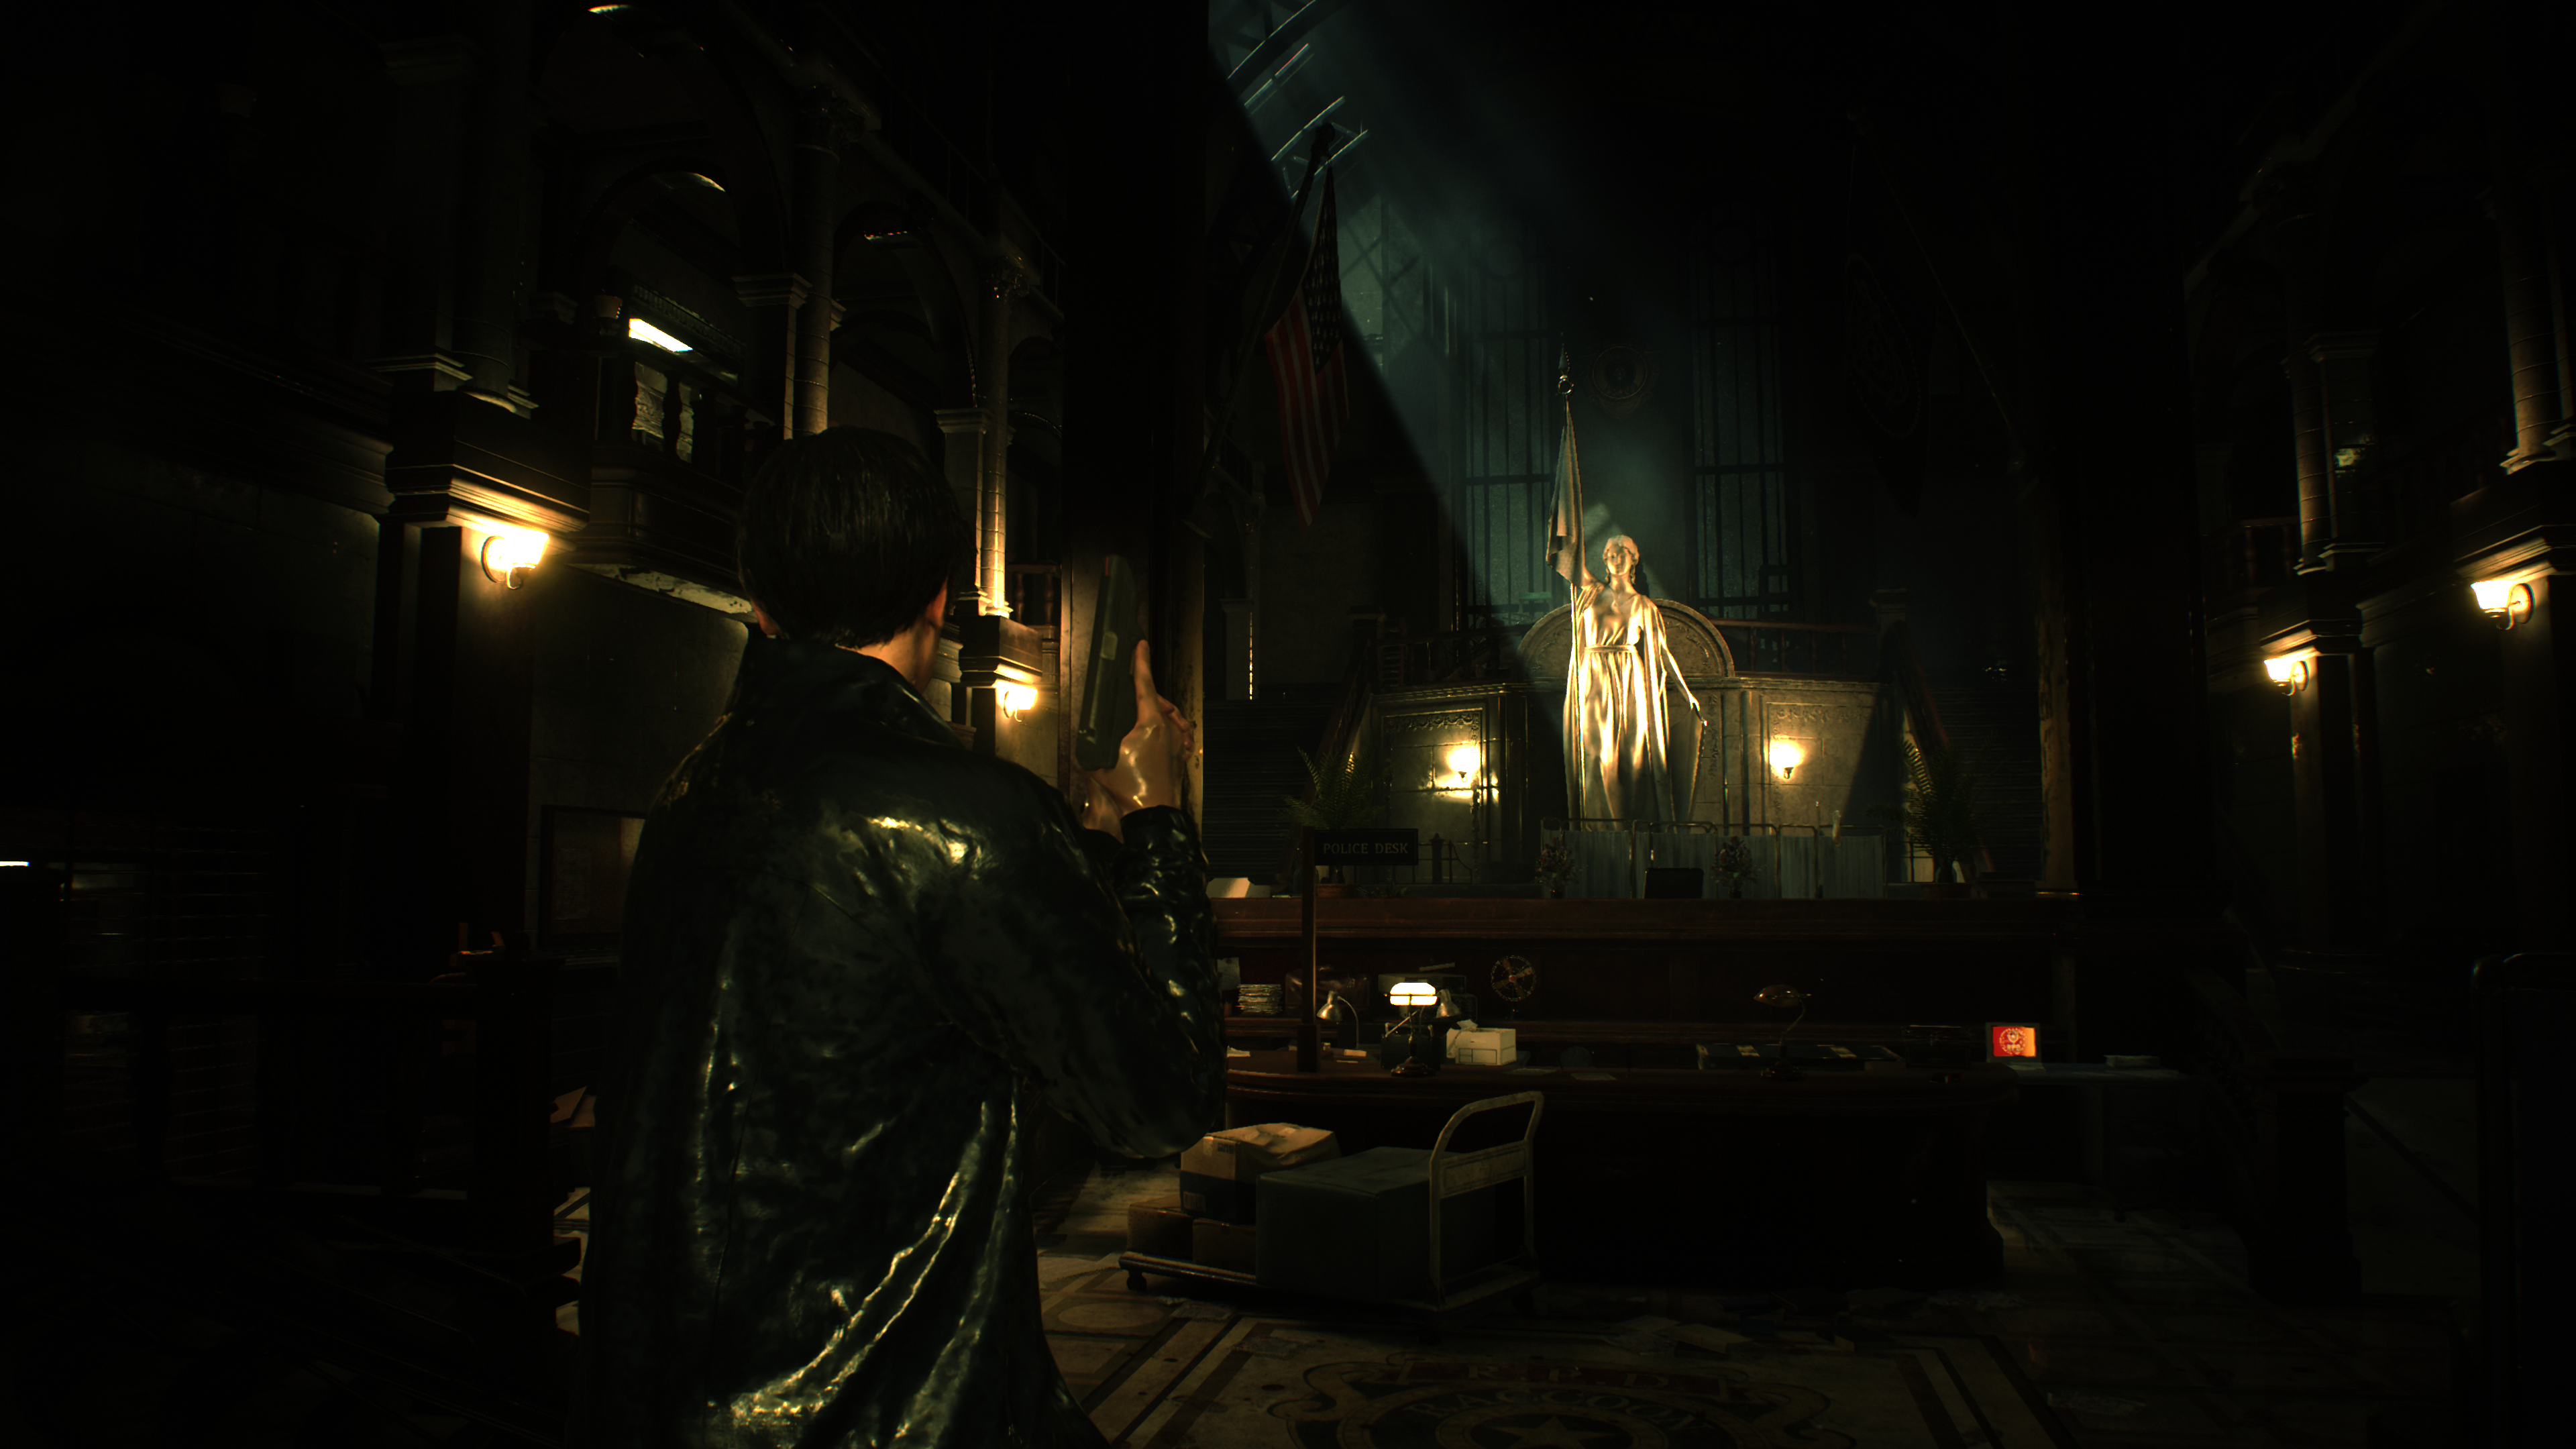


But let’s look closer at CAS for a gameplay frame…
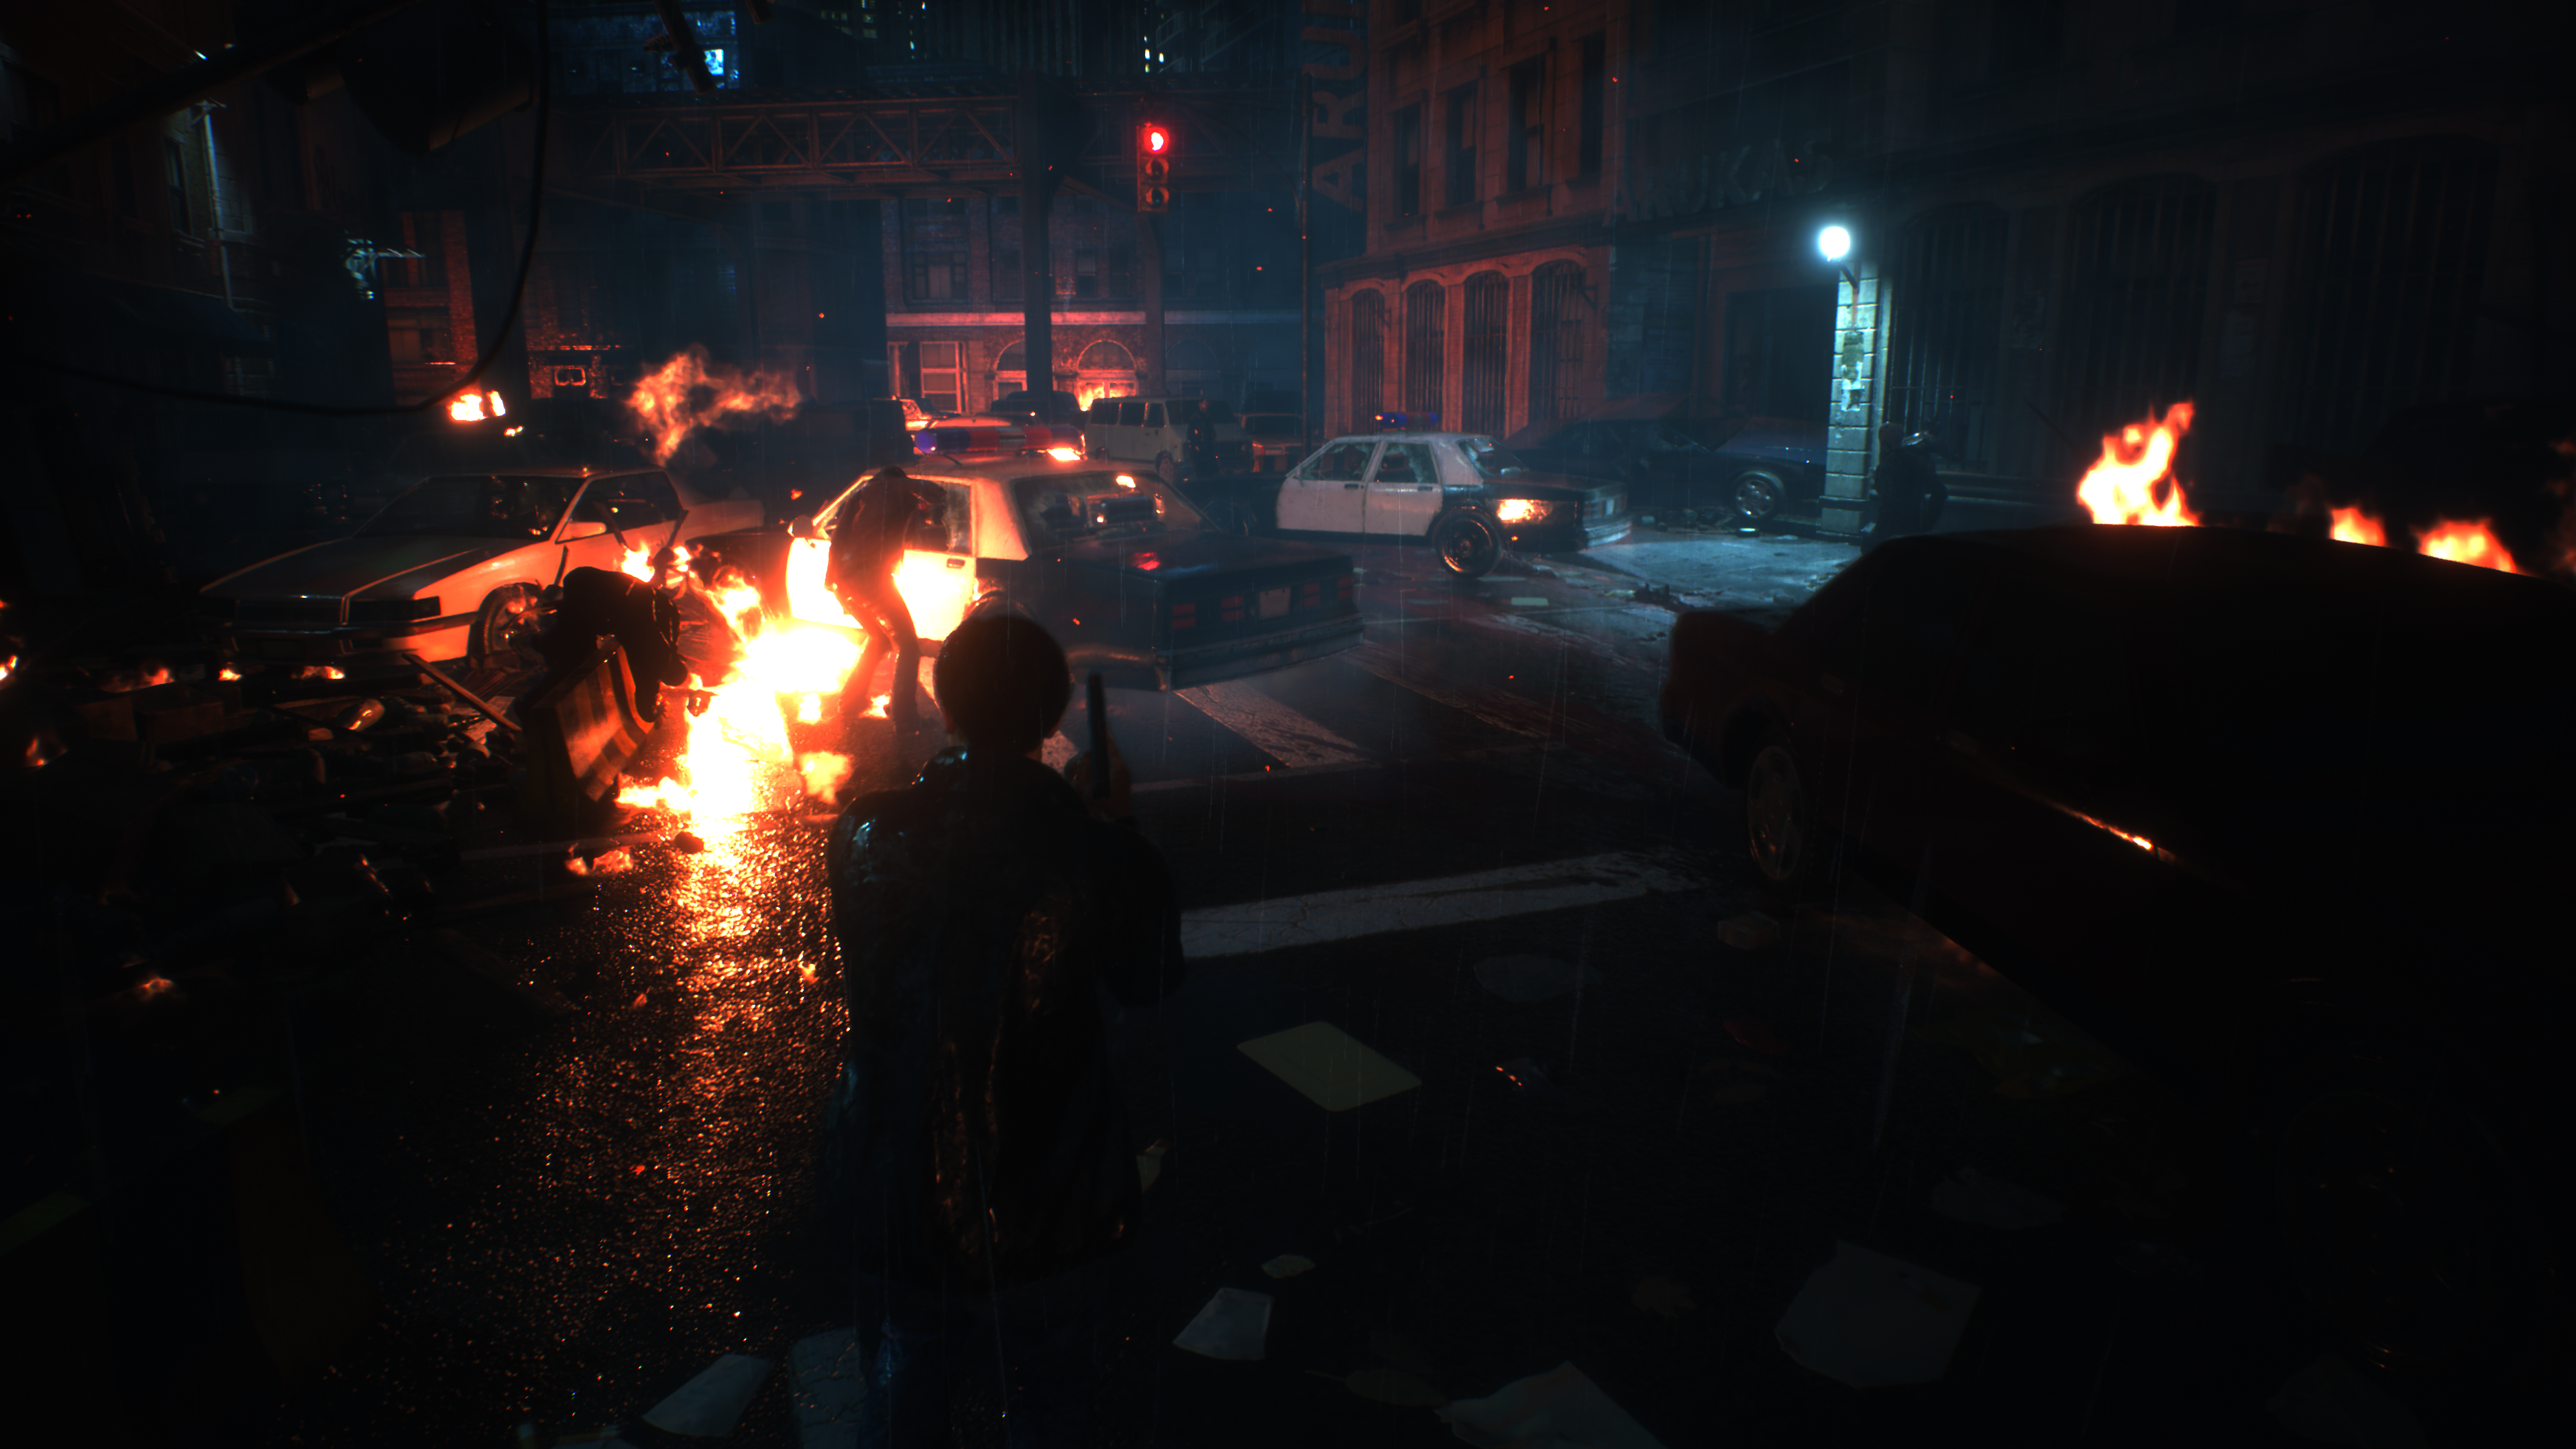

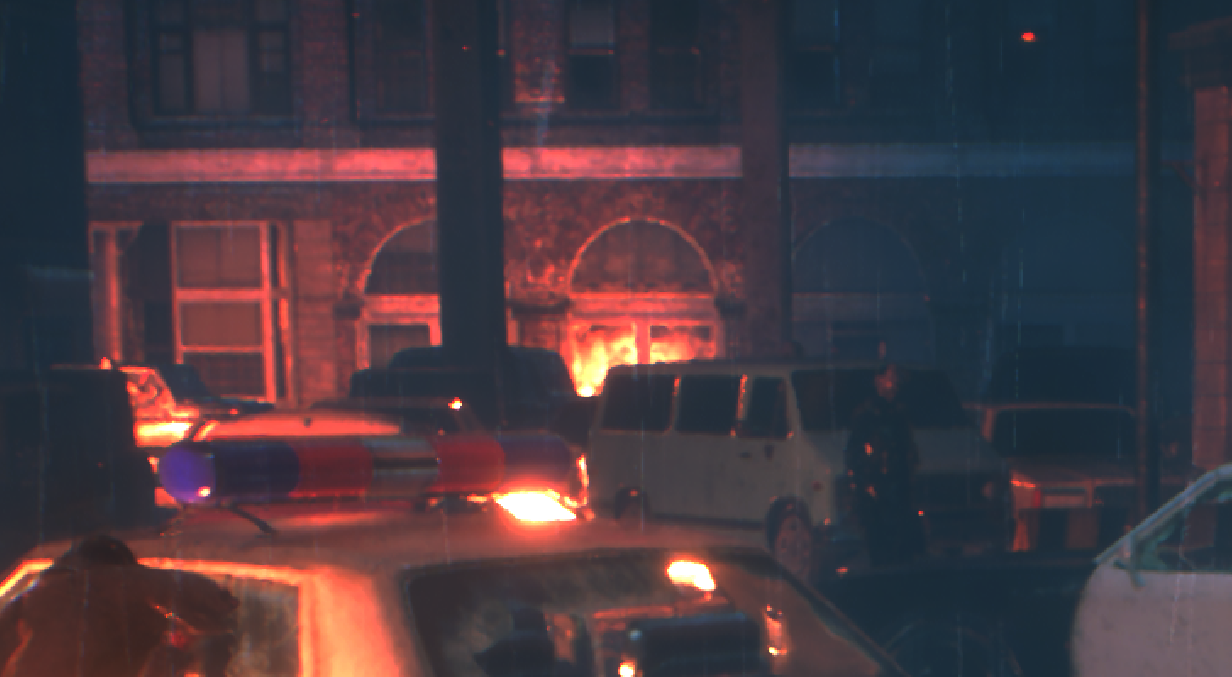

At first glance, you would think (and it’s true) that CAS is reducing or eliminating a previously applied effects such as DOF, Blur. Which makes no sense! But at the same time, if you check carefully earlier, mentioned that DOF is not happening during gameplay, and here i mentioned that CAS not happening during cinematics (or happen with very low un-noticeable value), so they don’t negate each other in reality. So having CAS (with high noticeable value) here during gameplay is can be more though of as a method to “deliver” better FSR output…
Regardless it is absent (in terms of being used in the frame) in cinematic frames or preset in gameplay, this little dispatch will always run, and i see this is a tiny area to improve, just keep it in the pipeline when needed, not all the time. But the interesting thing here is that, it is really forced and hidden!! You don’t have any sharpen values to control in the Graphics Settings, at the other hand you don’t have a toggle option for CAS as you’ve a toggle for FSR, and seem to matching perfectly for me with the theory from Digital Foundry’s video which is showcased here.
UI
This is the last color pass takes place in RE Engine game, and the good thing, it does it the way i like, it just paint right away to the frame at it’s current state. So it doesn’t write to an offscreen full size render target that get composited later (like Elden Ring & others). So whatever we write/paint here on top of the frame is going to be post processed later in the next step.
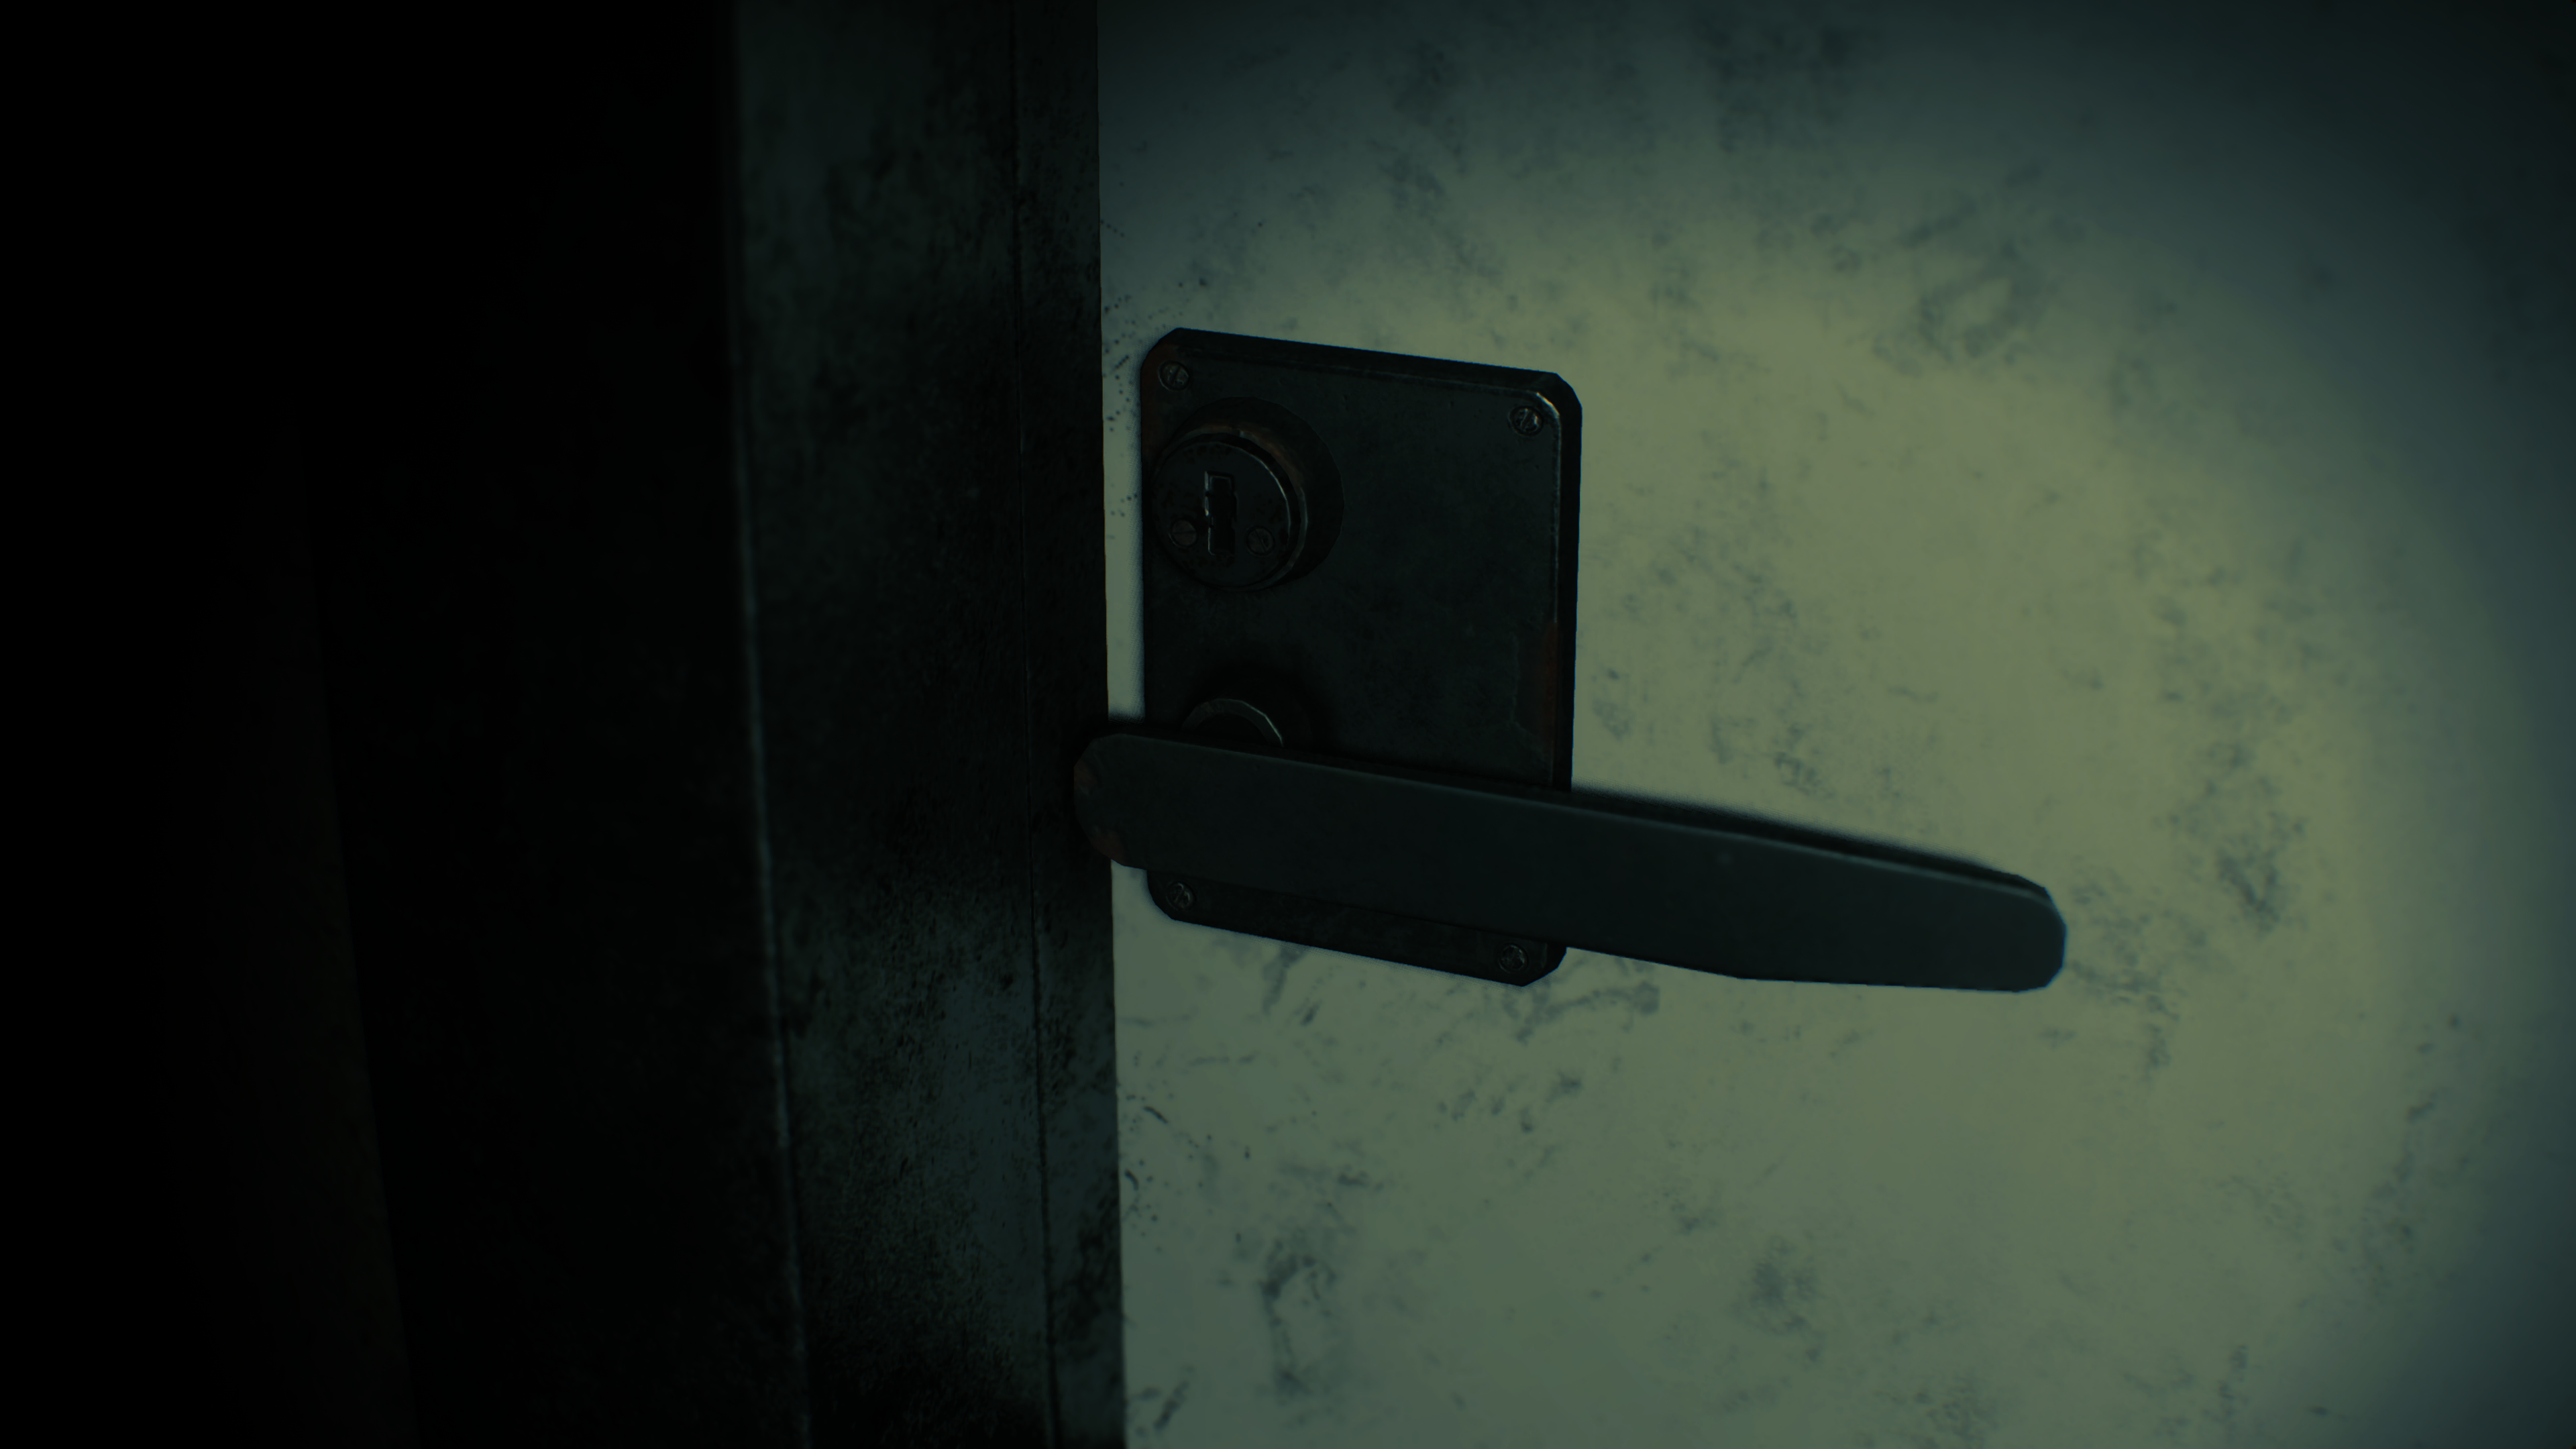
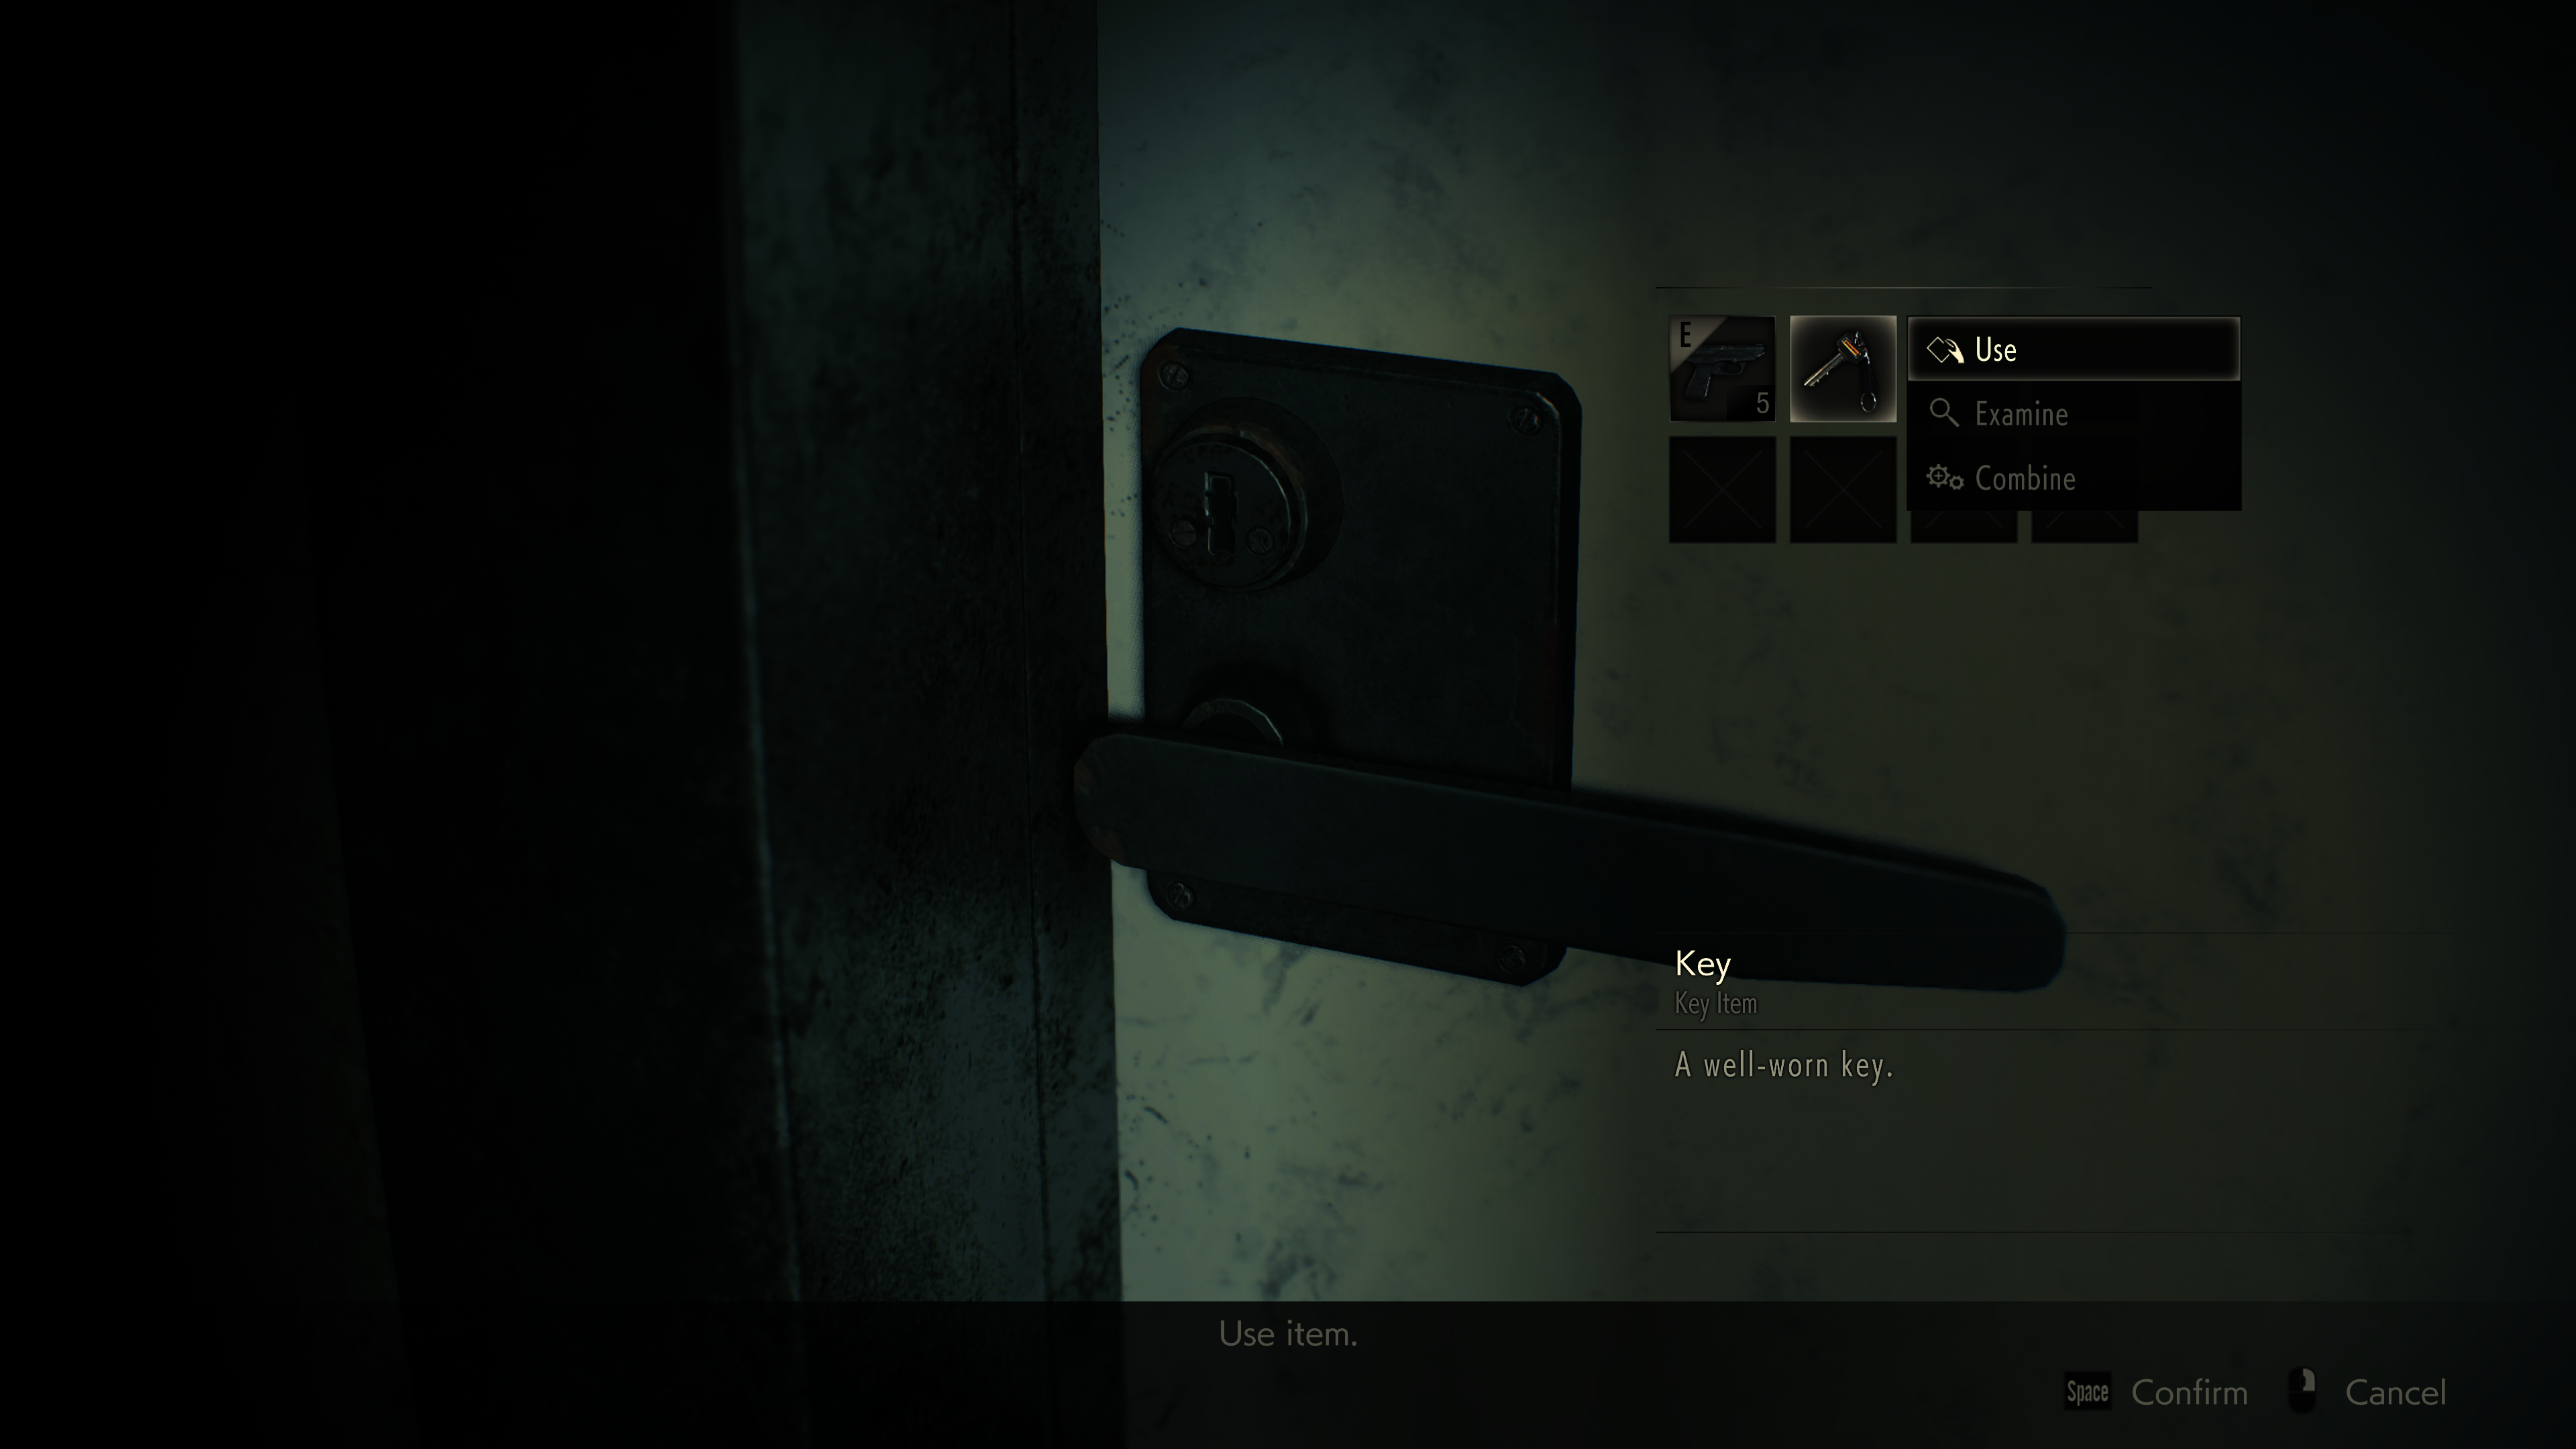
For this purpose, as expected, a group of sprites, atlases and fonts are used for that. Mostly around 5 atlases are used, which yet another great choice (check God of War). They are well categorized.
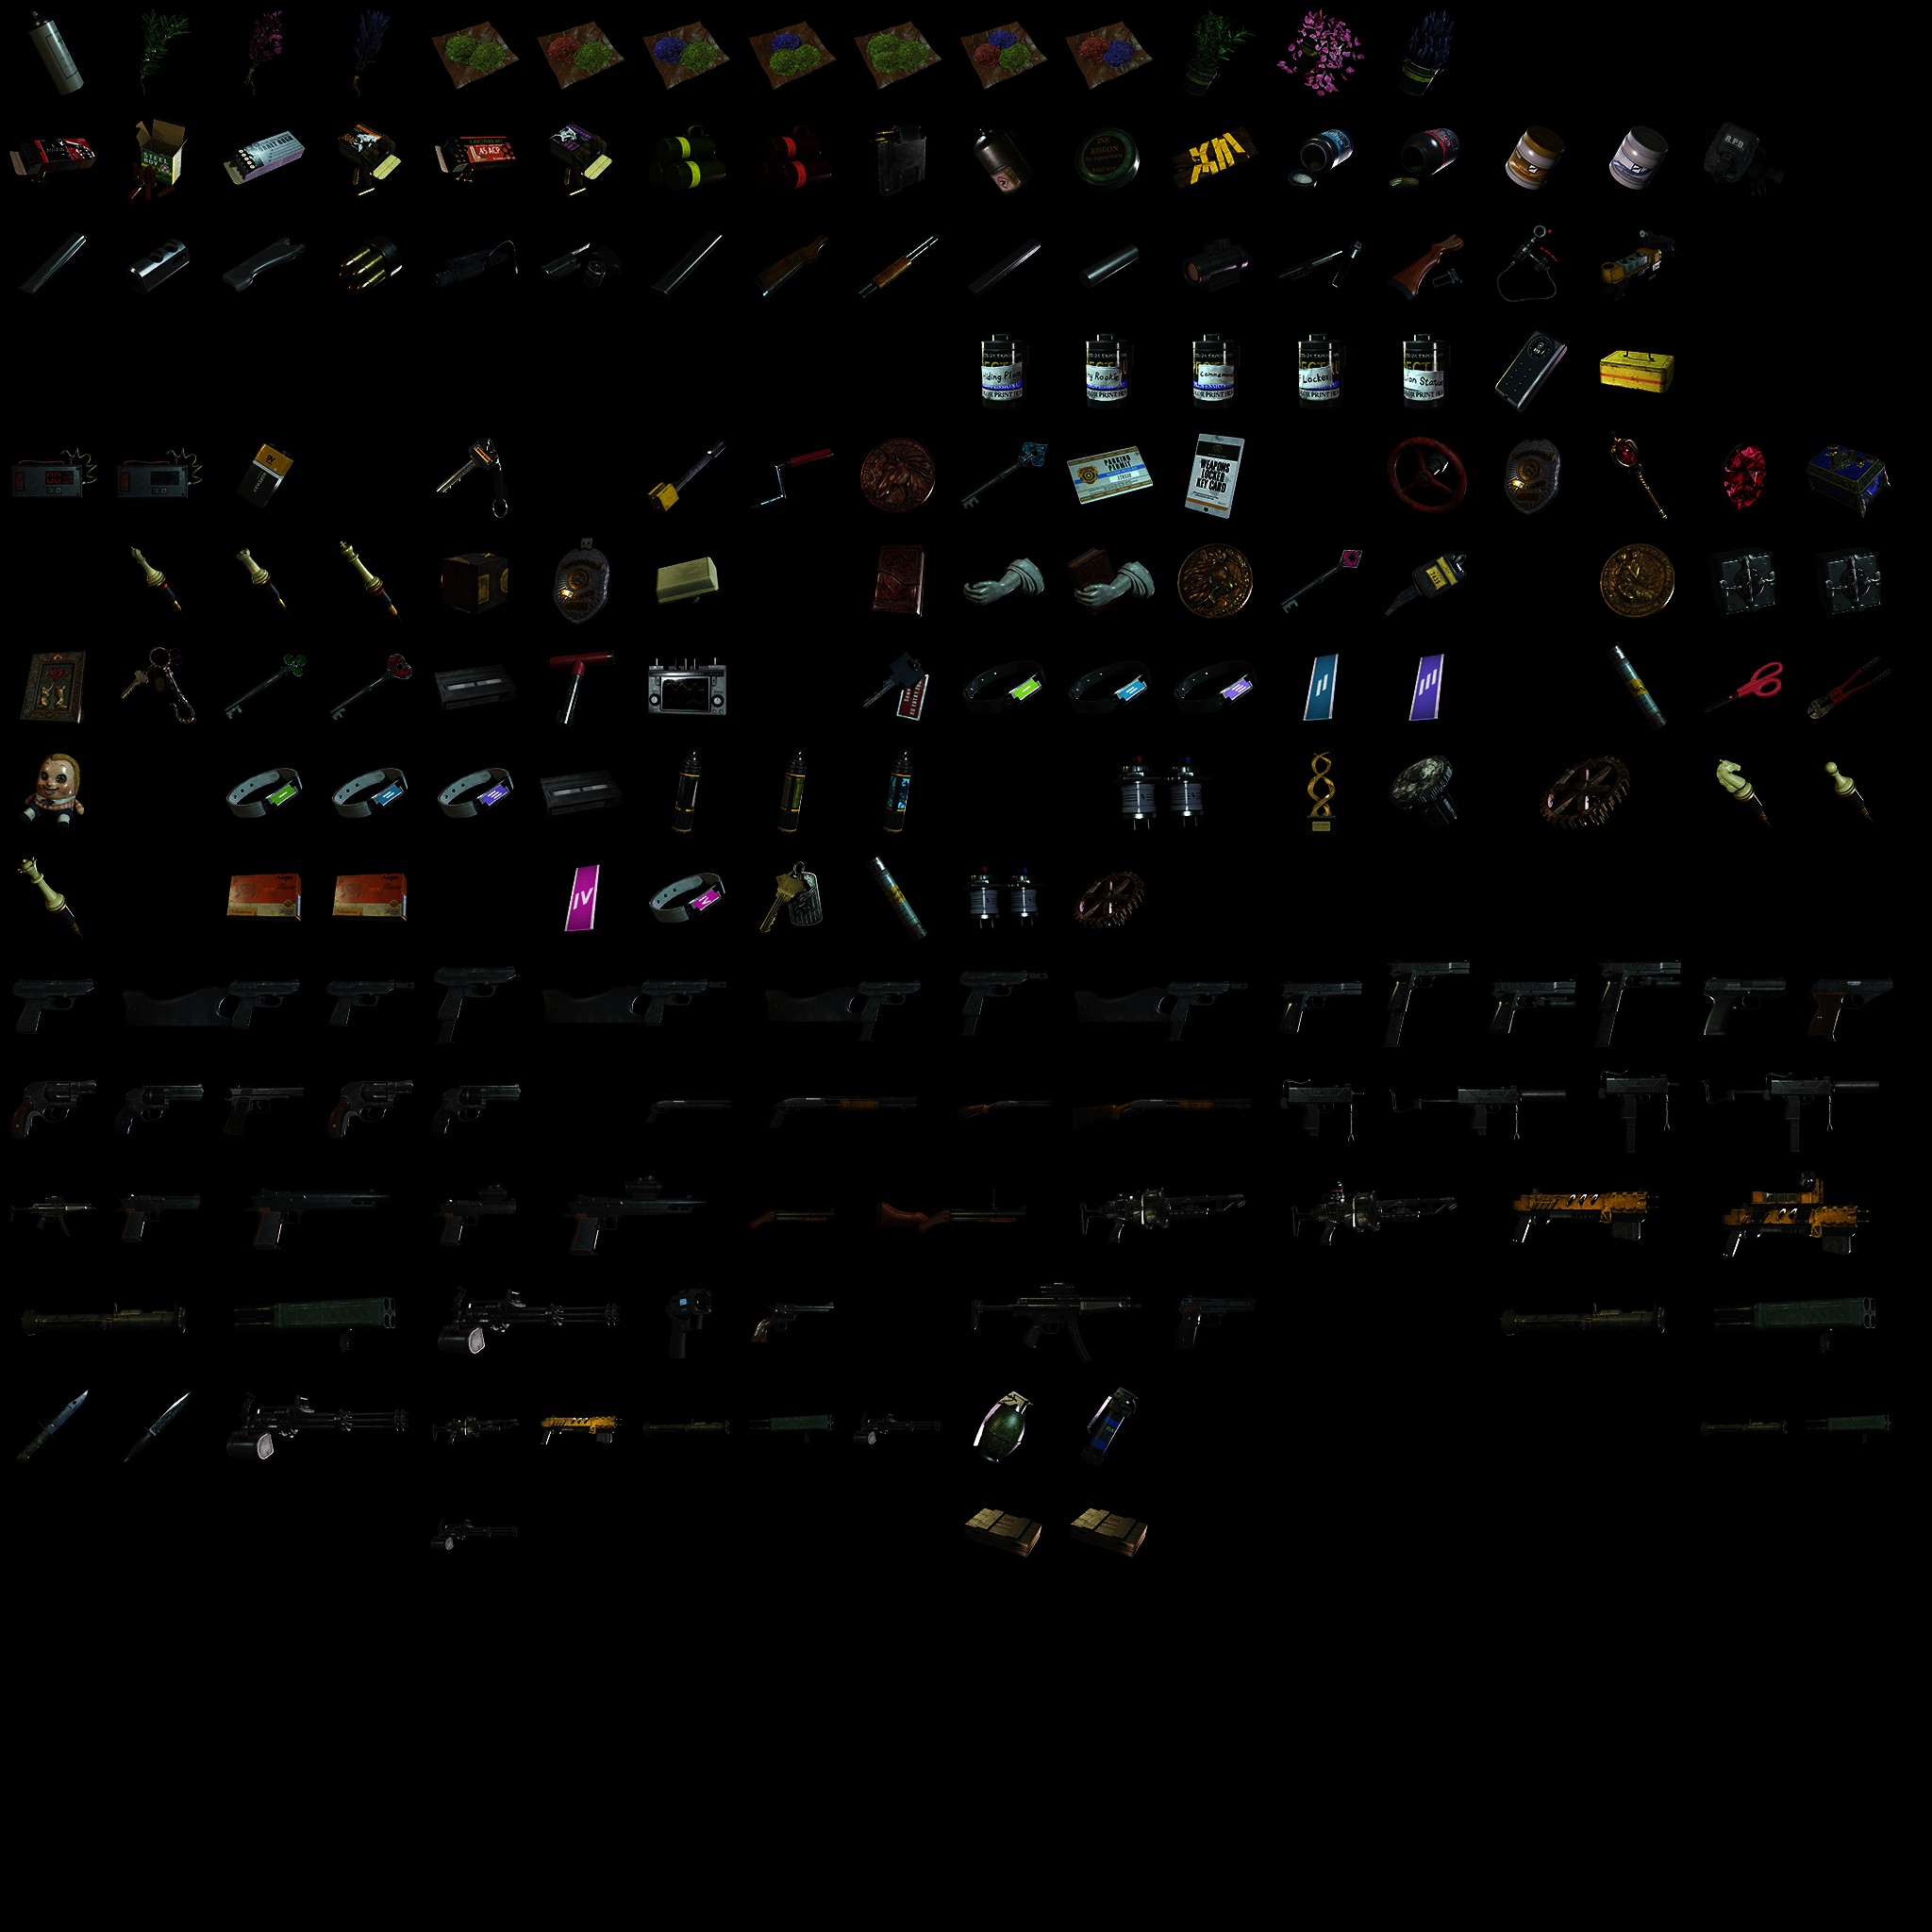
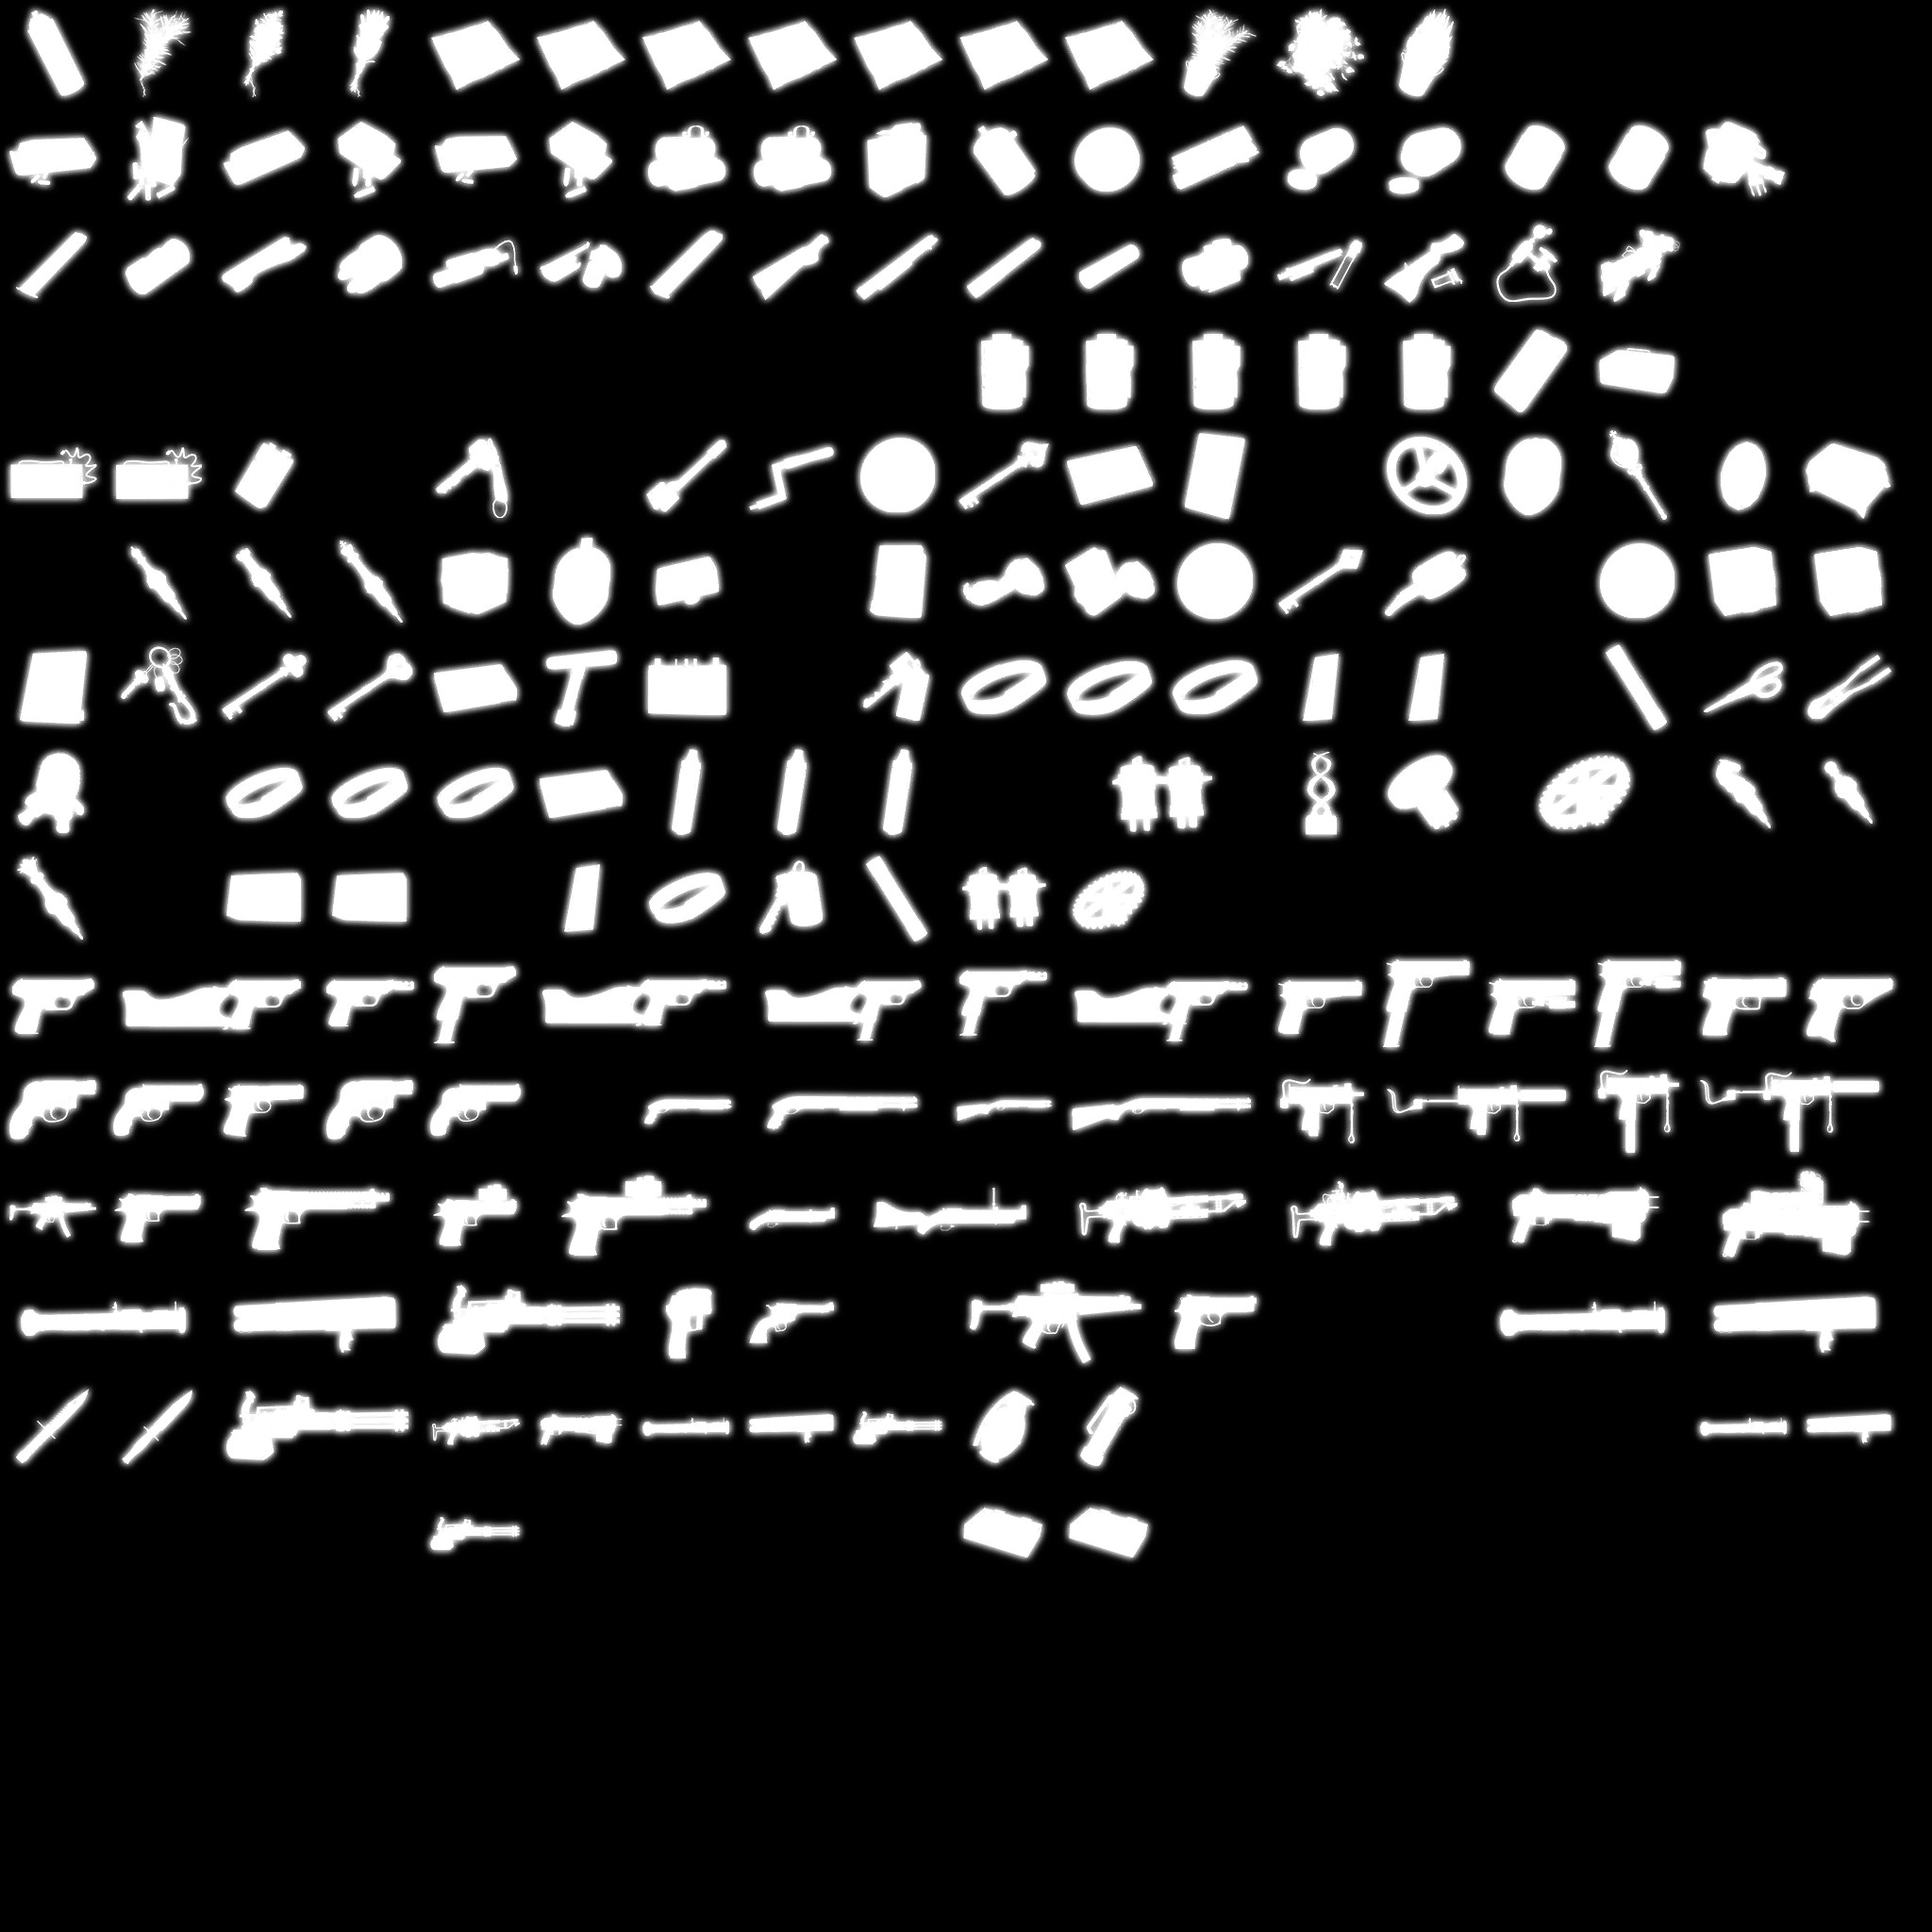
Is it me only who hates that font dropshadow atlas! Anyways, when put all together in a timelapse…
Click to go to YouTube 4K version
The interesting thing, that a 8*8 rect sprite is used for pretty much 70% of the draws. And unique things such as icons are used from the atlases, and the text of course from the font. The font have more than one atlas, in order to simulate the “shadow” behind the text.

And during the entire UI pass, there is only single params struct used and passed to all the draw, which is as follow
GUI Constant
struct GUIConstant
{
	float4x4 guiViewMatrix;
	float4x4 guiProjMatrix;
	float4x4 guiWorldMat;      //position of the item in screen/canvas space (3840*2160)
	float guiIntensity;
	float guiSaturation;
	float guiSoftParticleDist;
	float guiFilterParam;
	float4 guiScreenSizeRatio;
	float2 guiCaptureSizeRatio;
	float2 guiDistortionOffset;
	float guiFilterMipLevel;
	float guiStencilScale;
	uint guiDepthTestTargetStencil;
	uint guiShaderCommonFlag;
}
The bad part is that, even during cinematics, UI draw commands issued! Not a full pass, but it just issue couple of commands. This is the 2nd game in a row to have this bizarre choice. I still insist, UI can be skipped “safely” during cinematics!
The atlases shown before are not the only UI atlases, there are quite a few other, that shall be exist in specific times, thing like credits or menus would have that guy below

2048*2048 – BC7_UNORM_SRGB
i can only recognize couple of logos from that wall of fame!
Or other gameplay related atlases
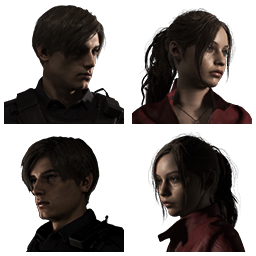
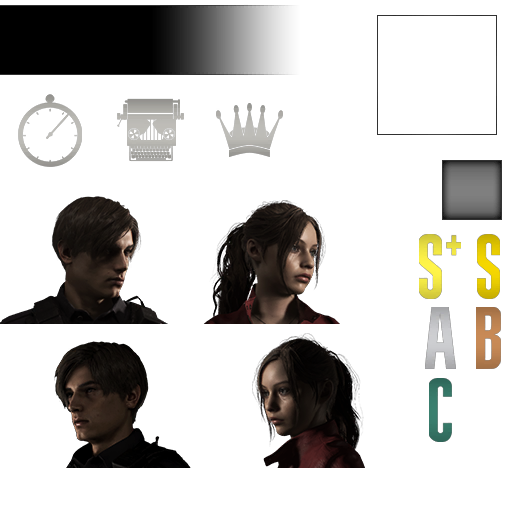
Output Color Adjustment
It would consider this as Post Processing as well, but it is really not. Or it can be considered as “late” post processing. This is needed the UI to be exist to things such as gamma correction takes place.

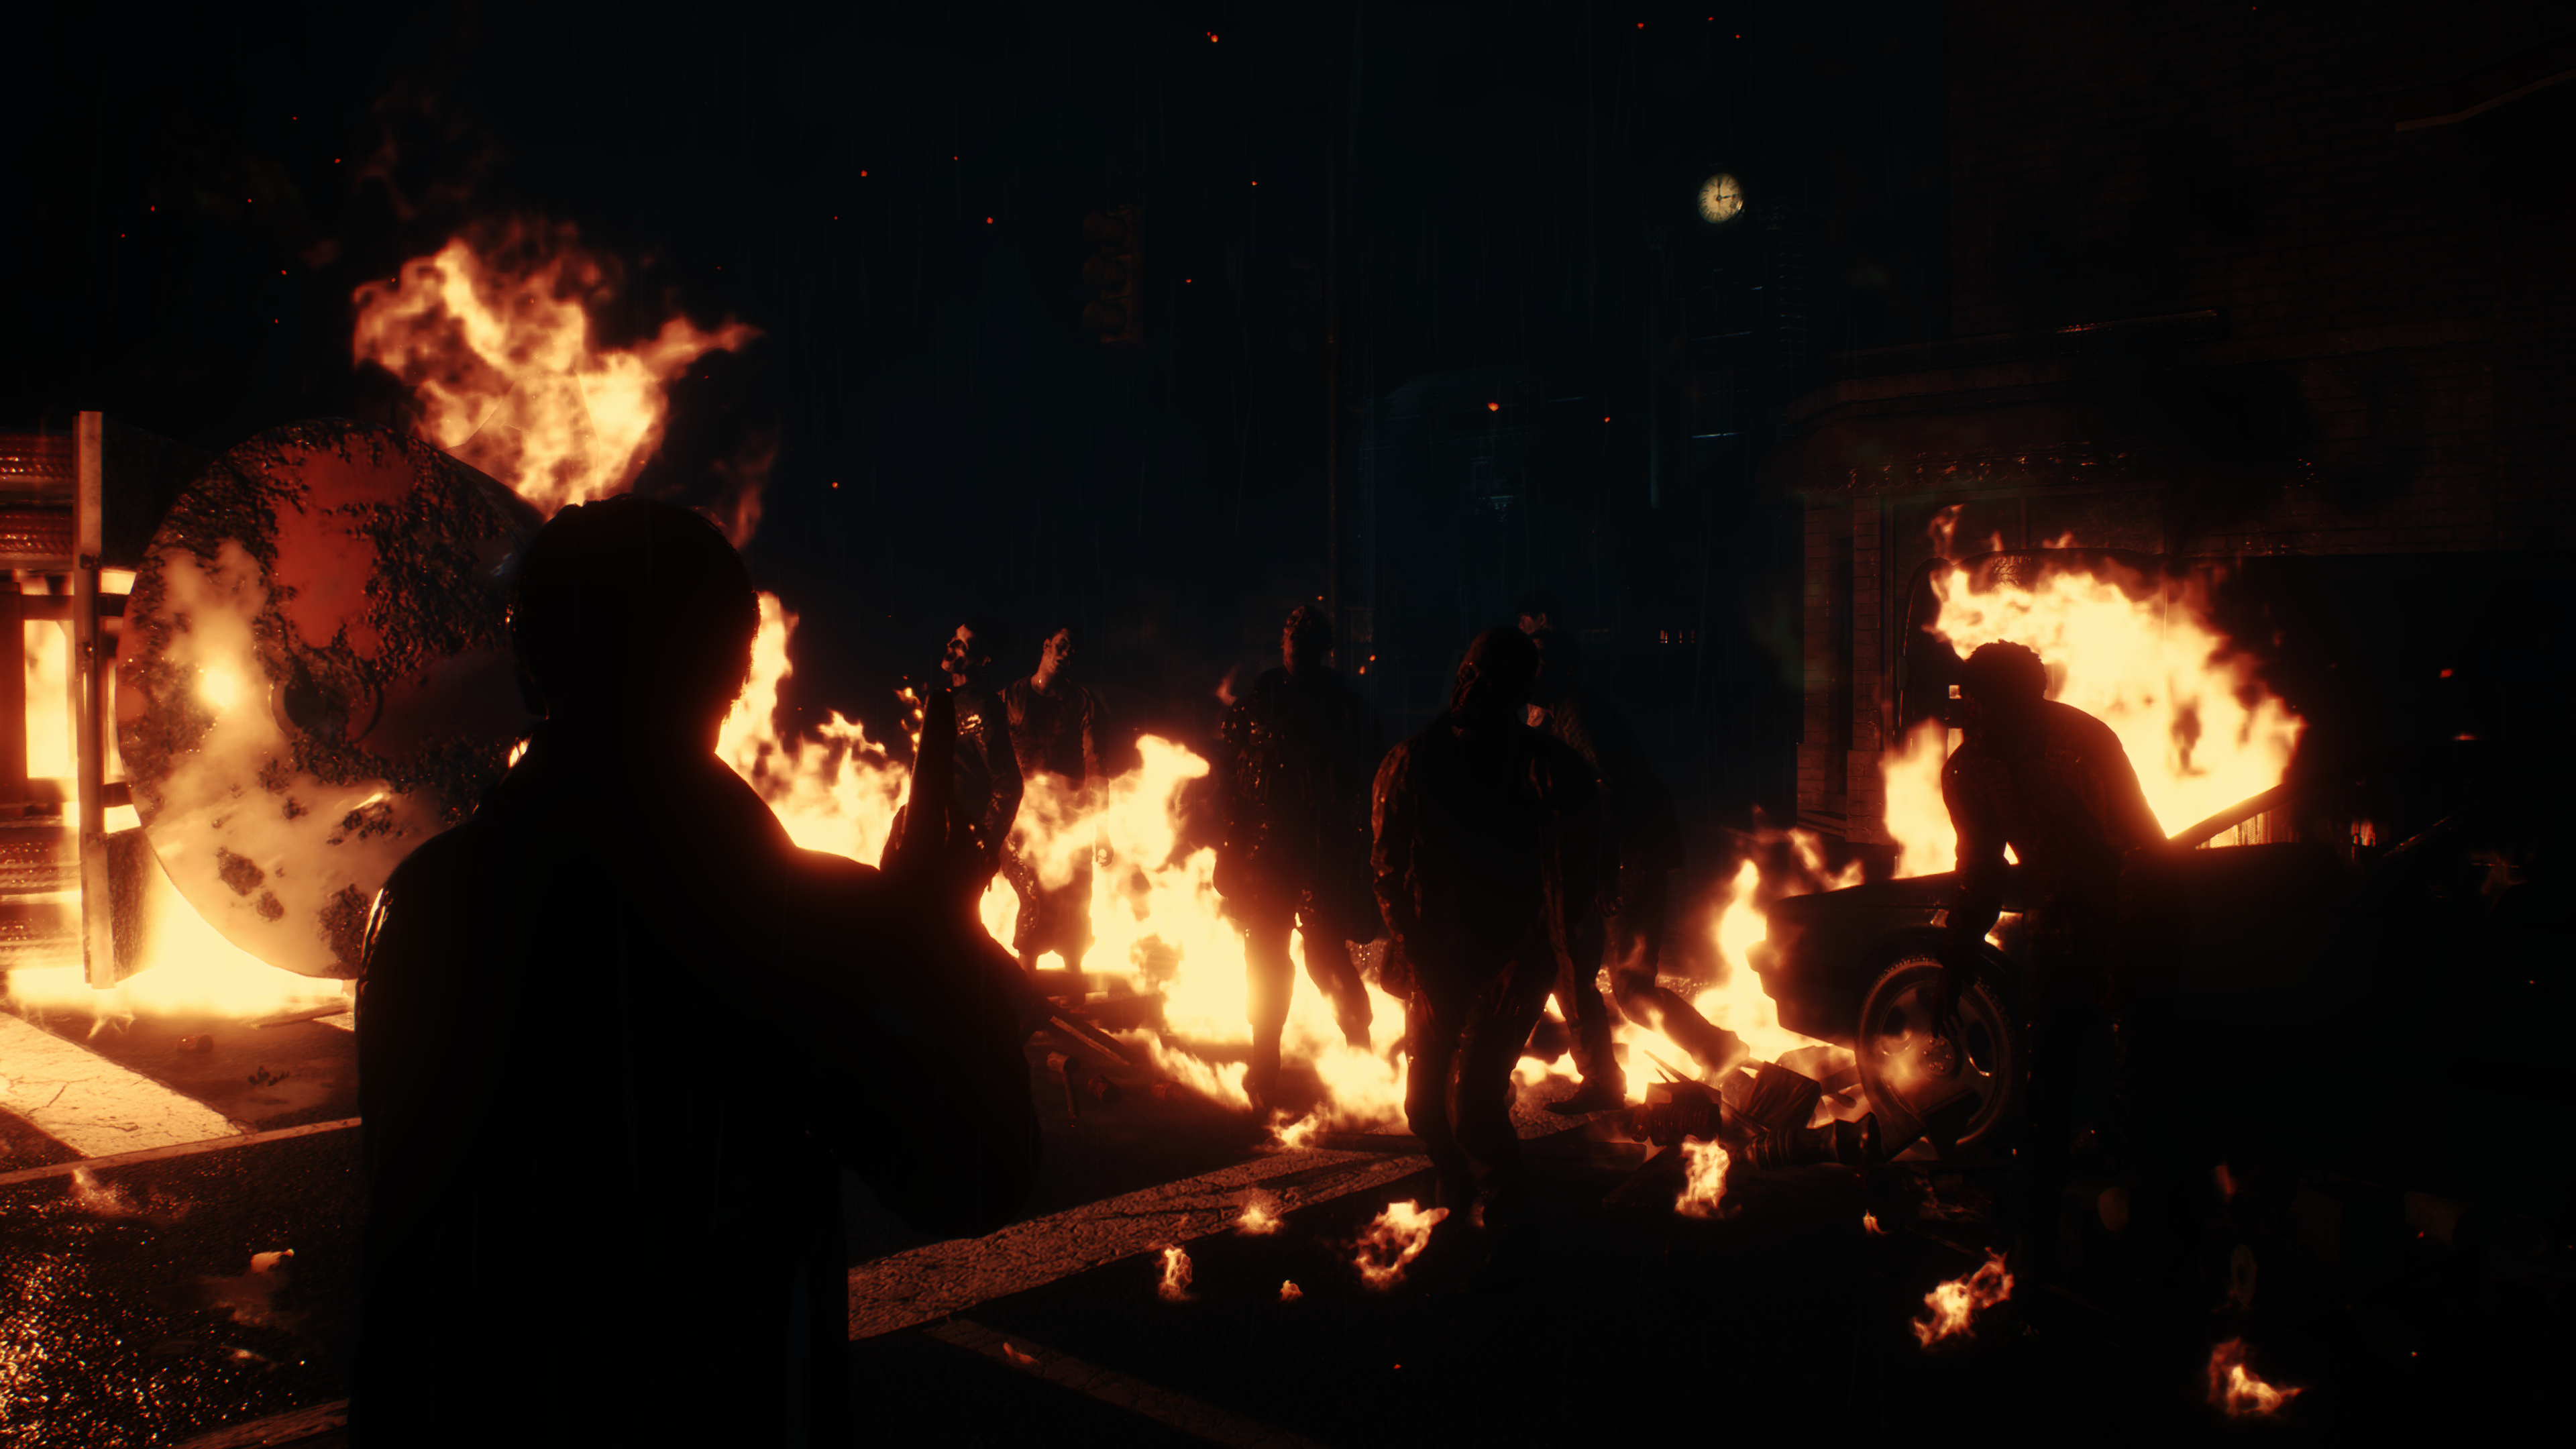

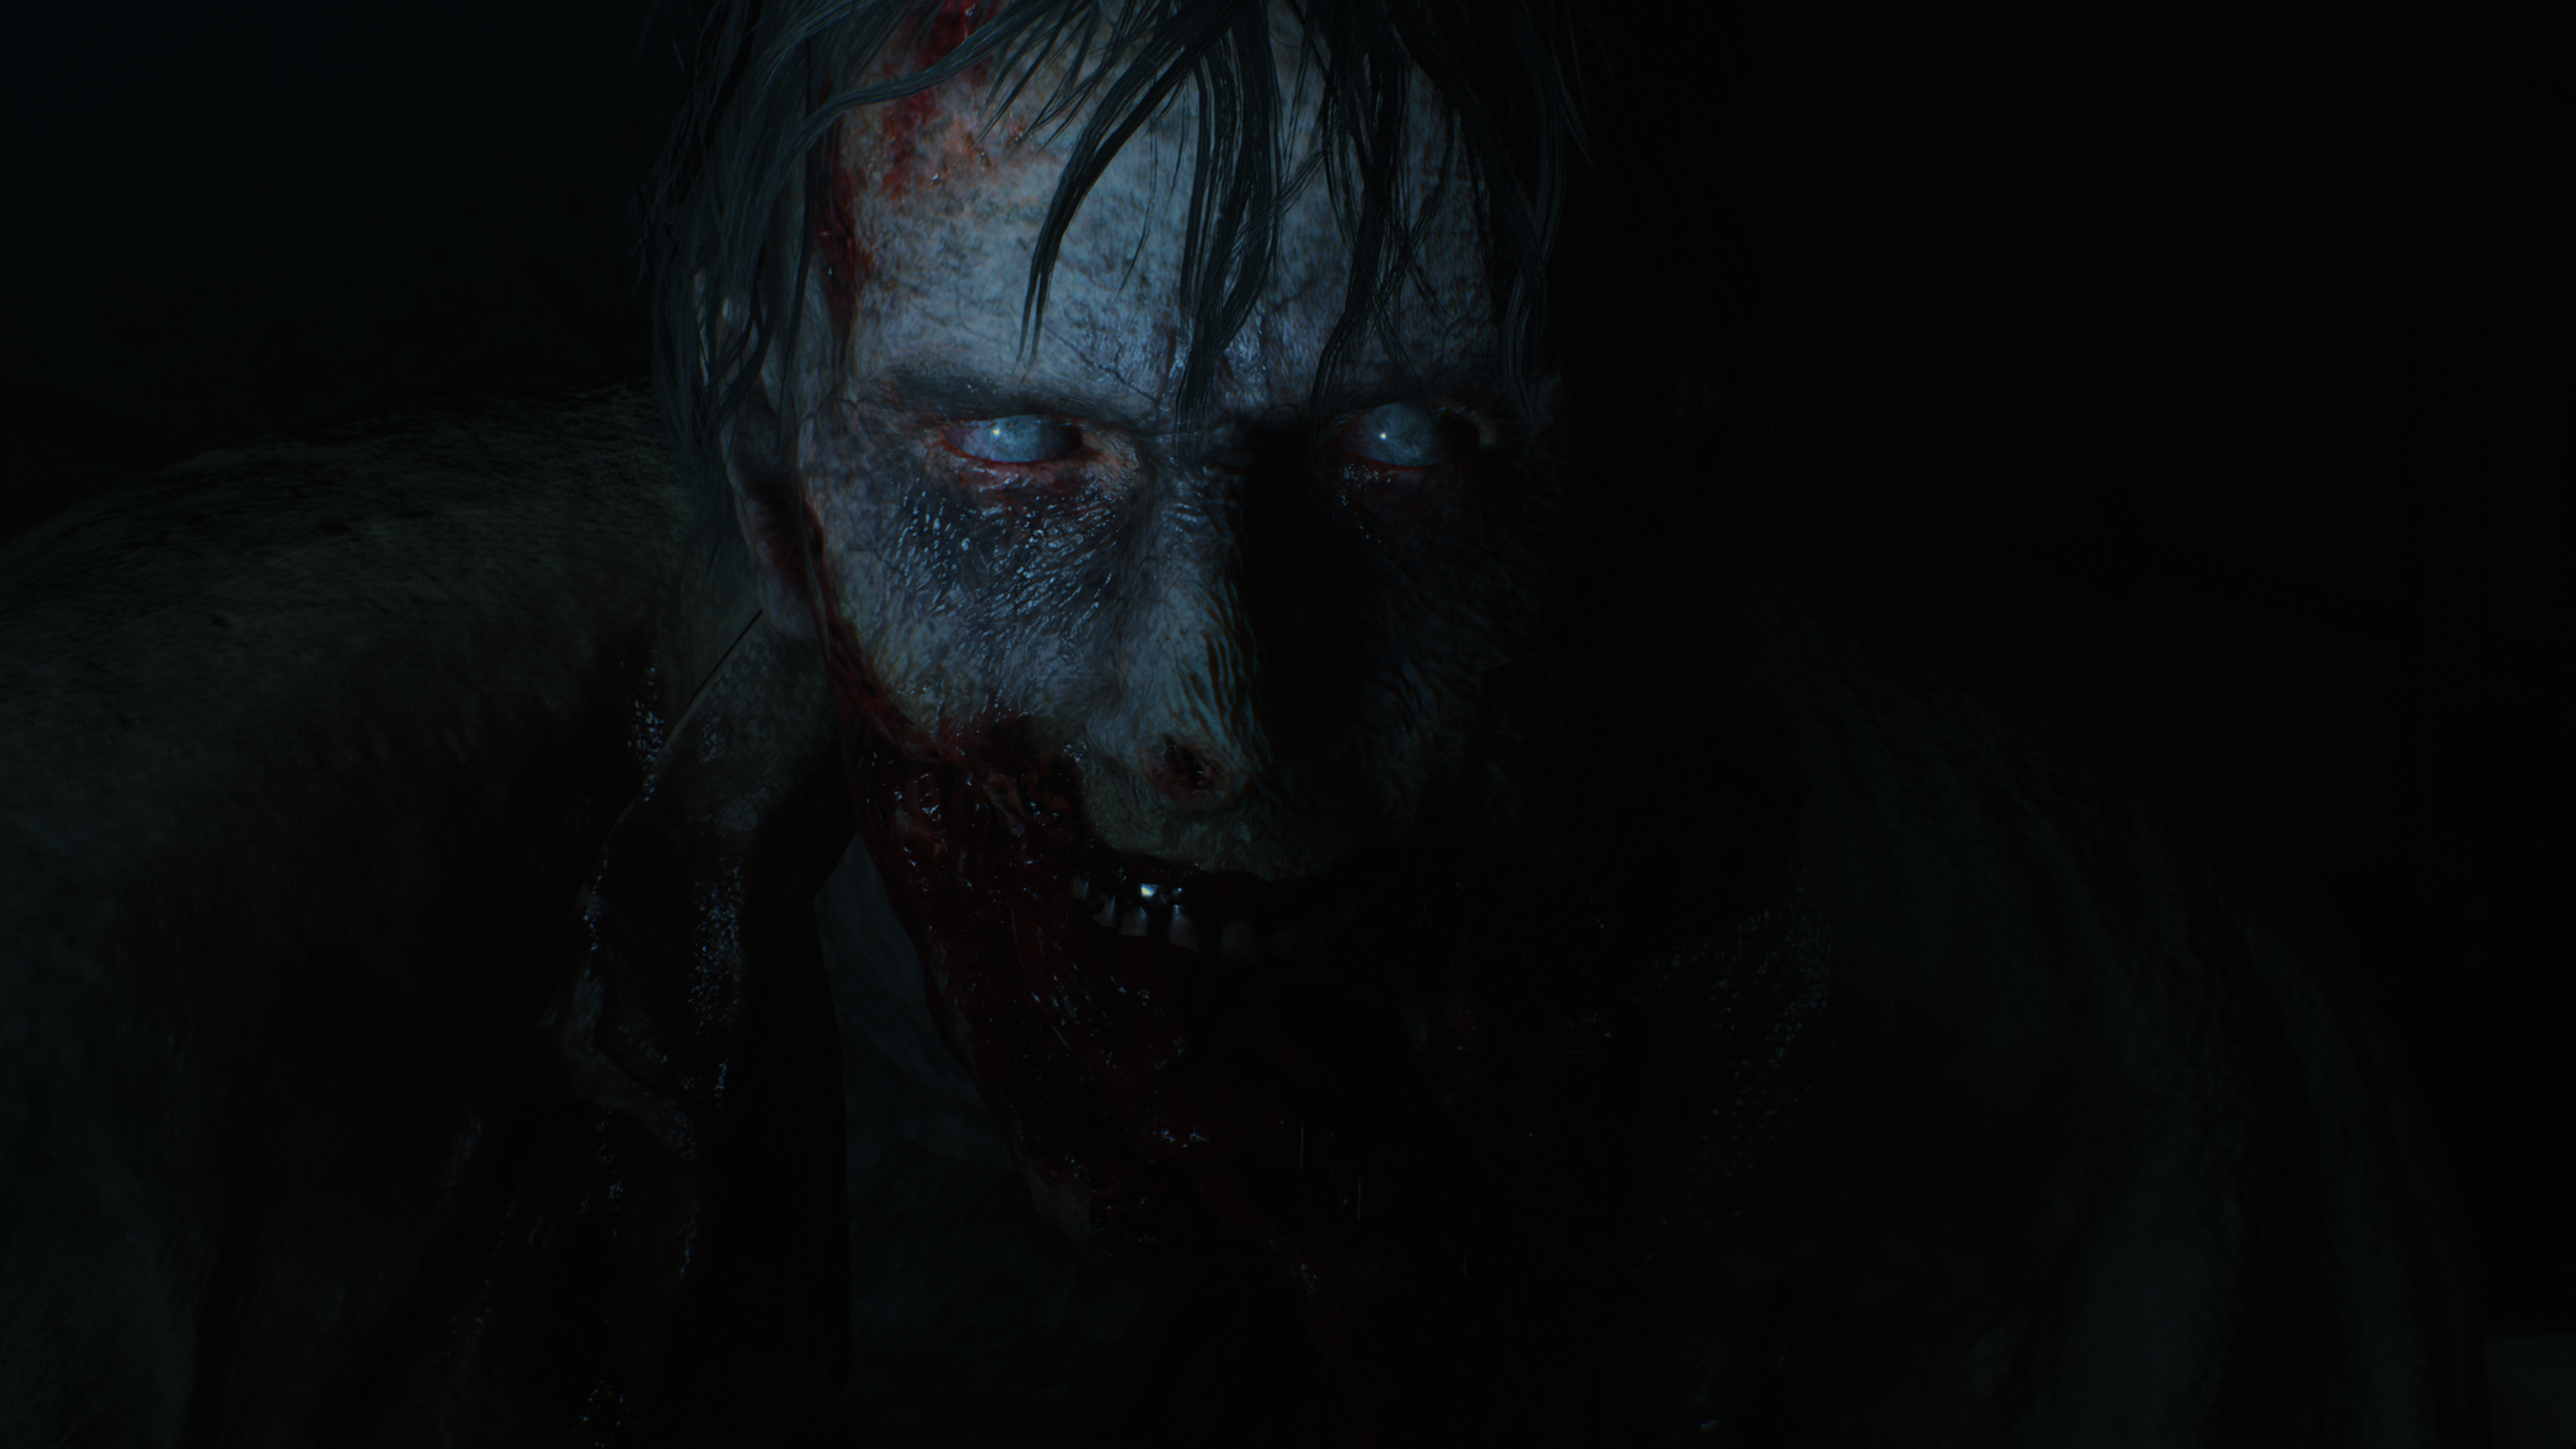

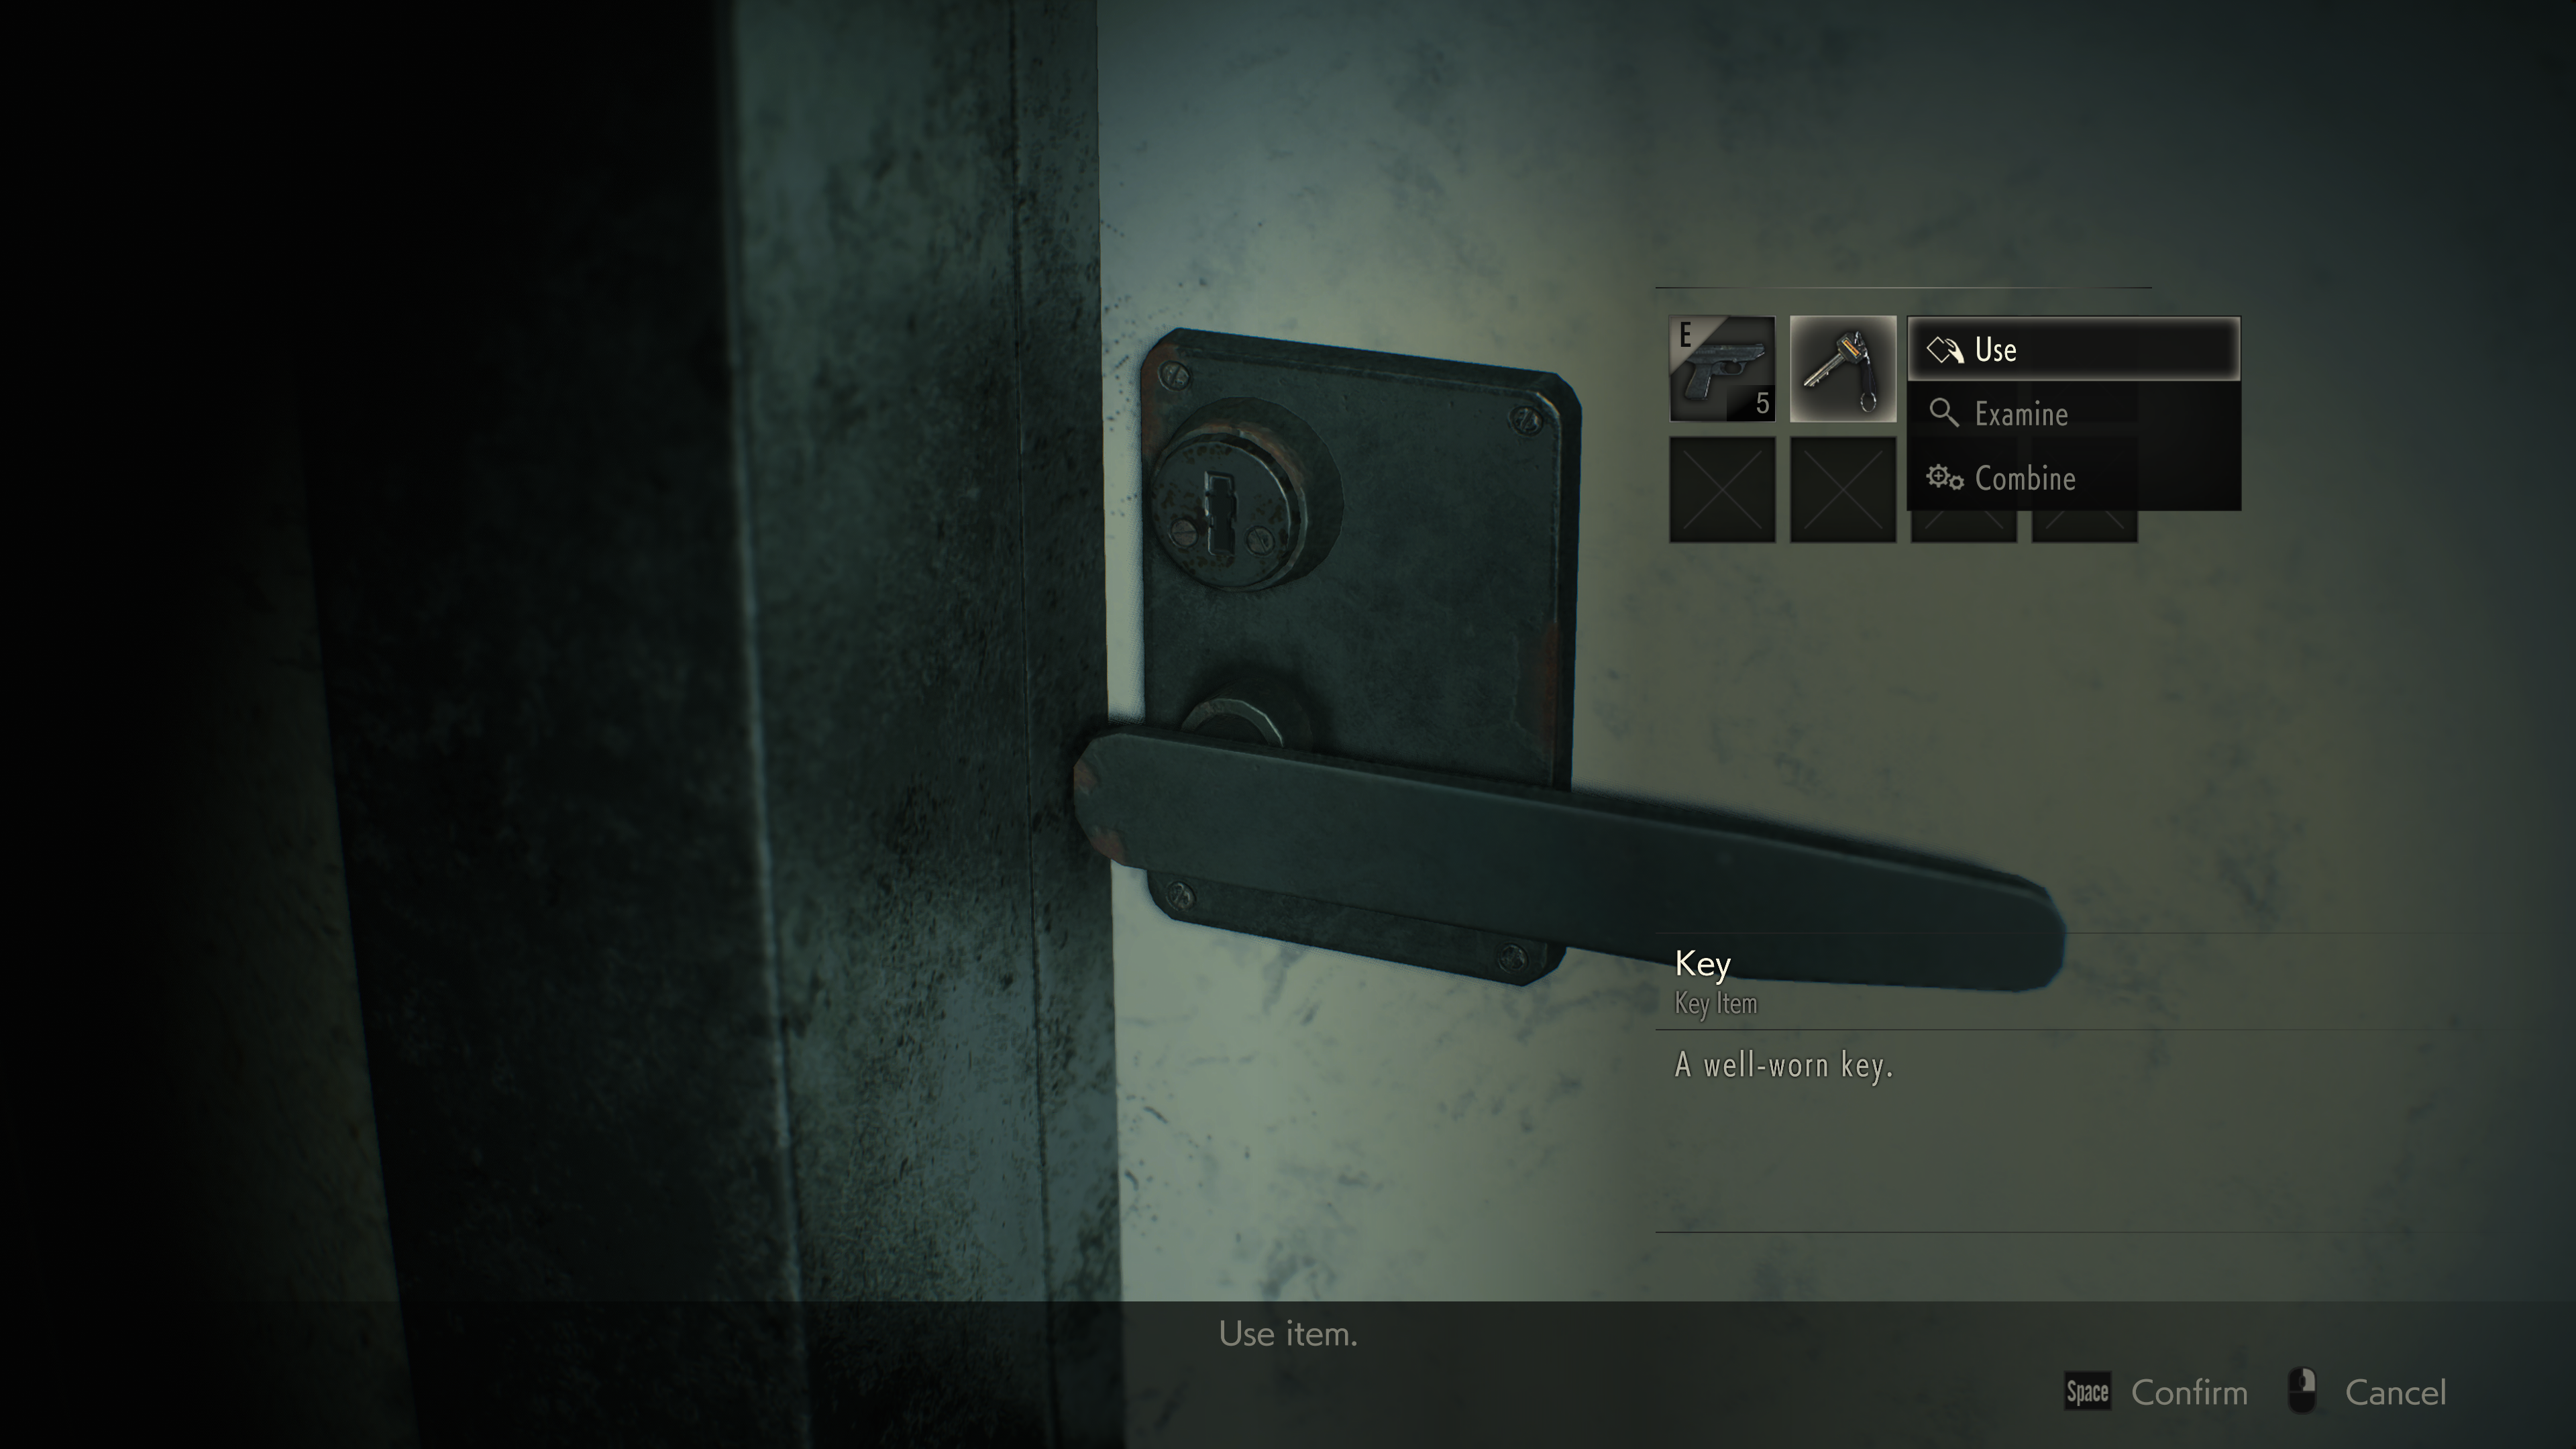
Below is the cmd buffer params passed to the fragment shader, if you want to have a look.
Output Color Adjustment
struct OutputColorAdjustment
{
	float fGamma;
	float fLowerLimit;
	float fUpperLimit;
	float fConvertToLimit;
	float4 fConfigDrawRect;
	float2 fConfigDrawRectSize;
	uint uConfigMode;
	float fConfigImageIntensity;
	float fConfigImageAlphaScale;
}
Present
Final image presented in R8G8B8A8_UNORM in the final upscaled resolution of 3840*2160
Dithering
Dithering is used frequently for hair and translucency (may be other things here & there). The good thing about it, that Anti-Aliasing is doing a great job in hiding most of those dithering and you barley able to notice that in a final frame (despite the fact of being used a lot).

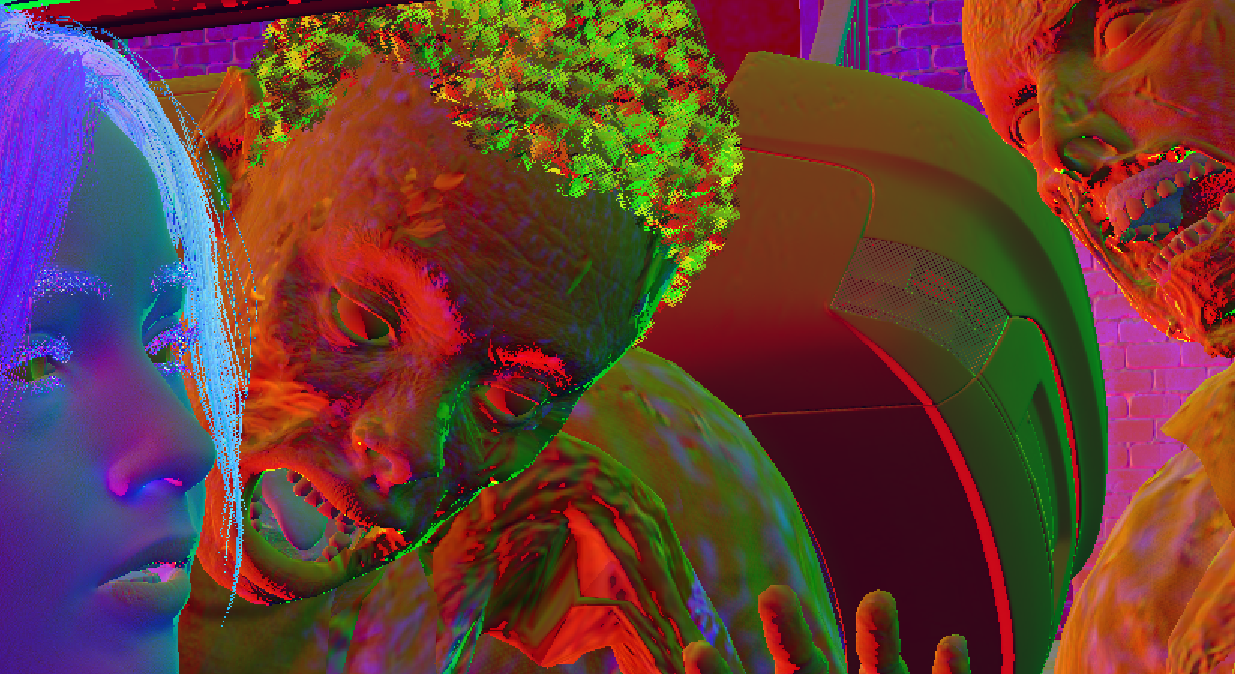

RTX ON
Sadly this section have to be skipped, as enabling Raytracing would crash the game even before it initialize, as long as i’ve any working tools running in the background, which prevents me from fetching any useful data from the game[s].
Interlaced Rendering
When enabled through settings, Pretty much everything and every rendertarget you’re familiar with so far, will be rendered in 1/2 the width. So render target will look like something like that
Not only that, but also RE will add one more compute pass just right before the motion blur. That compute shader will take current frame’s and previous frame’s HDR, Velocity & Depth, and will result on a new checkerboarded HDR.


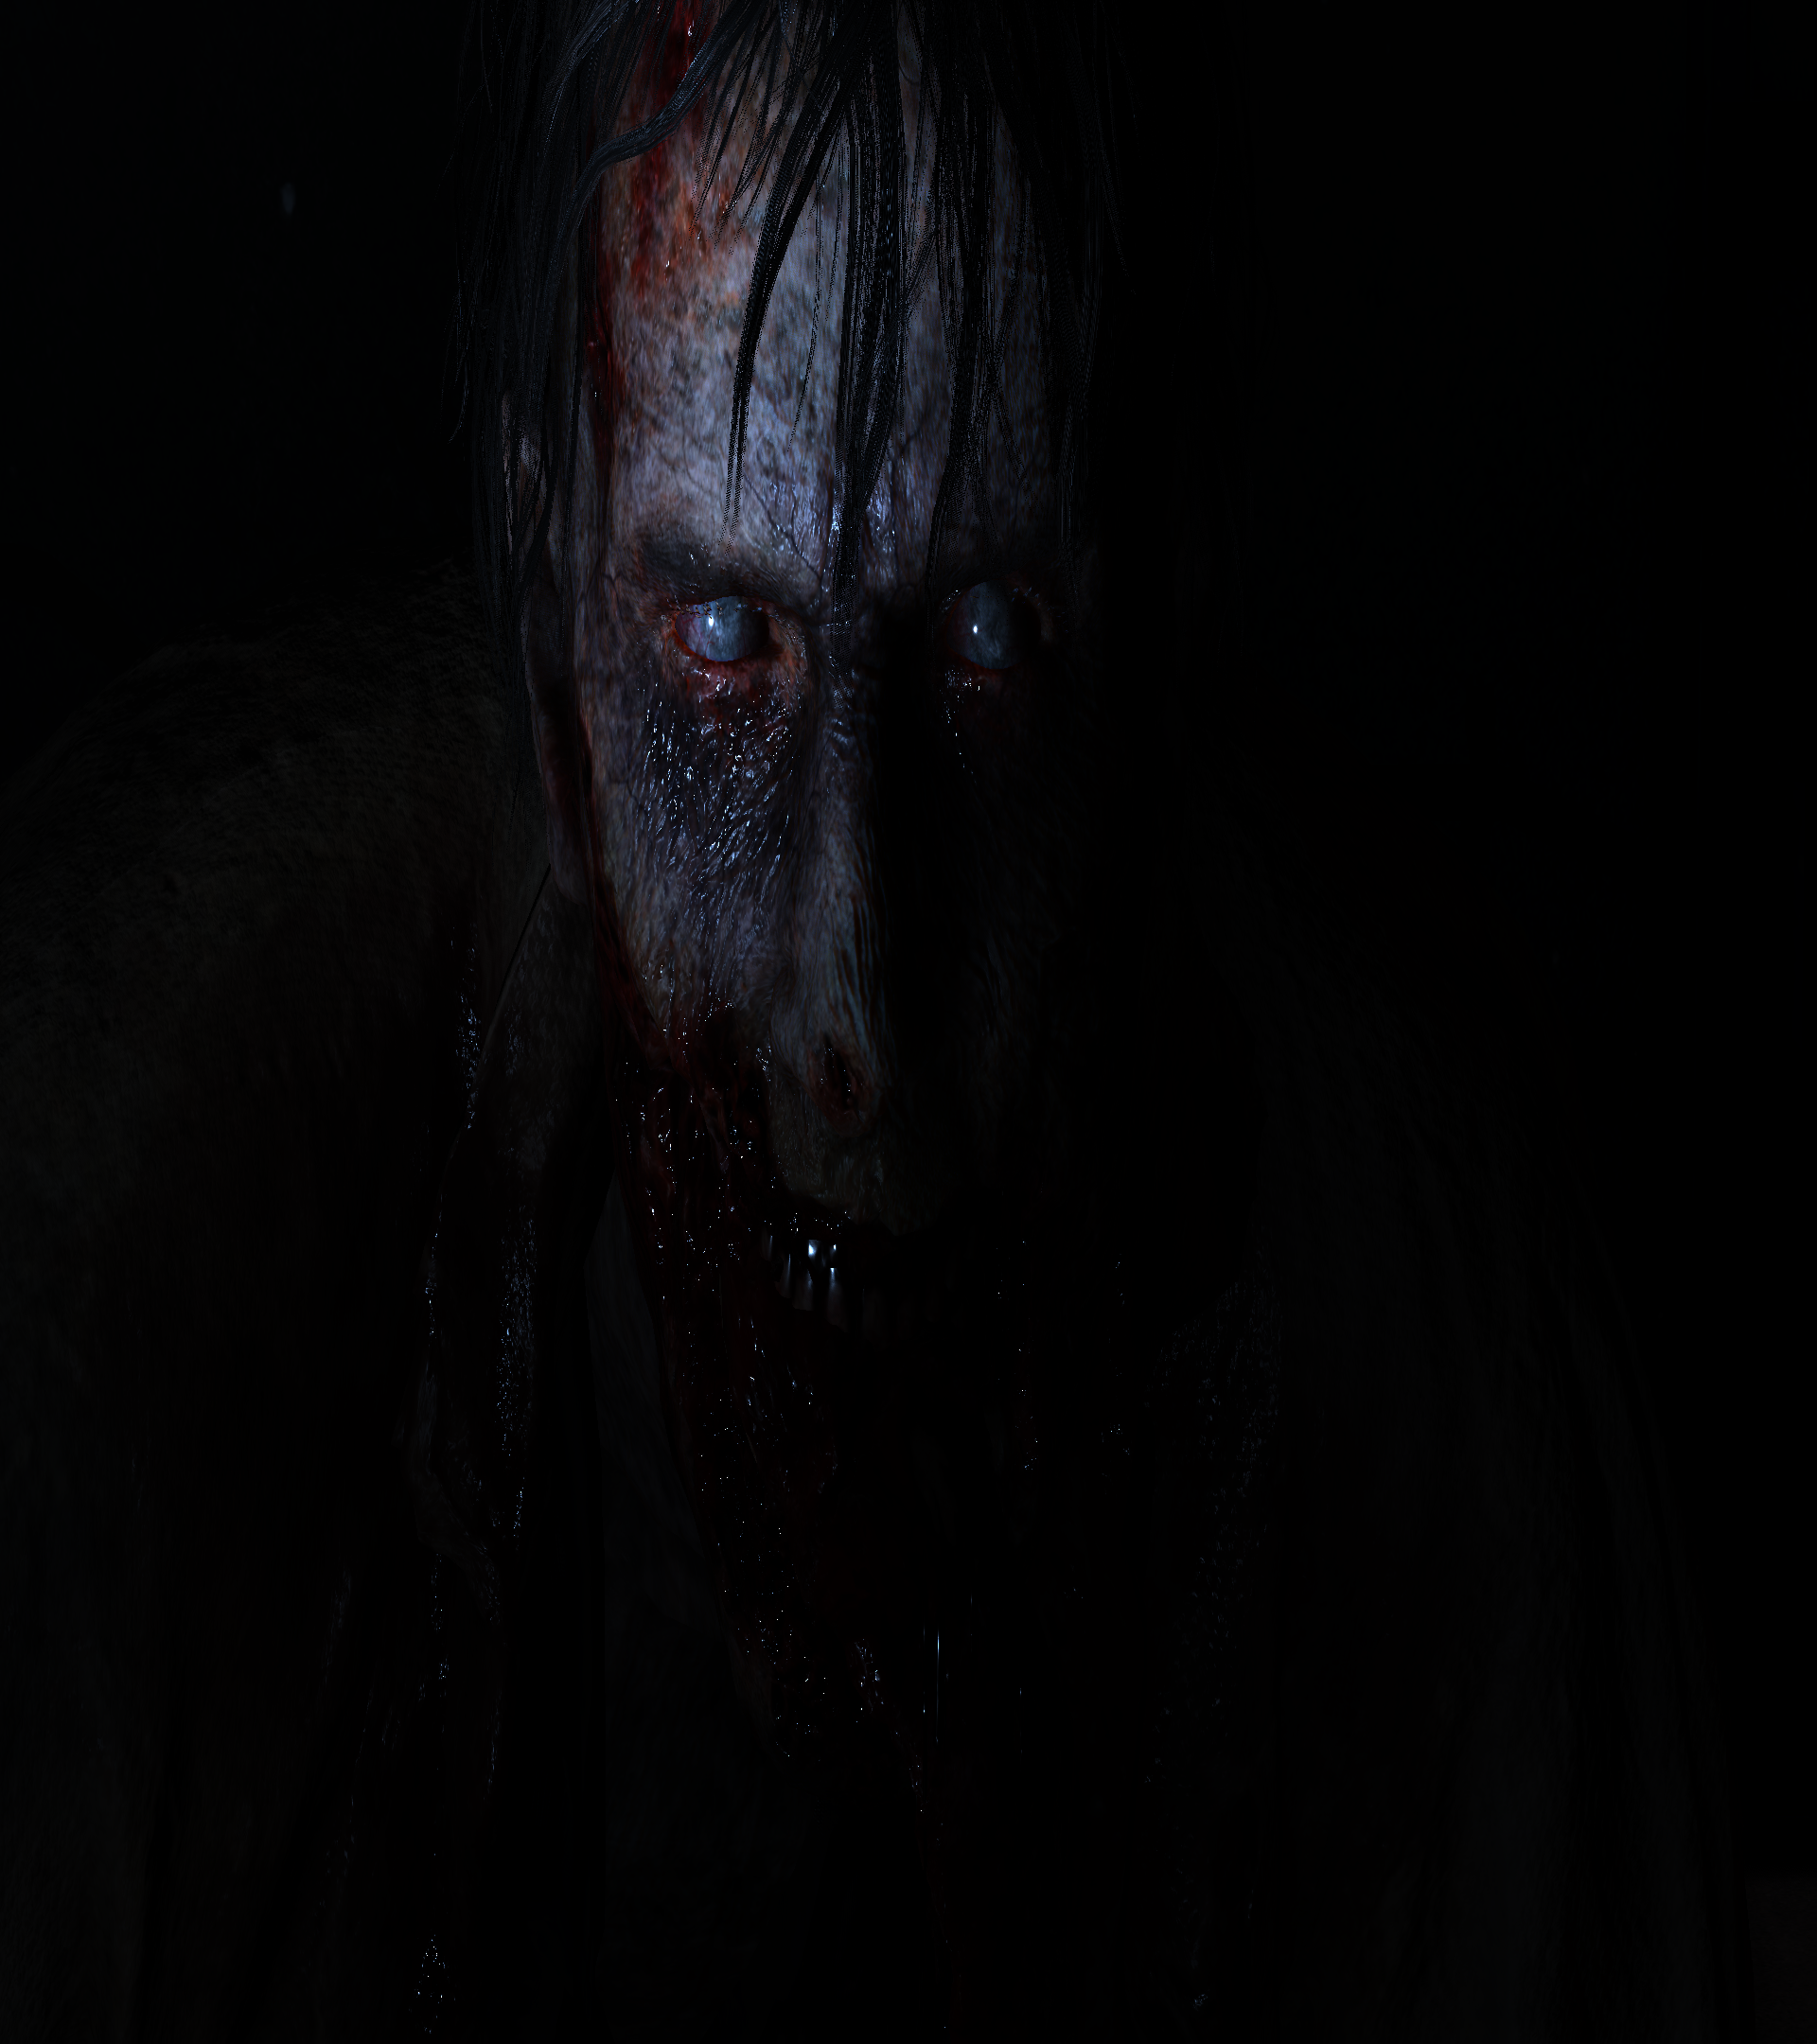


For that purpose, the shader will be need that simple buffer.
Deinterlace
struct Deinterlace
{
	uint isCurrentEvenFrame;
	uint isCurrentFrameCount;
	uint isCurrentFrameCount2;
}
Engine General Observations
There are those other random few things that you don’t see in common frame during the game but they’re things that interest me enough to dig further behind the common frames in order to get more info. Those things below are either that needs a specific occasion or can be found in some specific screens.
Overall Utilization & “pwynO”
As you might have noticed, several times we find rendertargets are used to their maximum. Not only using well carefully chosen texture formats, but also trying as much as possible to use the available channels wisely by packing multiple things to not leave a single empty channel with a solid color.
Of course the HUGE amount of compute dispatches comparing to other games, is priceless!
Another great thing about RE Engine based games, is the way passes are ordered, in a brilliant way, let’s say we need to downscale the HDR scene to use with DOF, but we also need it to be downscaled to be used with Bloom for example, let’s fold both together in a packed R11G11B10_FlOAT format. This might sound “common” or “usual” for some people, but believe me, many engines not doing it that way.
And what really amazes me here is the teamwork and the tech-direction/lead of the engine, because it is very clear that the Soft Bloom and the DOF been implemented by two different programmers, but they hand rendertargets & other data to each other like the finest players in Liverpool. You can tell it’s two different programmers from their structs & members naming convention! But despite the difference in naming ideologies, they were able to communicate their work, and glue it together smoothly and nicely for the good of the engine. Oh boy this is touching deep! i once had an entire day wasted trying to fix a bug that is not exist, eventually figured out that somebody changed the console platform SDK target version int the code without telling anyone else, and that was causing the linker & compiler to vomit all sorts of issues due to being in a behind SDK! Bad communications among a the entire game team can be unhealthy & bad, where bad communications among the programming team of the game can be deadly and results in a broken or unstable game!!
And of course, the big elephant in the room, is the mindset of “Process What You Need ONLY” or let’s say PWYNO (game industry loves weird words. If someone made WYSIWYG, i guess i’ve the rights to make PWYNO). If no DOF needed now, then it has no existence in the frame rendering graph, if you don’t need lens flares around, then let’s skip that entirely from the rendering graph. Oh, nothing reflective around, let’s not do full SSR rays shooting for nothing….and so on. This is a common pattern i’ve observed (at majority of the areas), and i love seeing it (i also done that in Mirage too 🤫🤐).
Perhaps the type of games (aka linear) and the mode of the games (dark) that was built using RE Engine is what makes it standing out and can get away with many tricks and optimizations. i may change my mind about that in the future, but yet i do believe that…the only reason to change my mind, if i found something else in a game such as Monster Hunter Rise (which is not linear, and not dark!) which is the far opposite of all what RE2,3,Village is all about!
Surface
If you know me, you know that i love it when the final surface is just a massive triangle that is bigger than the fullscreen/viewport size, and i’m not a big fan of the two quads method. So, good thing that made me love RE Engine more, that it presents in the way i like, and use that big tri method for all the full screen passes.
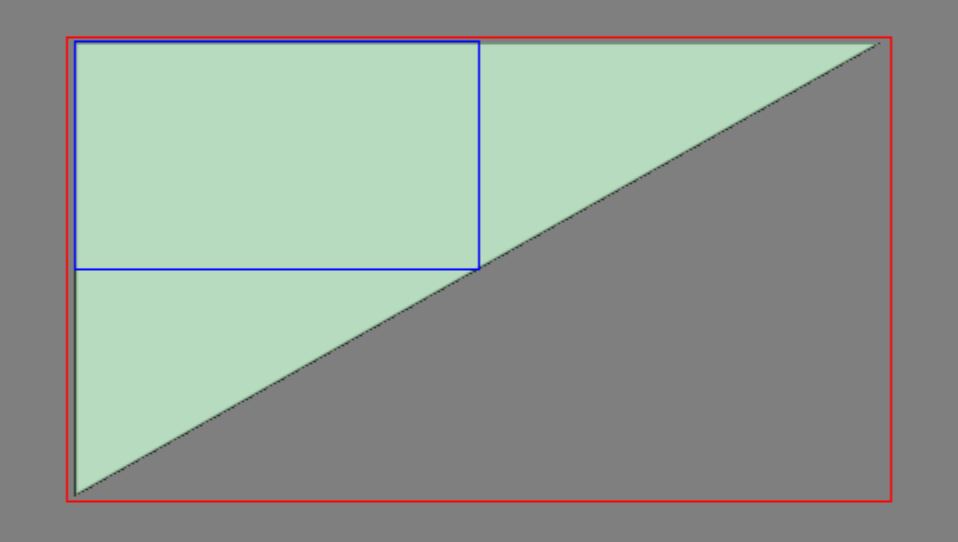
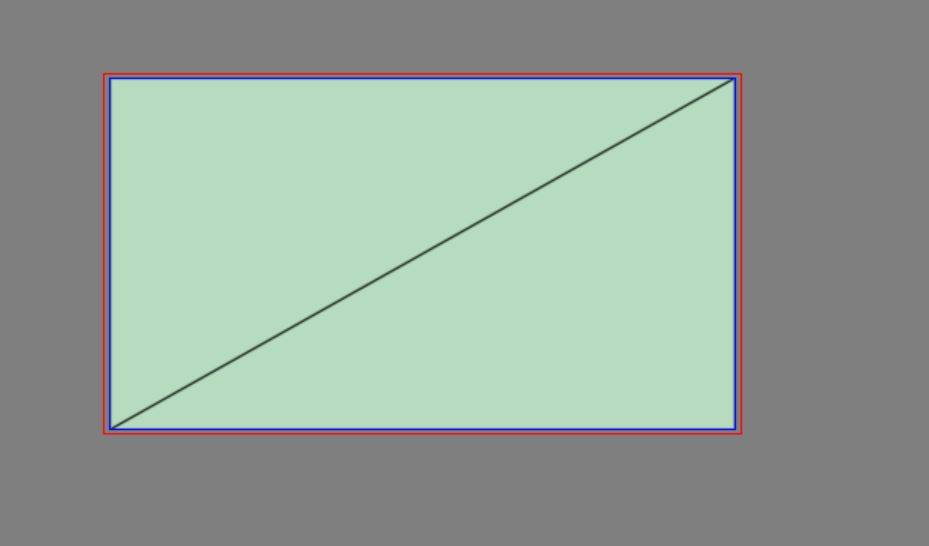
Those images are from Chris Wallis’s article discussing the topic in detail, you can check it out in the (Related Readings & Videos) section
Of course we can debate & pillow fight about which direction the triangle face ^_^, but it doesn’t matter, what matters that it is a single tri!
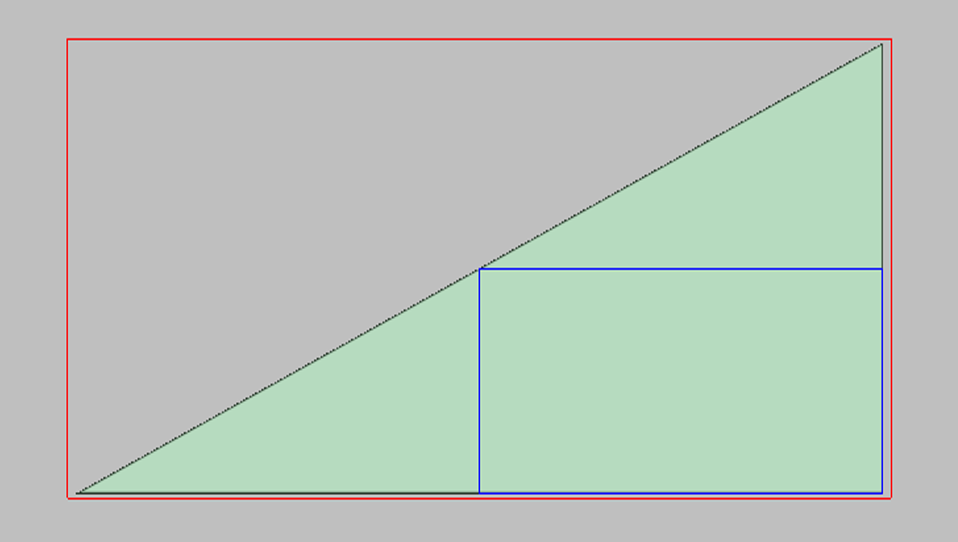
Menu Animations
The game’s (RE2) menu is very catchy, not only with it’s dark horror mode and amazing rain & thunder (all that is common 3d rendering similar to the rest of the game frames), but also the RE2 logo and it’s animation gives a good vibe when you launch the game, specially for the first time. When you see such (UI + Text + Animation) combination, you start making assumptions, from what i’ve seen earlier in other games, such an animation is usually achieved by a flipbook sprites. So if that logo shattering animation takes 2 seconds, you would end up with a good couple of atlases full of animation frames for that…But that is not the case in RE2!
RE2 is using only two frames of that animation, a frame with the logo at it’s default state, and another frame for the logo fully fractured. And then doing masking and blending between both over the pre-defined time of the animation.
Regarding the blending between the frames, it is done by drawing some masks, and animating them from the far right of the screen to the far left of the screen, in order to blend between the two frames. The “GUI Mask” is in R8_UNORM format.


Because those are not actual keyframe times, i named them & will refer to them below as A, B, C, D, E, F
If there is no mask, such as the last frame (fully fractured logo), full black, then there is not sprites to draw. But if there is masking, such as the frames in-between, the mask itself usually drawn in 5 steps, regardless how large amount of the logo it’s gonna cover, it will be always 5 draws, let’s take the few frames in the middle as an example (Frames B, C, D, E)


First step always empty, then try to fill the gab between the target position (at left) and the end of the logo (at right) with maximum of 4 sprites, and finally (last draw) is to add rect to fill from the end of the logo to the target area to cover.
And despite the fact that i do like that idea. And i see it smart because it saved the engine from having needless textures loaded in memory that is full of the animation frames (could be 2 or more atlases to include only 2 seconds of animation). BUT, and there is a huge BUT here, the masking is not only happening on the size of the text, but it is in fact a full screen mask (4k at this case!)


The other (less important) takeaway from the main menu animation, is that i found the logo frames were made two times, at one the game was referred to as “RESIDENT EVIL 2” and at the other the game was referred to as “BIOHAZARD RE:2“,…it’s cool to see those “hidden” marketing decision that are possibly removed very very late,…late enough to not even remove them from the game!
Even the “RESIDENT EVIL 2” version, have it’s own two versions 😅 one with ™ and another with ®…
If you look close, you can find at the A channel’s lower right corner the pattern used to paint the mask for the animation
And of course, as you might’ve noticed, there is some versions of the game logo that appears only in the A channel, those are used to draw an earlier version of the logo behind the logo itself, so it works like a shadow or better term from photoshop “drop shadow”. So you can think about the logo drawing order as follow
Startup
Intro Movies
The movies at the start of the game (after the first few minutes of gameplay) is obviously pre-rendered, not only because of the very high quality bar, but also because of the editing techniques the might not be that common in runtime cinematics. And this is okay, acceptable, and we got used for it.

BUT, what is not okay is to have a full deferred and post processed (with compute and everything) game frame[s] in the background before painting the movie in the UI. Of course it is common to have assets and meshes loaded (world) in the background for a quick play, but you can either skip rendering the world, or if it is a must, then you can render the world in a low cost, but not full and entire deferred clustered render graph, just to make sure they’re in memory and ready after finishing/skipping the movie.
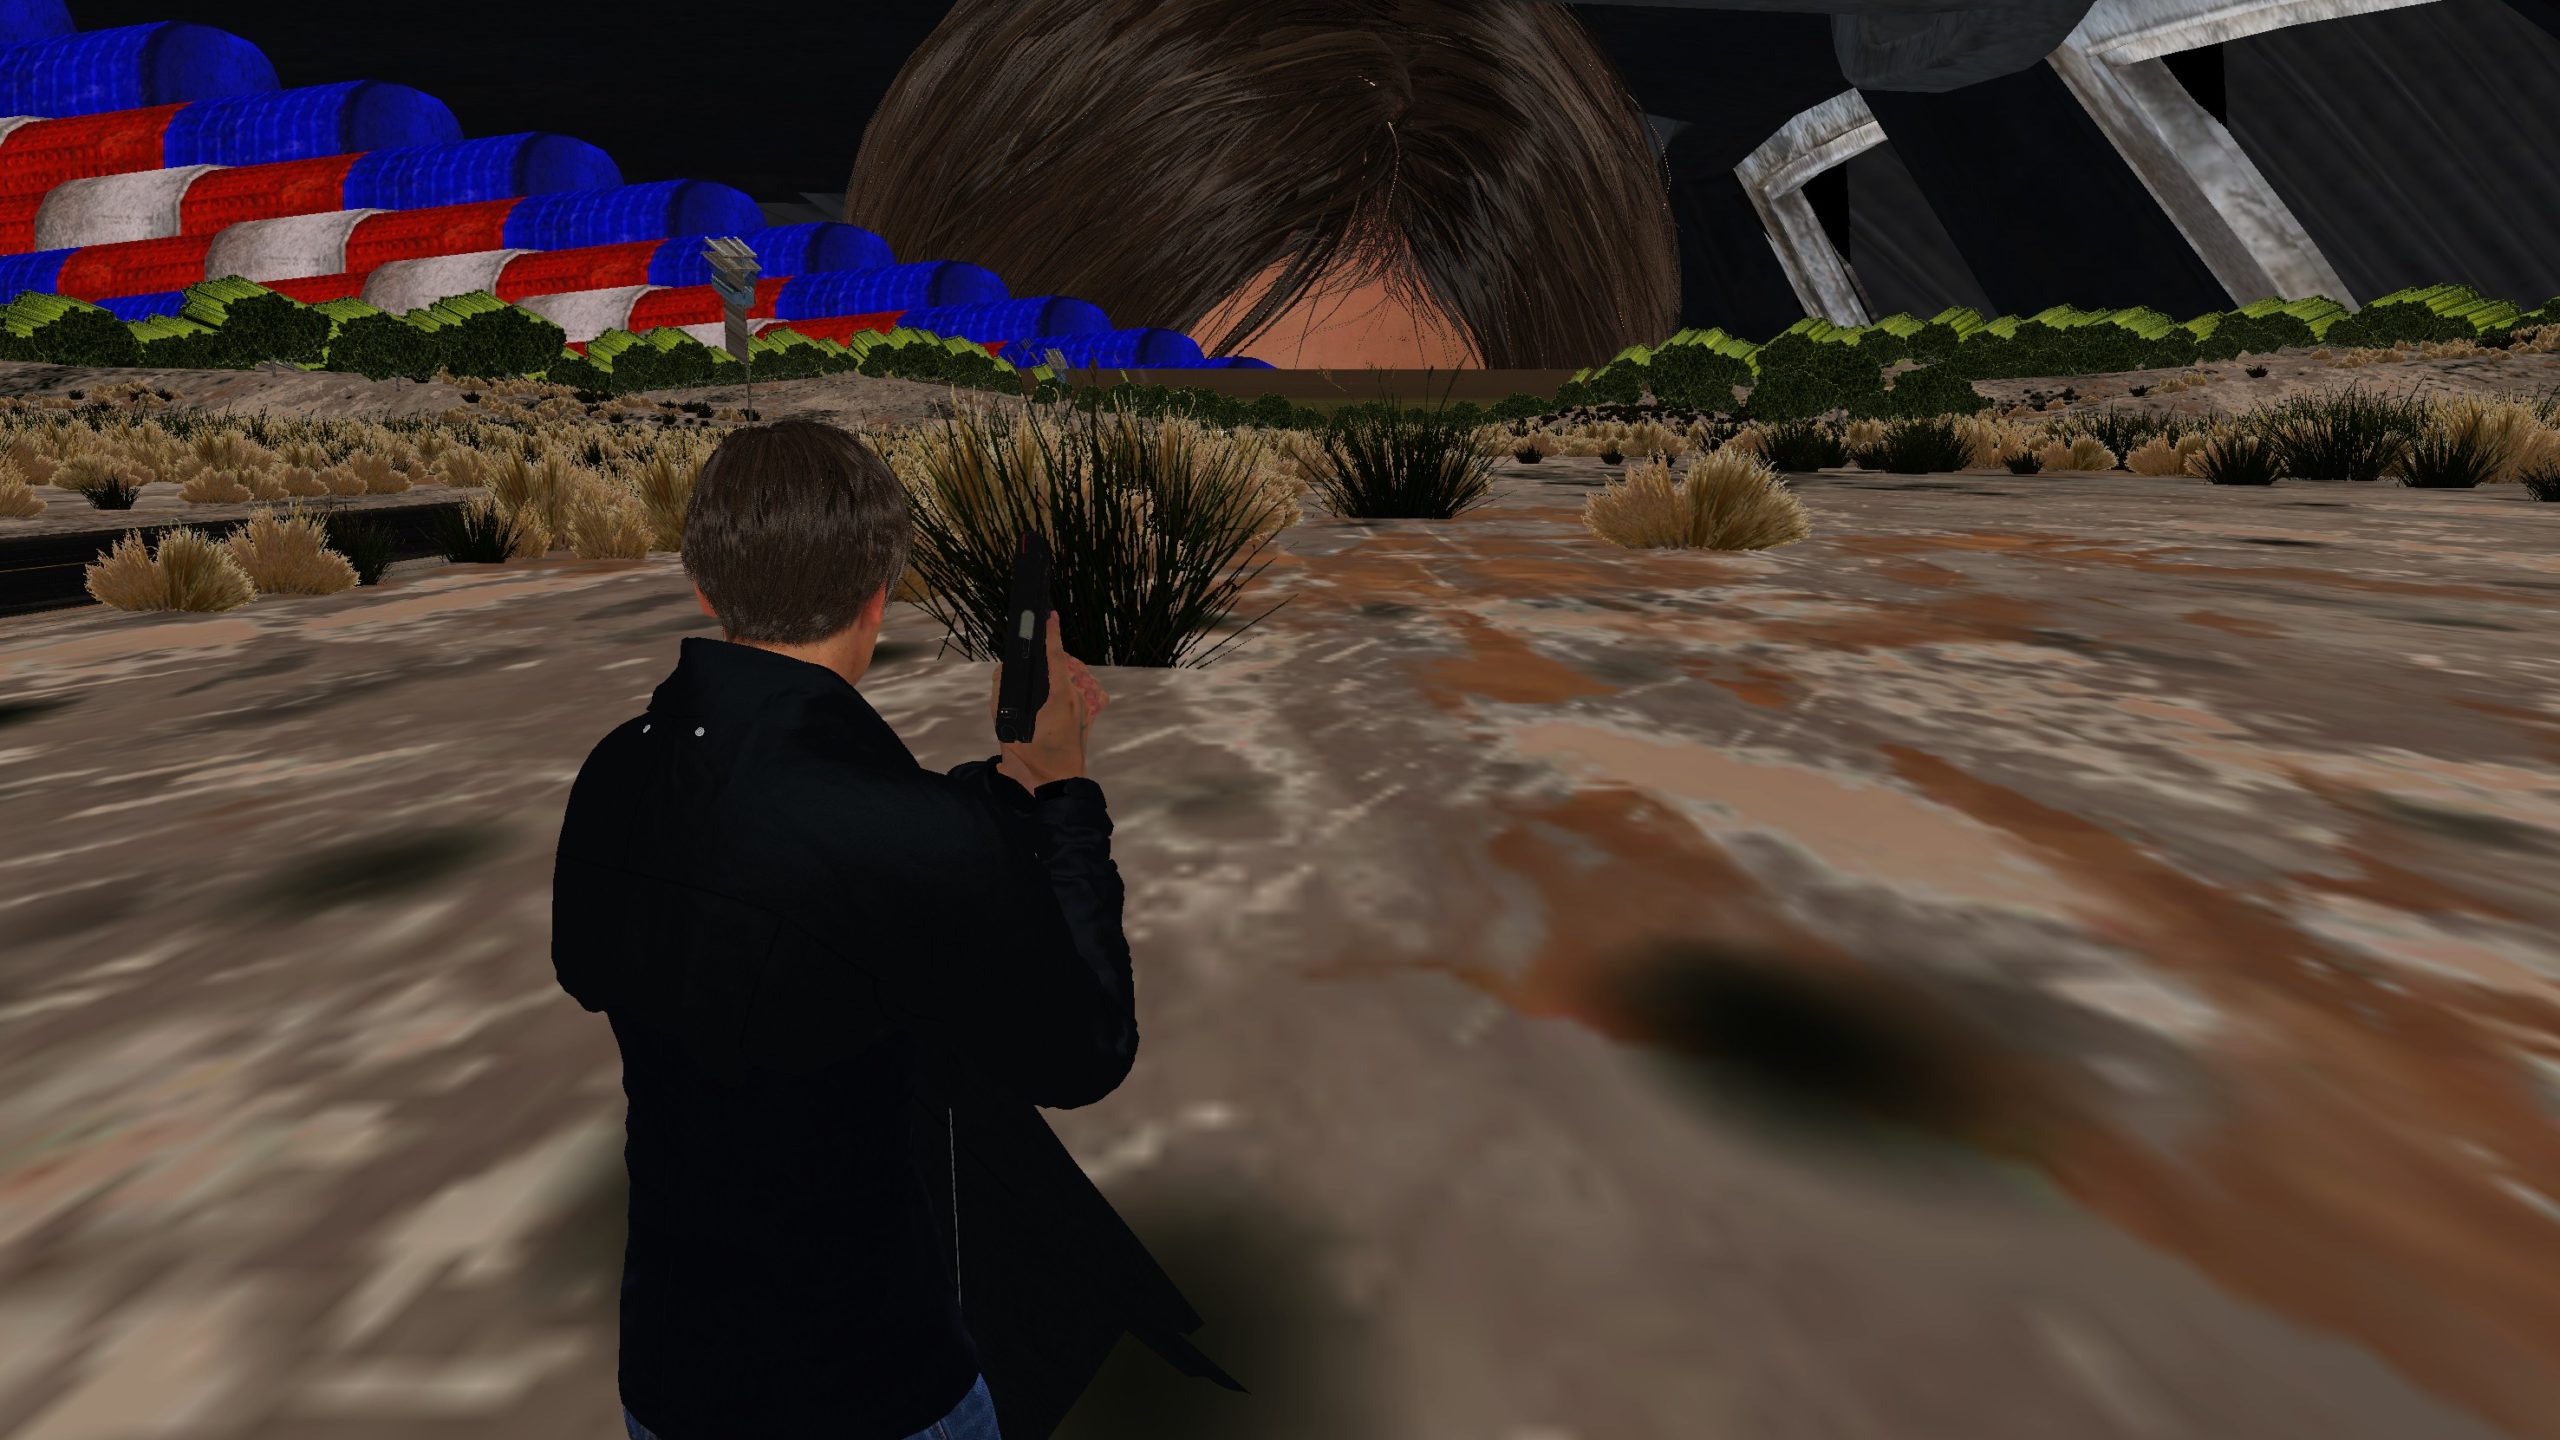
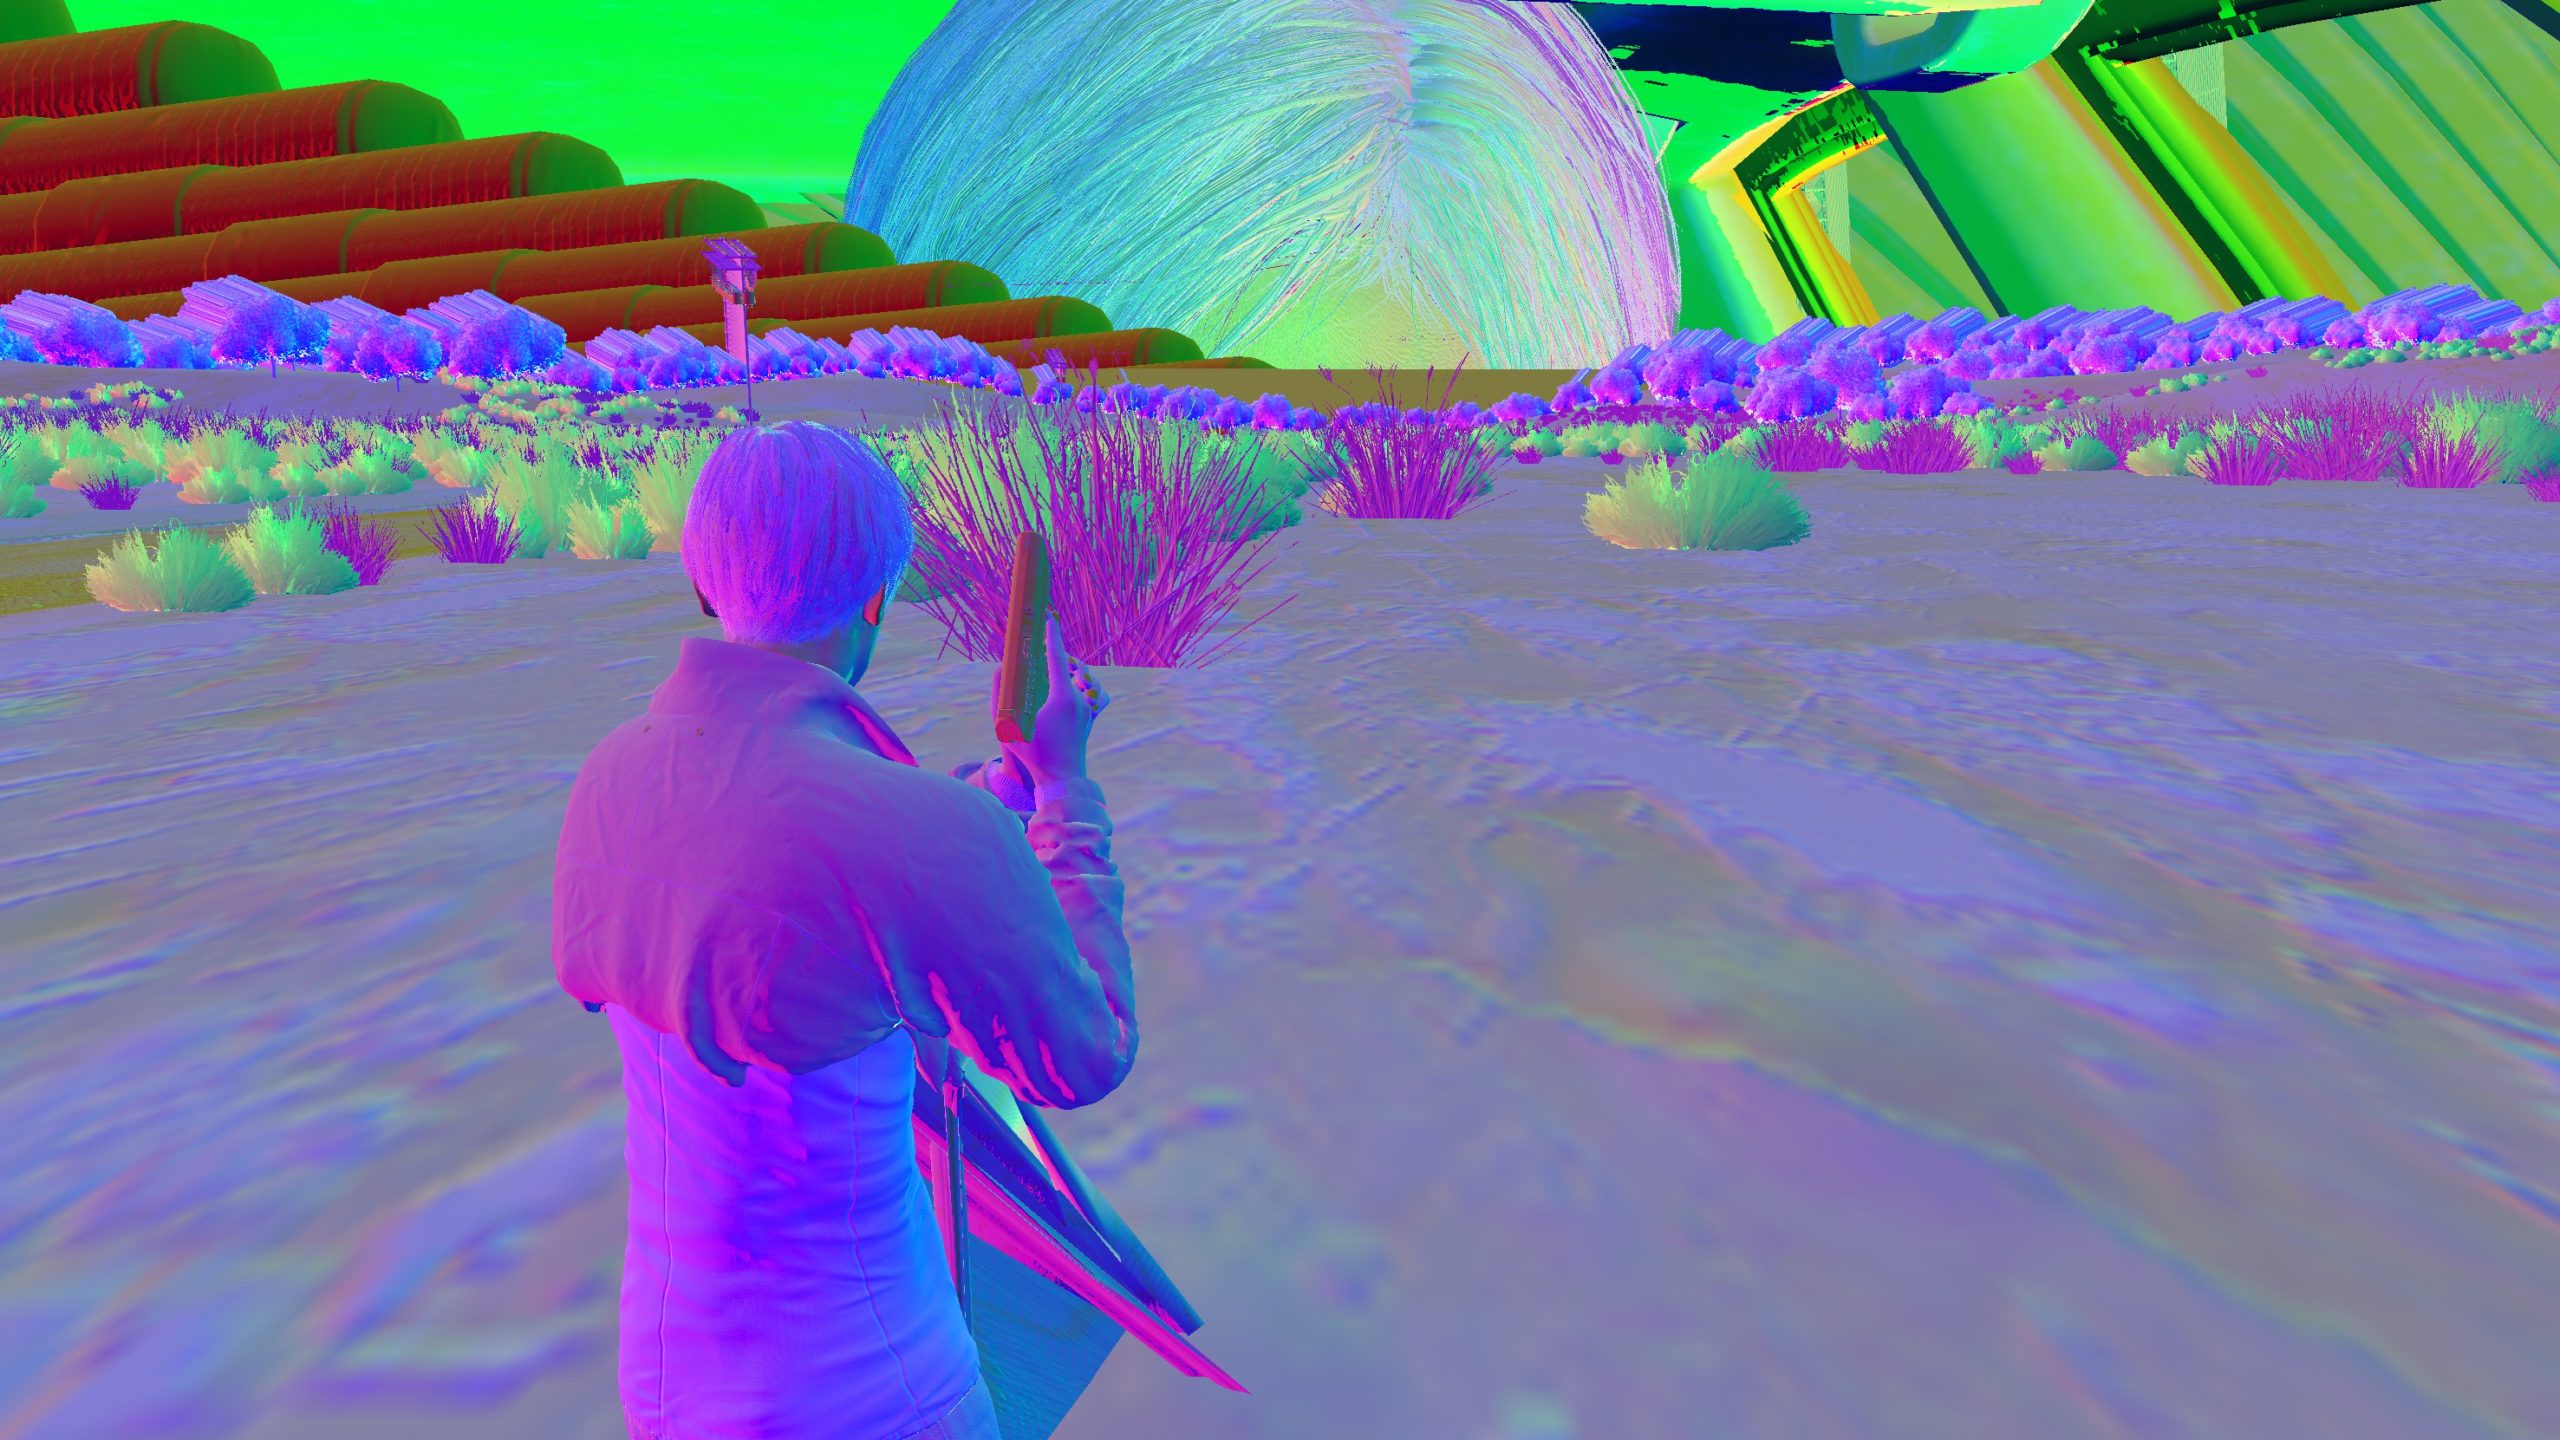
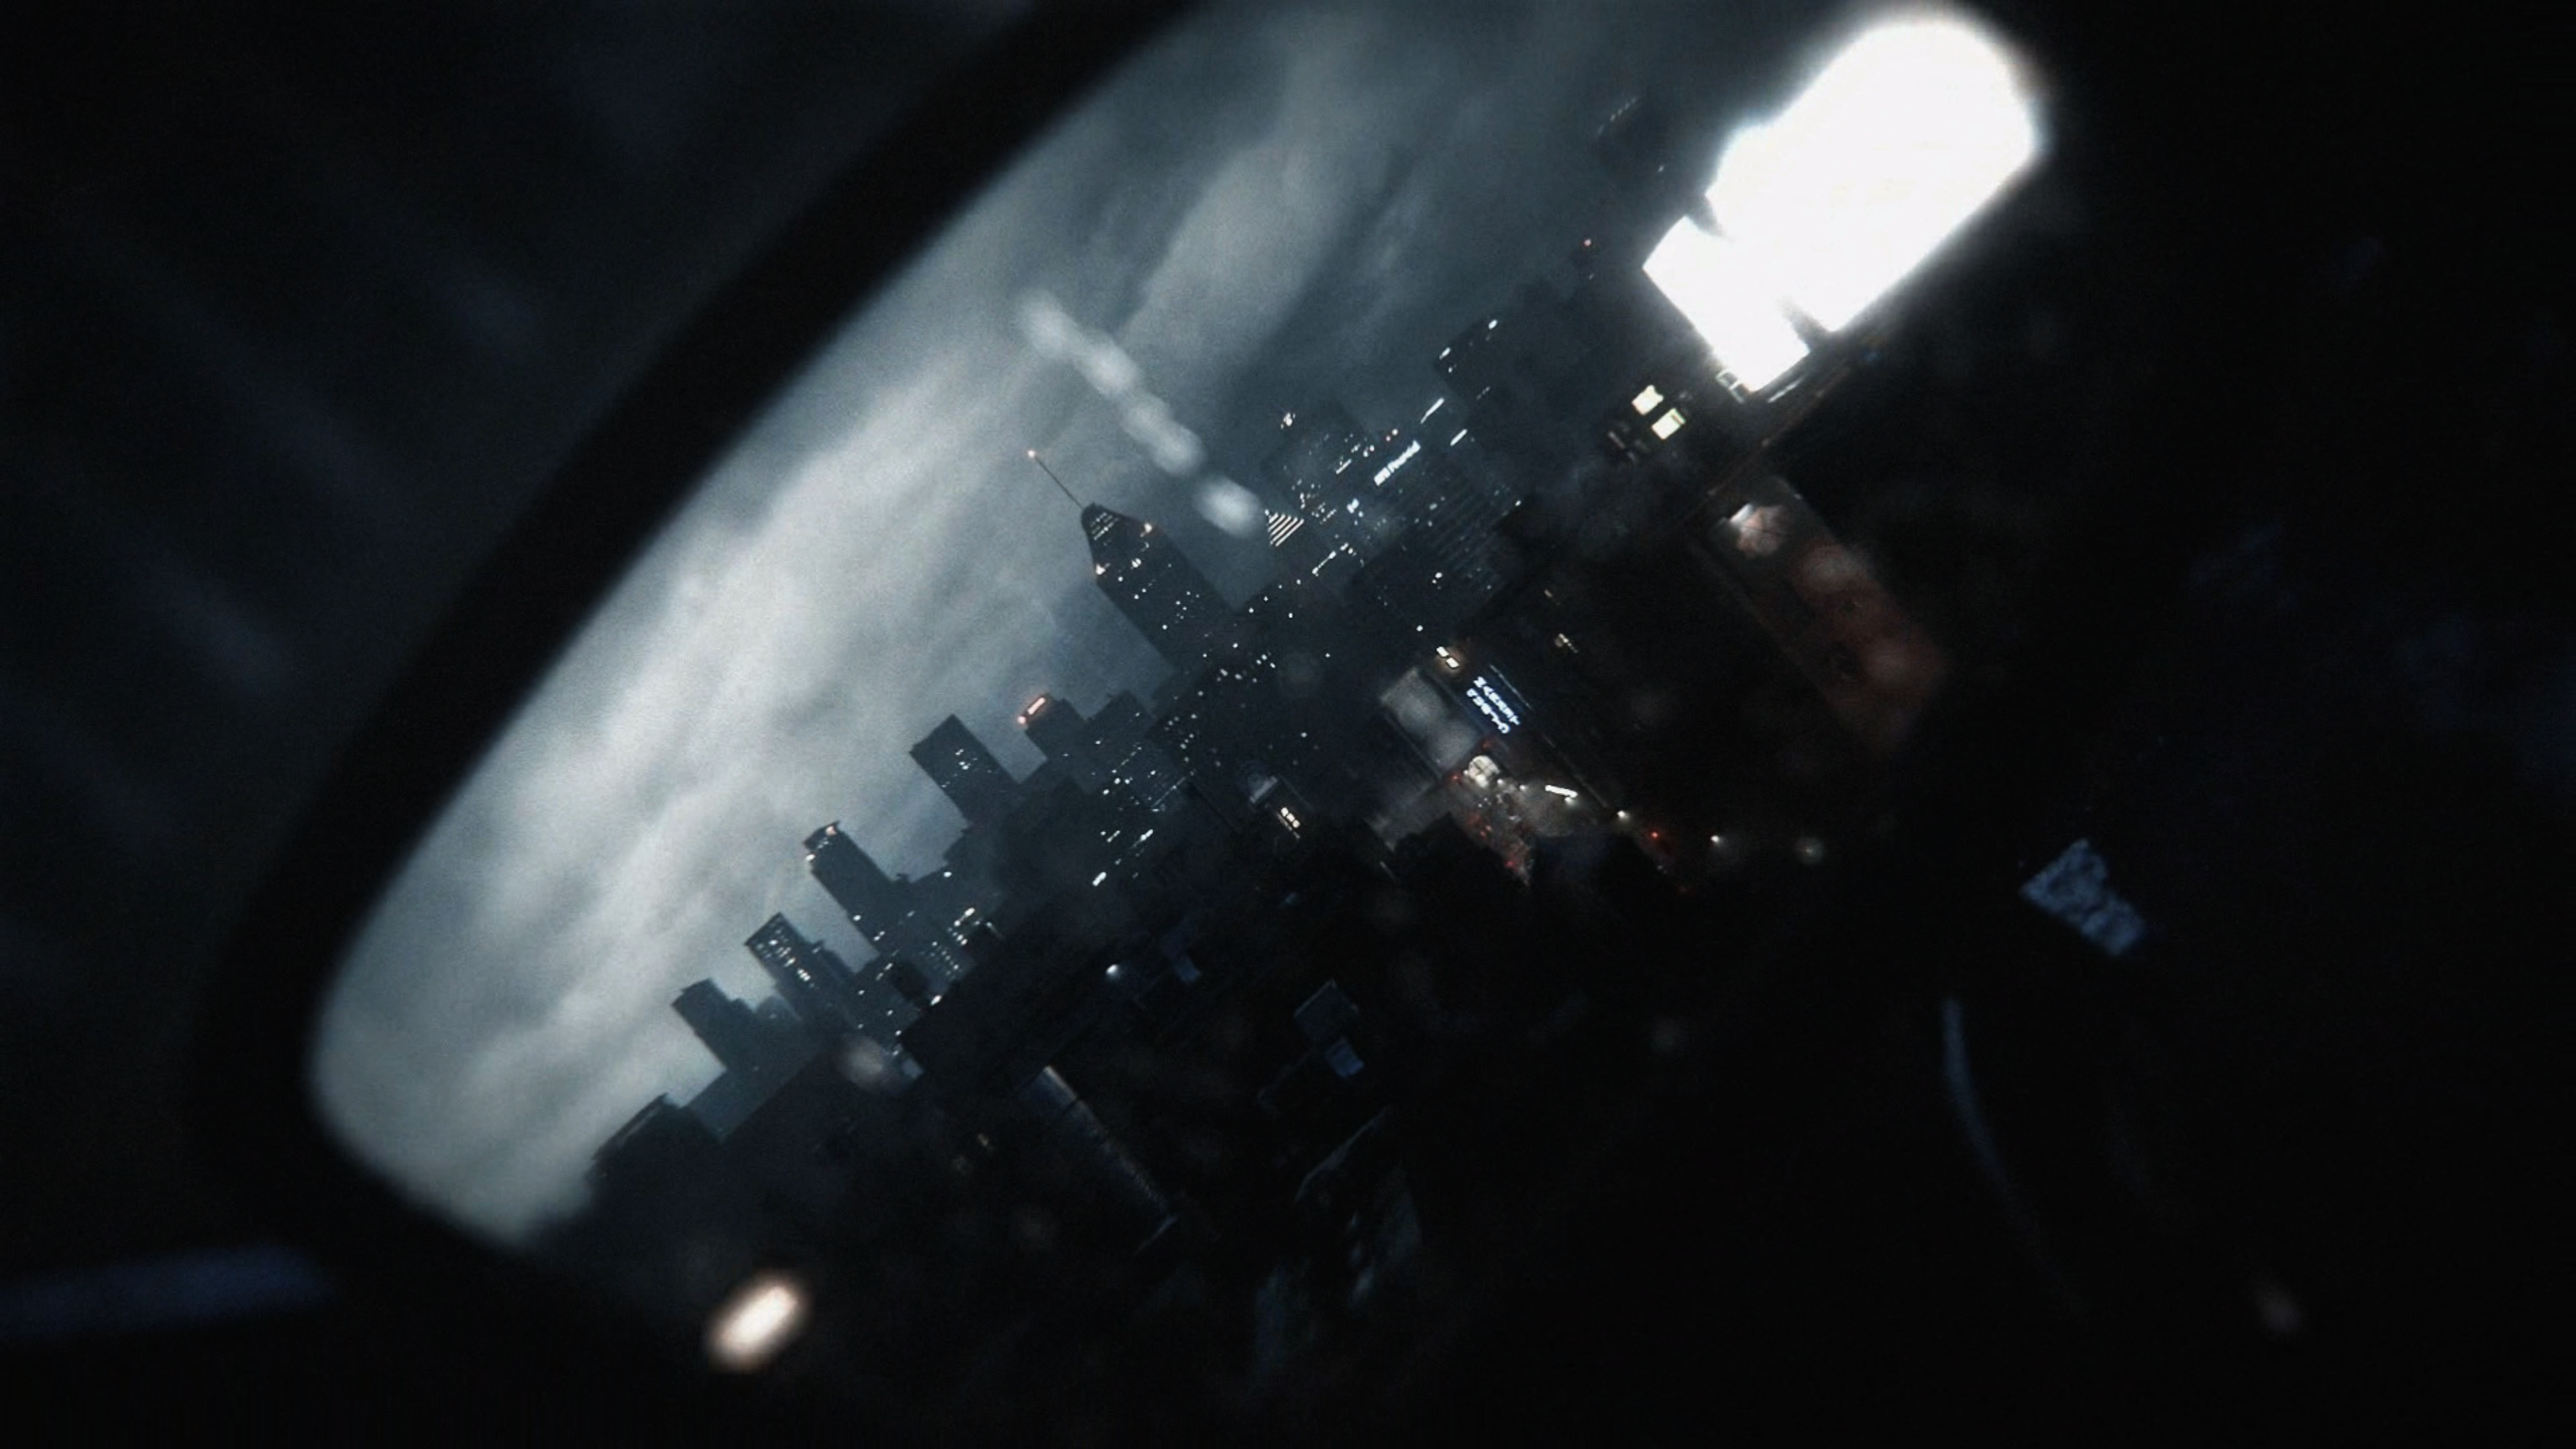
And, don’t ask me about the big-headed-Leon! 😅it’s just the clearing & skybox habit. Don’t blame a skybox for acting like a skybox!
Weirdo Stuff
While (as it seem) i’m already loved that Engine, but it has it’s own weird stuff, just like any other engine. One thing that caught my attention, is the possibility of mistakenly shipping the editor splashes with the final game. i could be wrong, but those images i was able to spot in some frames, they mean nothing to me except either editor spalshes or “bad” marketing footages.
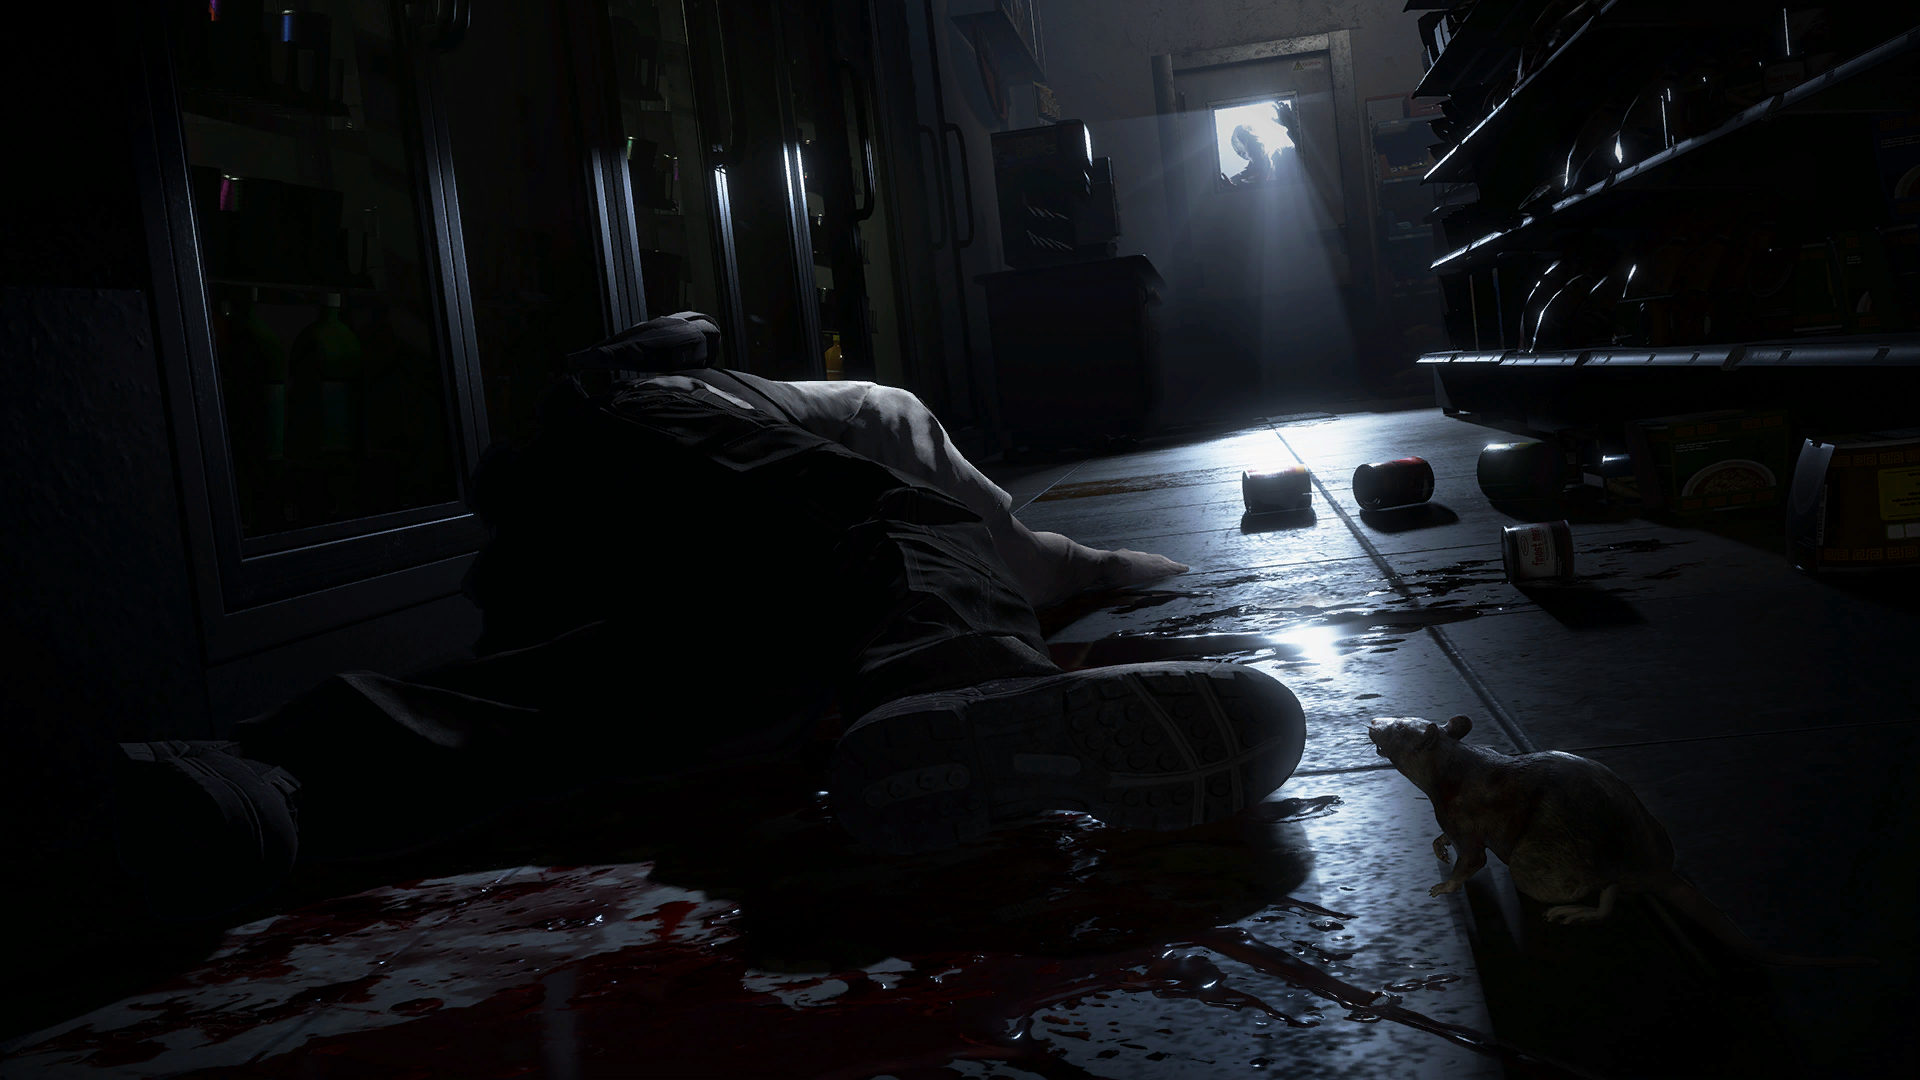
Splash Screens
Splash screens (the ones you see at start of the exe every time), those ones i’ve been tricked to think that they’re movies, because the “blurry-ness” of them, but when i had a look, it was much more simple than that..Just 1920*1080 textures of the format BC1_SRGB with a single mipmap, that is scaled up or down to fit the output resolution and drawn at the UI pass. And of course with some post processing it looks more “filmic” or like “mp4” files!


Now this is something you could guess, and you hit or miss. But the interesting thing here, that during that startup sequence, the renderer is working in full workload. Just like the game intro movie (previous paragraph), but at least for the intro movie there is a full frame rendered because you might skip at any moment that pre-rendered movie and jump right away to the action. But here, during splash screen, why there is HI-Z, SSR, Compress Normals, Velocities, Deferred, Lighting, Culling, AO, Motion Blur, Bloom, DOF,…etc. happening?
Why you lit without lights, or cull light sources without any light sources, or cull world geo without a single geo in the world!?
Totally Not Important Note
We’re living in a good time, computation power went very far (and it will keep leaping faster and further), but at the same time, don’t abuse that power, always use what you want, and leave the rest to rest. It could “sound” trivial issue, but for me (at least) it is big thing…this is “practice” or “mindset” that can be reflected in many other things across the project, other projects and across the one’s life.

The good thing, those passes are running, but don’t process much, and all render targets or buffers, return empty data or black textures. But still, a not needed work load. Specially when the renderer is very well organized into very very clear and distinctive passes that can be skipped.
Epilogue
That was FUN to dig & study!
As i mentioned that i wanted to do this for long time, but as a matter of fact, for the first time ever to be happy for delaying a goal! i can now imagine looking into yet another D3D11 game with nothing super fancy. But doing that study now, allowed me to look at the (yet) best version of RE Engine games.
Also while i’ve enjoyed a lot this long waited & forgotten study, i wanted to elaborate in the painful of taking captures in 4K. i kinda liked the default settings with target 4K after upscaling, but i did not enjoy the time spent in taking captures. If my usual captures are used to be in the range of ~1.GB, for this game it was between 2.GB to 2.5GB per single capture…And i did take a ton! Storing the capture on drive takes long time, not to mention looking through it takes long time too, as textures loading becomes a nightmare for my memory. Not only that, but for example i usually open 5 to 10 captures and dig them at the same time, so i can get sense of something at multiple scenarios, but due to the large file size, my PC (which should be good enough) crash if i try to open a 4th GPU capture. Even with maximum 3 opened captures, still going between different passes and textures, was slow as hell (not to add the summer heat). So, all in all, digging RE captures was like spicy food, you get too much pain in the process, but you enjoy eating it!
RE Engine for me, i would refer to it as CryEngine 7 (you might’ve noticed that i mentioned CryEngine & Crytek quite a few times during the article). The engine is HEAVILY adopting ideas and techniques from CryEngine, specially since the revolutionary talks of CryEngine 3…But it’s much better & way lighter…
At the end, i want to thank Capcom, not because they made good games or amazing Engine, but because they have successfully (with the power of Technology, Science, Art and Math) been able to deliver us the best looking and the most satisfyingly tasty cheese burger sandwich in the history of 3d games! Thank you Capcom…
To Capcom, with love… i wish i can get access to your RE Engine Source Code…i wish… <3
Related Readings & Videos
Enables “the fastest development in the world”! What is Capcom’s new game engine “RE ENGINE”
More about 4K 3840 × 2160
CGWORLD vol.222
AMD FidelityFX Super Resolution (FSR)
AMD FidelityFX Contrast Adaptive Sharpening (CAS)
AMD FidelityFX Combined Adaptive Compute Ambient Occlusion (CACAO)
Optimizing Triangles for a Full-screen Pass – Chris Wallis
Screen Space Reflections : Implementation and optimization – Part 1 : Linear Tracing Method
Screen Space Reflections : Implementation and optimization – Part 2 : HI-Z Tracing Method
Graphics Gems from CryENGINE 3 (Siggraph 2013)
Automatic Exposure Using a Luminance Histogram
Exposure (Volume Framework) – Unity3d
Hi-Z Screen-SpaceCone-Traced Reflections
GPU Gems 3 – Chapter 13. Volumetric Light Scattering as a Post-Process
Nicolas Menzel – Volumetric Lighting
Skinning in a Compute Shader
GPU Gems – Chapter 29. Efficient Occlusion Culling
GPU Gems 2 – Chapter 6. Hardware Occlusion Queries Made Useful
Experiments in GPU-based occlusion culling
Hierarchical-Z map based occlusion culling
Optimizing the Graphics Pipeline with Compute, GDC 2016
Coverage Buffer as main Occlusion Culling technique